Maple Finance (SYRUP) is hovering around the $0.2700 USD mark at the time of recording on Friday, as buying pressure persistently protects the S1 Pivot support zone at $0.2497 USD. The steady price maintenance indicates that market sentiment is gradually stabilizing after recent fluctuations.
From an on-chain data perspective, demand for this DeFi protocol remains positive. Total Assets Under Management (AUM) has surpassed $4 billion USD, while revenue continues to hold steady after reaching a record high in January — a sign reinforcing investor confidence in the platform.
On the technical side, SYRUP is signaling a potential recovery as selling pressure appears to weaken, opening room for a new upward move if demand continues to be sustained.
Maple Finance Maintains Revenue, Attracts Whales
Data from Dune Analytics dashboards show that Maple Finance has generated $1.46 million USD in revenue so far this month, after hitting a record high of $2.57 million USD — mostly from lending activities and yield optimization strategies. This trend follows steady monthly growth, after the protocol recorded $2.49 million USD in December.
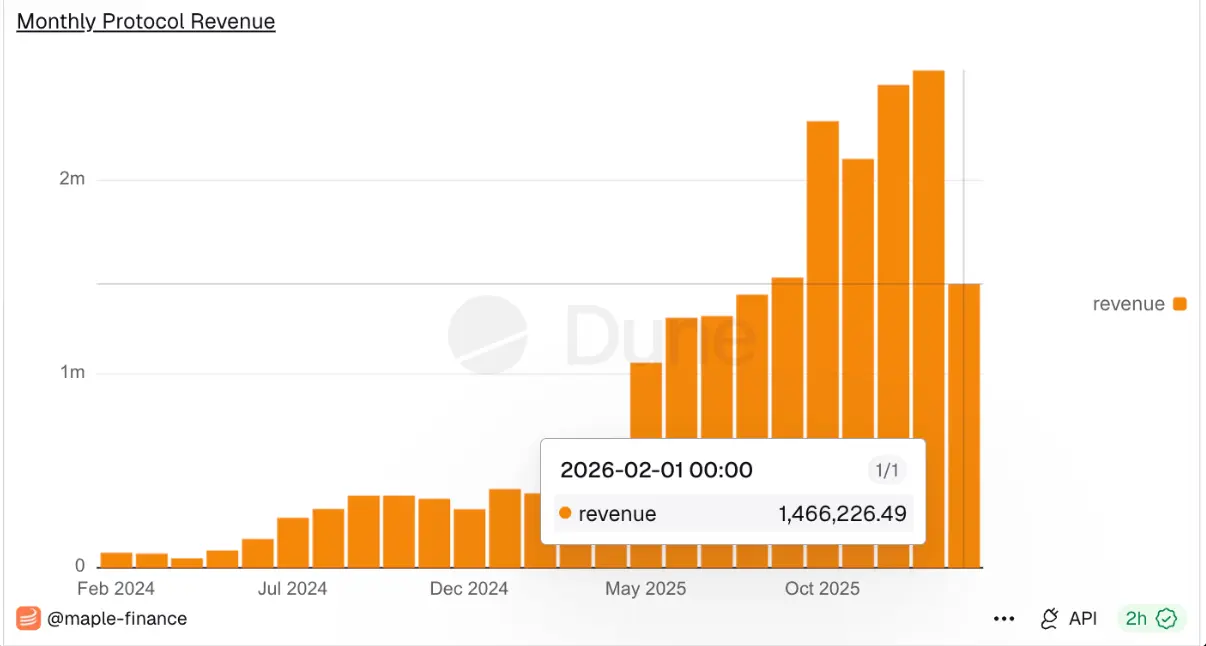 Monthly Revenue of Maple Finance | Source: Dune
Meanwhile, Maple Finance’s total assets under management (AUM) have exceeded $4 billion USD, with lending debt reaching $1.08 billion USD. The combination of stable revenue streams and expanding asset scale indicates that the protocol’s ecosystem is accelerating, benefiting from continuously rising market demand.
Monthly Revenue of Maple Finance | Source: Dune
Meanwhile, Maple Finance’s total assets under management (AUM) have exceeded $4 billion USD, with lending debt reaching $1.08 billion USD. The combination of stable revenue streams and expanding asset scale indicates that the protocol’s ecosystem is accelerating, benefiting from continuously rising market demand.
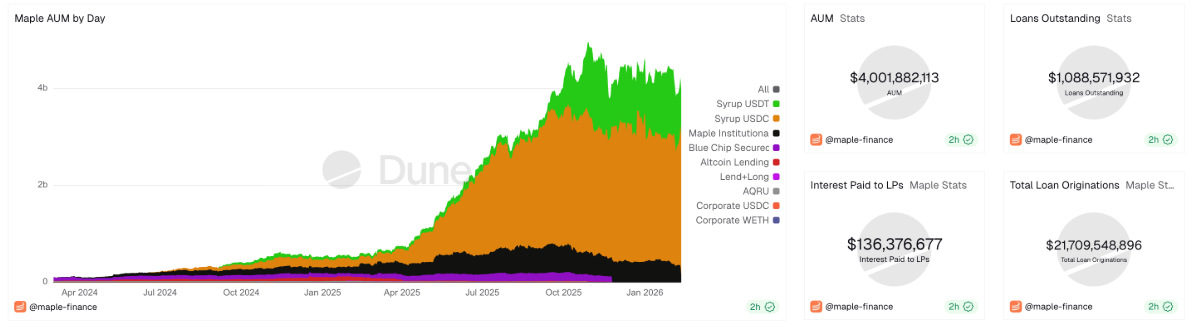 Maple Finance’s Total Assets Under Management (AUM) Data | Source: Dune
Further supporting this positive outlook, data from CryptoQuant shows stable interest from large investors — often called “whales” — as reflected by the average size of SYRUP orders in the spot market, indicating that significant capital is quietly accumulating.
Maple Finance’s Total Assets Under Management (AUM) Data | Source: Dune
Further supporting this positive outlook, data from CryptoQuant shows stable interest from large investors — often called “whales” — as reflected by the average size of SYRUP orders in the spot market, indicating that significant capital is quietly accumulating.
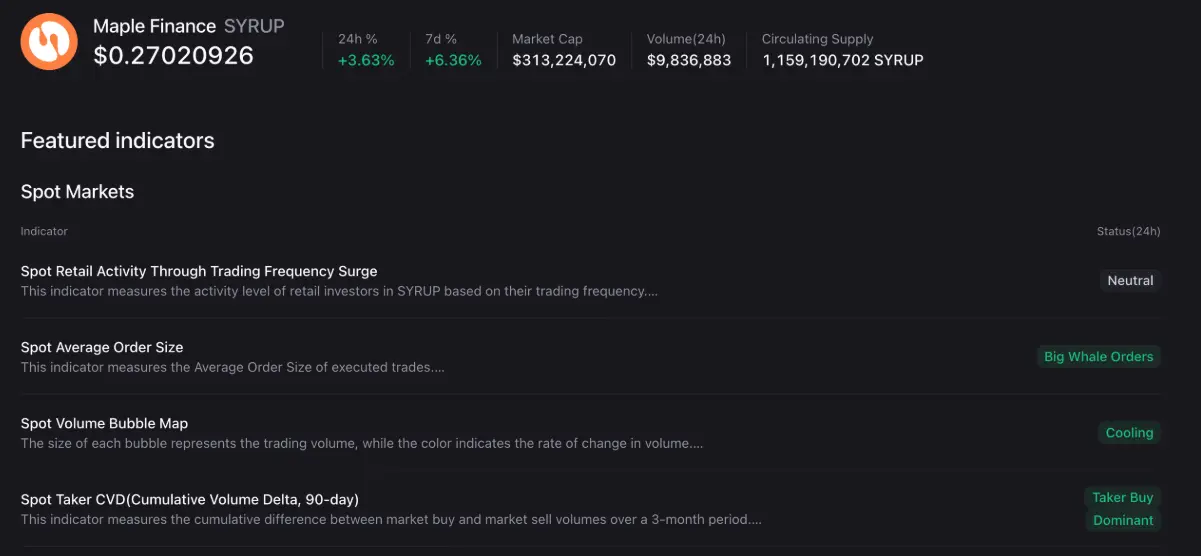 Spot Market Indicators for SYRUP | Source: CryptoQuant
Technical Outlook: Can SYRUP Recover in a Downtrend Channel?
Maple Finance currently trades just above the S1 Pivot level at $0.2497 USD — a short-term support buffer formed after a 31-day decline that saw SYRUP lose about 35% of its value. This movement clearly reflects a downward trajectory within a larger descending channel pattern, established by two parallel trendlines on the daily timeframe.
Conversely, a technical rebound could see SYRUP testing the 50-day Exponential Moving Average (EMA) at $0.3176 USD, before aiming for the 200-day EMA at $0.3666 USD — an area coinciding with the upper boundary of the price channel and serving as a key resistance level.
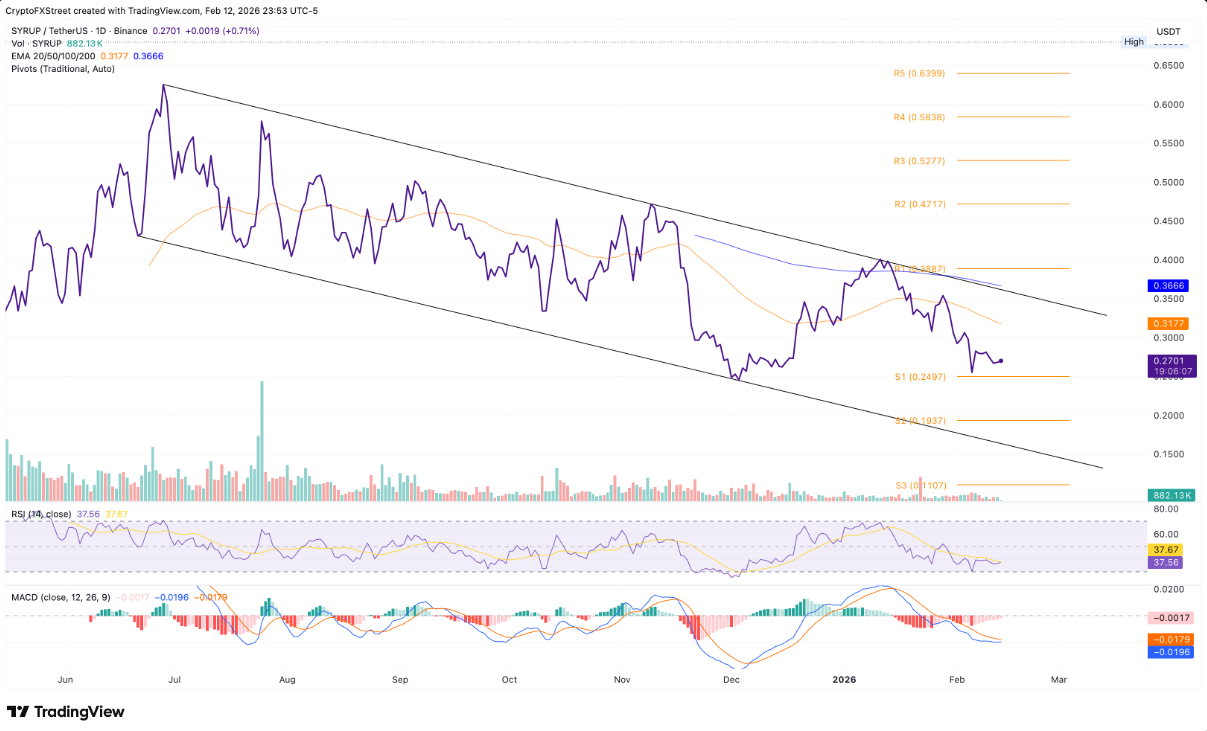 Daily SYRUP/USDT Chart | Source: TradingView
Technical signals suggest selling pressure is gradually weakening. The RSI currently hovers around 36, remaining above the oversold zone and sideways after a deep decline, implying that selling momentum is no longer overwhelming. Additionally, the MACD line is approaching the signal line as the histogram’s negative side narrows, increasing the likelihood of a bullish crossover — a potential short-term reversal indicator.
Daily SYRUP/USDT Chart | Source: TradingView
Technical signals suggest selling pressure is gradually weakening. The RSI currently hovers around 36, remaining above the oversold zone and sideways after a deep decline, implying that selling momentum is no longer overwhelming. Additionally, the MACD line is approaching the signal line as the histogram’s negative side narrows, increasing the likelihood of a bullish crossover — a potential short-term reversal indicator.
However, a negative scenario should still be considered. If SYRUP closes below the $0.2497 USD level, selling pressure could intensify, pushing the price down toward the S2 Pivot at $0.1937 USD.
Disclaimer: The information on this page may come from third parties and does not represent the views or opinions of Gate. The content displayed on this page is for reference only and does not constitute any financial, investment, or legal advice. Gate does not guarantee the accuracy or completeness of the information and shall not be liable for any losses arising from the use of this information. Virtual asset investments carry high risks and are subject to significant price volatility. You may lose all of your invested principal. Please fully understand the relevant risks and make prudent decisions based on your own financial situation and risk tolerance. For details, please refer to
Disclaimer.
Related Articles
Bitunix Analyst: Hormuz Risk Escalation, Oil-Gold Chain Activation, BTC Upside Short Liquidity Accumulation
Dubai Gold Air Transport Hub flights suspended, Iran closes the Strait of Hormuz, leading to a sharp rise in oil prices and increased inflation expectations. Institutions favor gold, but rising oil prices may suppress gold prices. In the crypto market, BTC fluctuates between 69,500 and 70,500, with market focus on short squeeze and liquidity changes. Overall, macro volatility has increased, and BTC remains within the range, trading sideways.
GateNews1h ago
XRP Today's News: $650 million rush into exchanges, are investors preparing to sell?
In the past week, approximately 472 million XRP tokens flowed into exchanges, breaking the net outflow trend seen for several months and reflecting a defensive stance among holders amid geopolitical uncertainties. Although large inflows are generally seen as a warning sign of selling, they could also be a hedge. On the technical side, $1.30 is a key support level; if broken, the price could accelerate downward to $1.12. The resistance levels above are $1.50 and $1.61.
MarketWhisper2h ago
"1011 Insider Whale" claims the crypto market is still in a range-bound fluctuation
ChainCatcher Message: "1011 Insider Whale" GarrettJin posted on X platform stating that the current market transmission path is influenced by geopolitical impacts on the macro environment, which in turn further affects the crypto market. He pointed out that attention should be focused on indicators such as oil prices, the US dollar index, and the yields of 2-year and 10-year US Treasury bonds.
GarrettJin believes that the crypto market is still in a range-bound consolidation phase and states that maintaining caution is a common choice in the current environment.
GateNews2h ago
Bloomberg: The US-Iran conflict has limited impact on Bitcoin, currently consolidating between $60,000 and $70,000.
Bitcoin briefly declined in the US following news of strikes against Iran, but then rebounded, with trading prices surpassing pre-attack levels, indicating the market's low sensitivity to risk. After a significant correction, Bitcoin consolidated in the $60,000 to $70,000 range, retail participation decreased, and overall inflows weakened, resulting in a smaller impact from the new shock.
GateNews2h ago
Pi Network Foundation sells 48.88 million tokens, PI technical outlook is bearish
Pi Network recently experienced a surge in market supply after the foundation sold 48.88 million tokens, causing the price to fluctuate around $0.1700. Technical analysis shows that PI failed to break above the 50-day EMA at $0.1740, indicating a generally bearish outlook. If the $0.1700 support level is broken, further declines may occur. The community has criticized the transparency of token transfers, which has impacted market confidence.
MarketWhisper2h ago
Bitcoin briefly surged past $70,000 before falling back! Iran's capital outflow surged by 700%, VanEck calls it "building a bottom"
Bitcoin plunged and then rebounded after the US and Israel airstrikes on Iran, reaching a high of $70,110, currently around $68,500. Capital outflows from Iran's largest crypto exchange Nobitex surged by 700%, indicating that cryptocurrencies are becoming a channel for capital flight. VanEck's CEO believes the market is in a bottoming phase and remains optimistic about the future. Meanwhile, JPMorgan's Dimon warns of inflation risks, showing that geopolitical uncertainties continue to impact the market.
動區BlockTempo2h ago