The bullish divergence of Cardano has failed - Could the whale selling $540 million be the cause?
Cardano (ADA) price experienced a sharp 24% increase after a classic bullish divergence signal appeared on the daily chart. However, the price quickly declined afterward. On-chain data shows a coordinated sell-off by large investors (whales) totaling over $540 million, while the Money Flow Index (MFI) confirms that retail investors are still actively buying the dip.
Below are the event developments and possible future scenarios.
RSI Divergence Signal and Confirmation from MFI
From 12/31/2025 to 2/24/2026, ADA’s daily chart formed a bullish divergence. While ADA’s lows were getting lower between late December and February 24, the Relative Strength Index (RSI) indicator showed higher lows.
This phenomenon—lower lows in price but higher lows in RSI—often indicates weakening downward momentum, even as prices continue to fall.
This divergence was confirmed on 2/25 when ADA rose nearly 24%, reaching a peak of $0.31 before a long upper wick appeared—signaling strong selling pressure at the high.
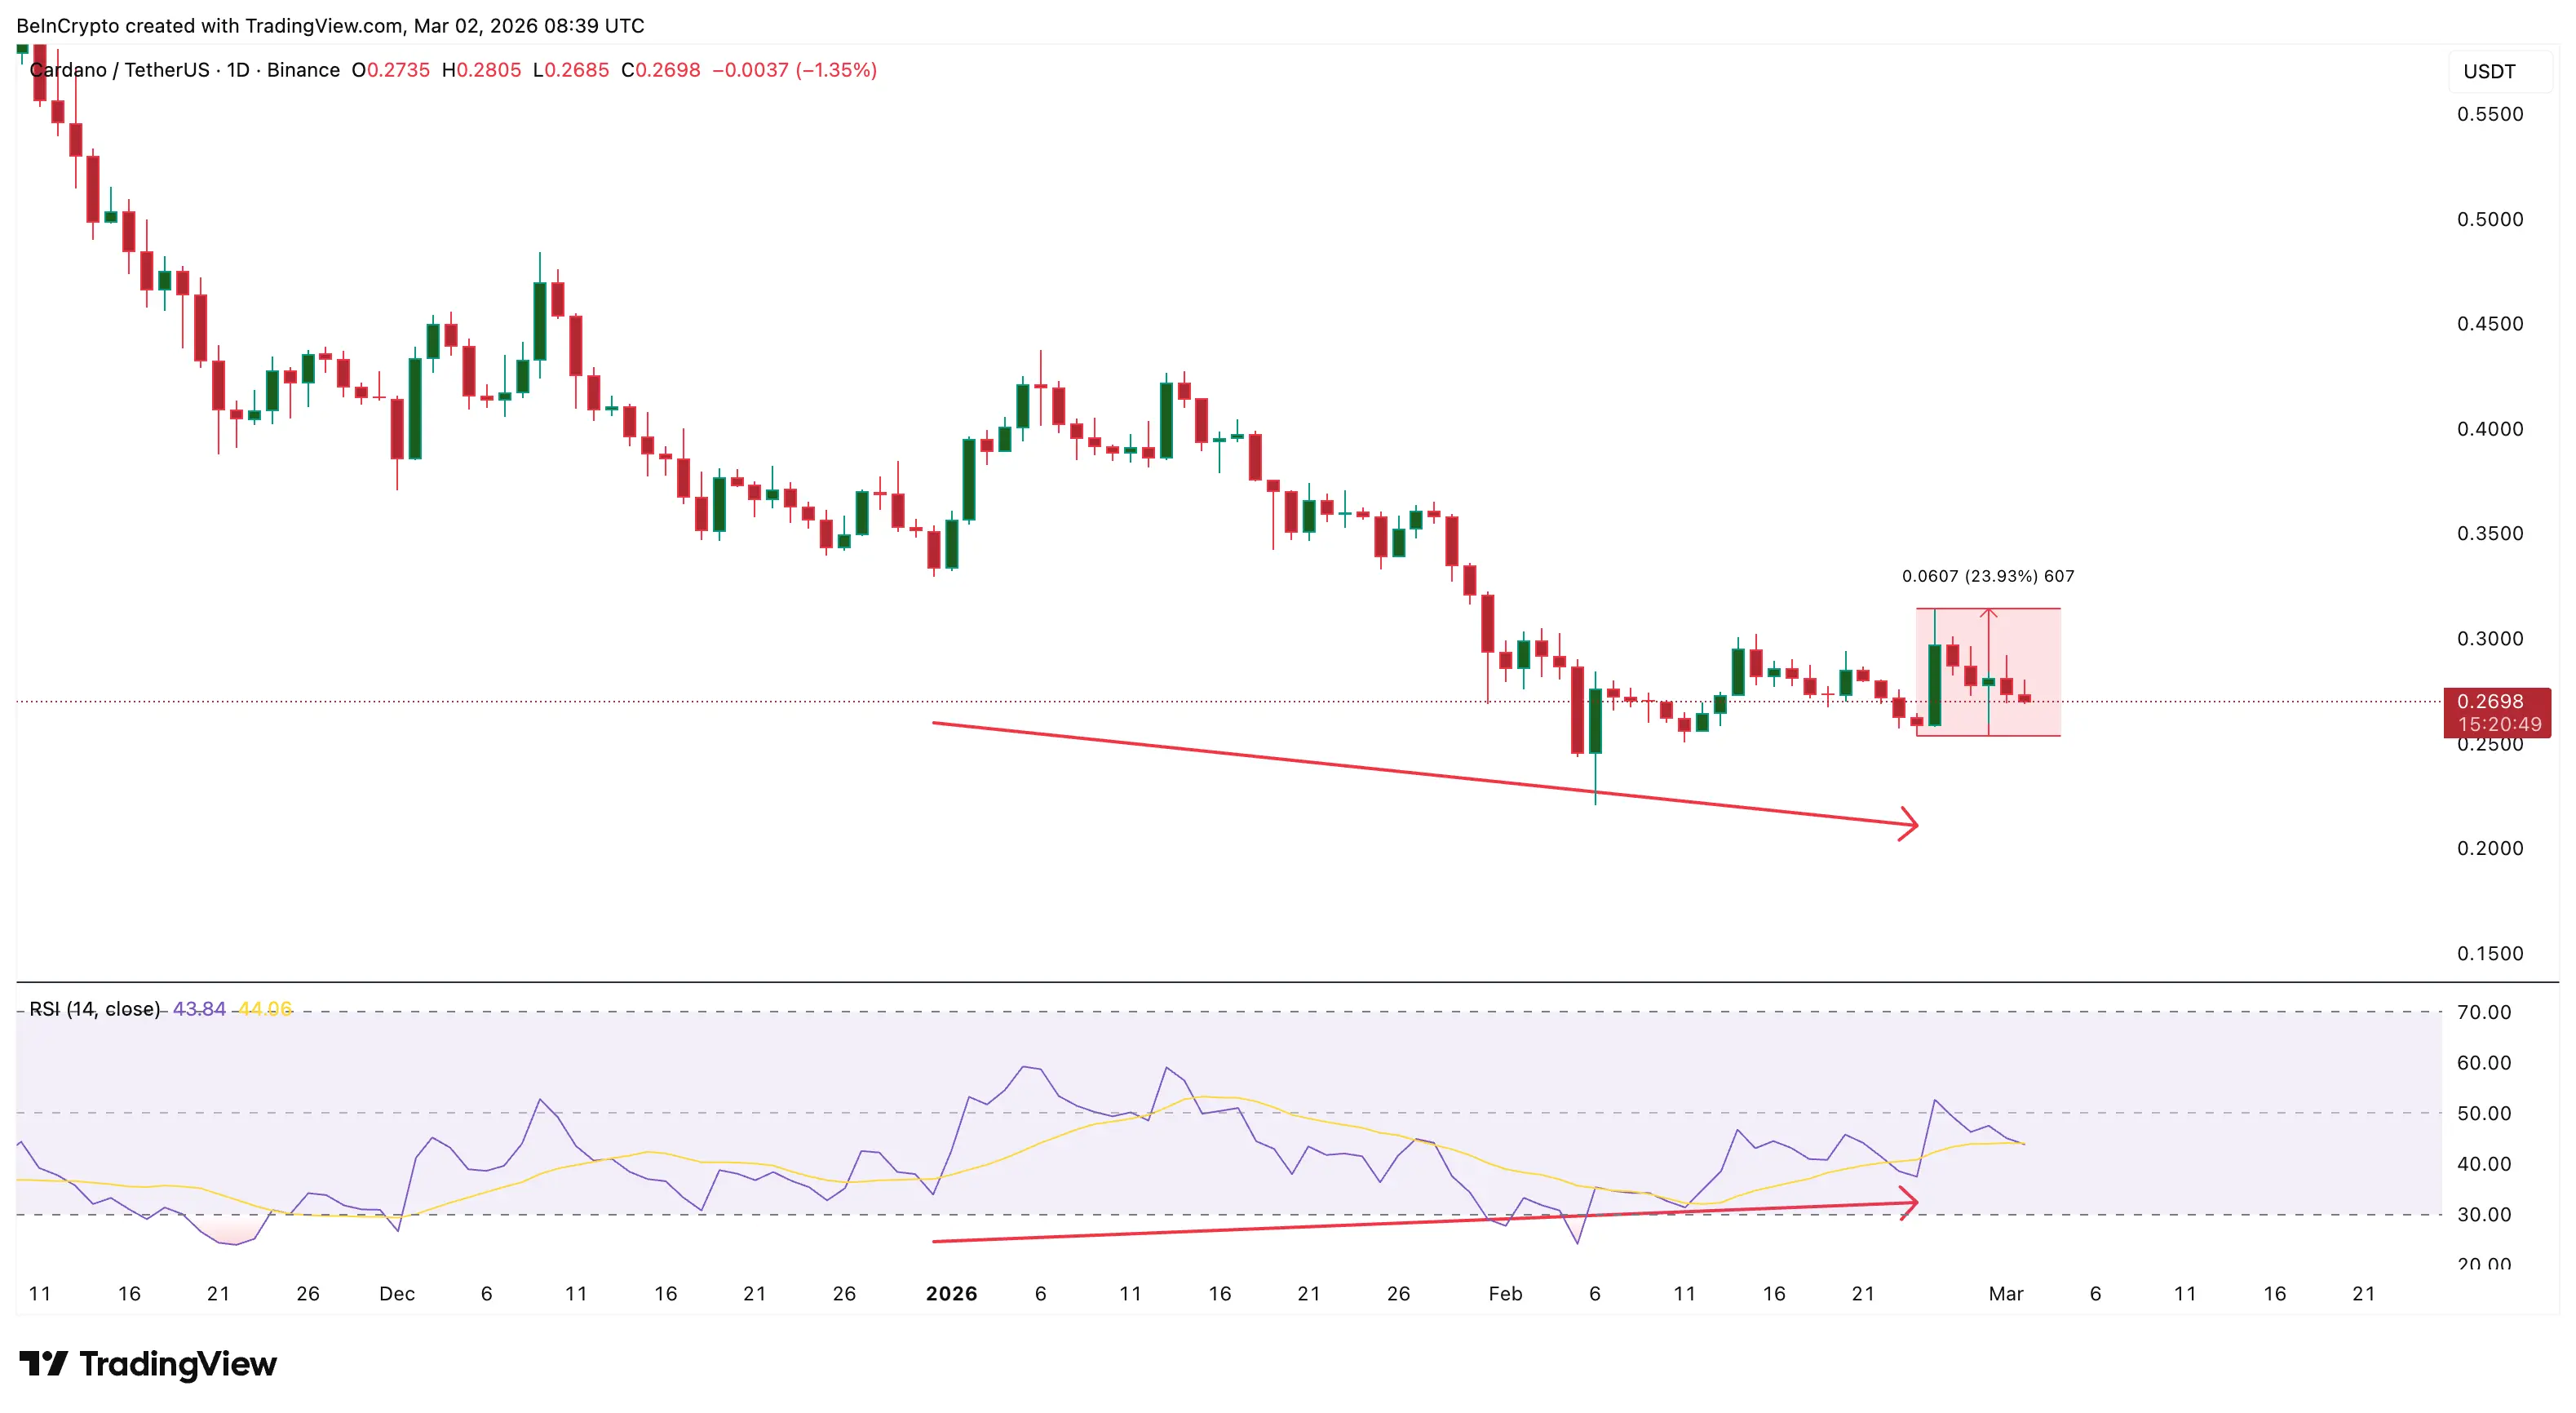 Cardano Price Structure | Source: TradingView
What’s notable here is the support from the Money Flow Index (MFI). This momentum indicator, weighted by volume, measures buying and selling pressure based on both price and volume, scoring from 0 to 100. Unlike RSI, which only considers price, MFI accounts for trading volume, providing a more direct view of actual capital inflows and outflows.
Cardano Price Structure | Source: TradingView
What’s notable here is the support from the Money Flow Index (MFI). This momentum indicator, weighted by volume, measures buying and selling pressure based on both price and volume, scoring from 0 to 100. Unlike RSI, which only considers price, MFI accounts for trading volume, providing a more direct view of actual capital inflows and outflows.
From 2/24 to 2/28, both price and MFI increased simultaneously, with no signs of bearish divergence on the MFI. This suggests that the dips were absorbed by genuine buying interest, rather than price increases driven solely by low liquidity. Clearly, a large number of investors actively absorbed the selling pressure.
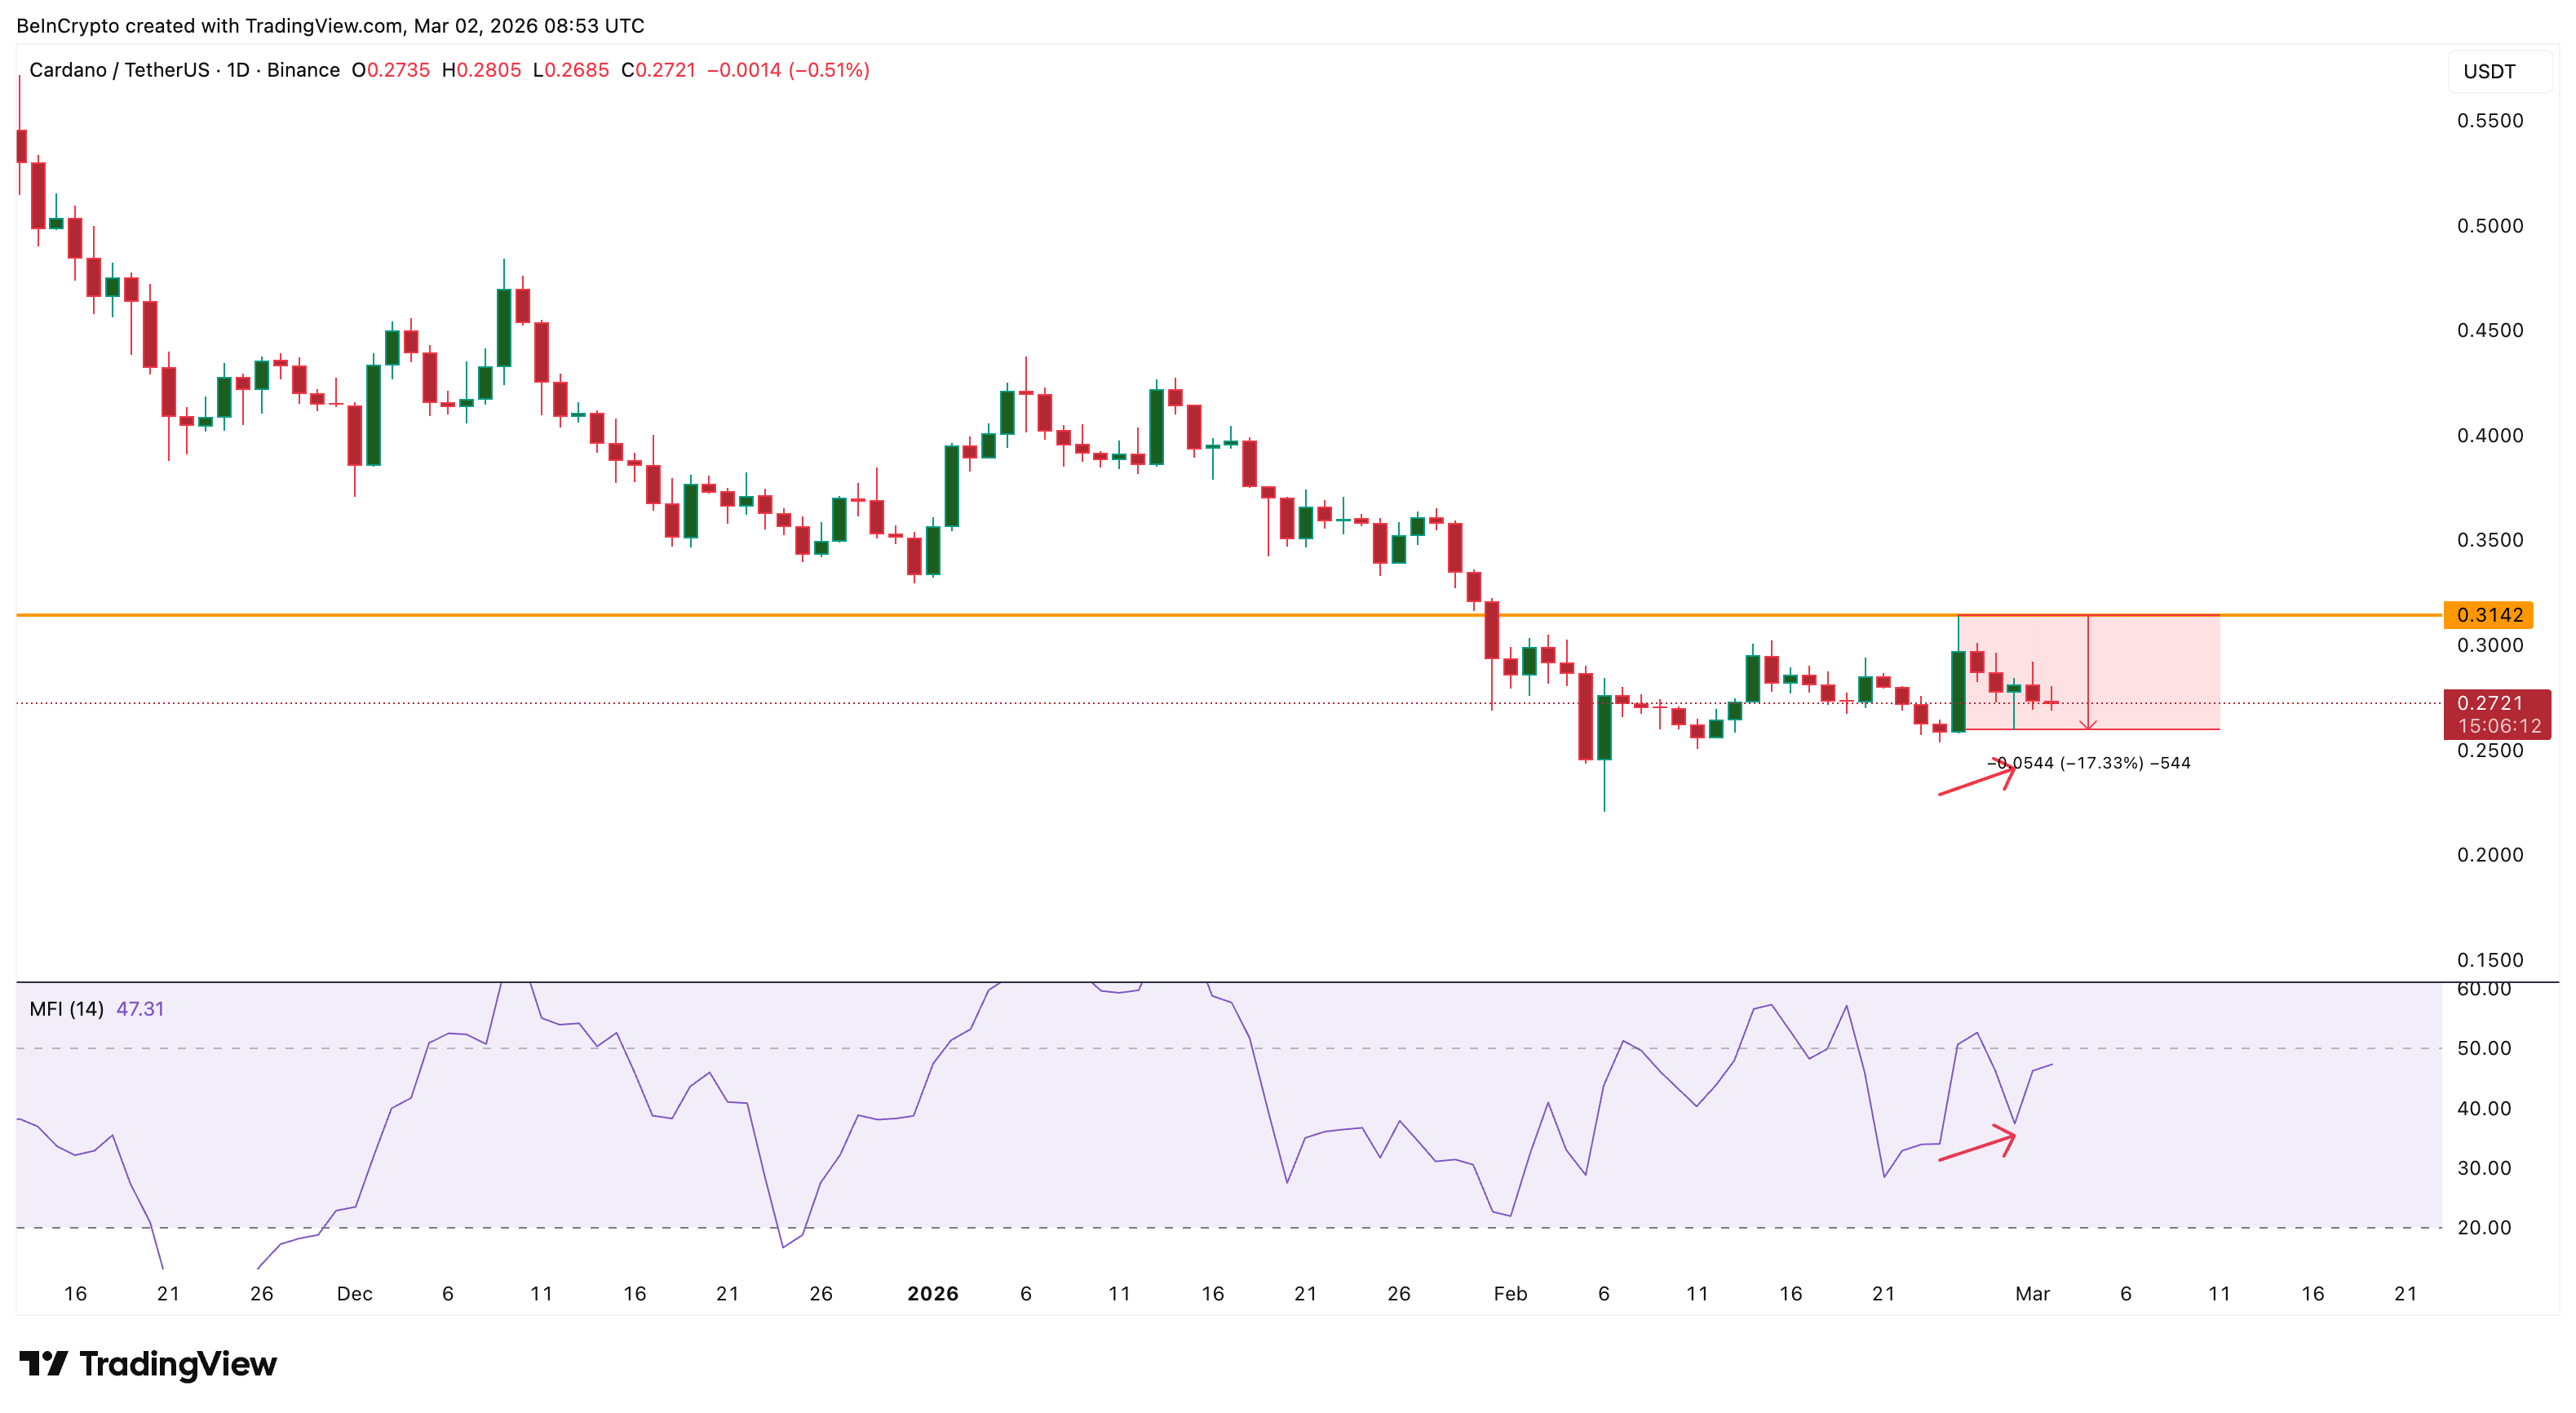 Continued Buying on Dips | Source: TradingView
However, despite the RSI divergence signal and MFI confirming buying interest, ADA’s price plunged 17% within days after the February 25 peak. What caused this rally to fail?
Continued Buying on Dips | Source: TradingView
However, despite the RSI divergence signal and MFI confirming buying interest, ADA’s price plunged 17% within days after the February 25 peak. What caused this rally to fail?
Over 2 Billion ADA Sold in 3 Days: Whales as the Main Cause
On-chain data reveals the main reason for this decline. According to Santiment, from 2/24 to 2/27, all major whale groups simultaneously reduced their ADA holdings.
The group holding over 1 billion ADA executed the largest sell-off, reducing about 1.02 billion ADA in a single day (2/24–2/25)—dropping holdings from 2.90 billion to 1.88 billion ADA.
The group holding between 100 million and 1 billion ADA initially bought on 2/24, possibly to absorb some selling pressure, but then sold heavily on 2/27, decreasing from 3.47 billion to 2.61 billion ADA—about 860 million tokens.
The group holding between 10 million and 100 million ADA also sold approximately 220 million ADA during this period, decreasing from 13.90 billion to 13.68 billion ADA. Even the smallest whales, holding 1 million to 10 million ADA, reduced their holdings from 5.69 billion to 5.64 billion ADA, offloading roughly 50 million ADA.
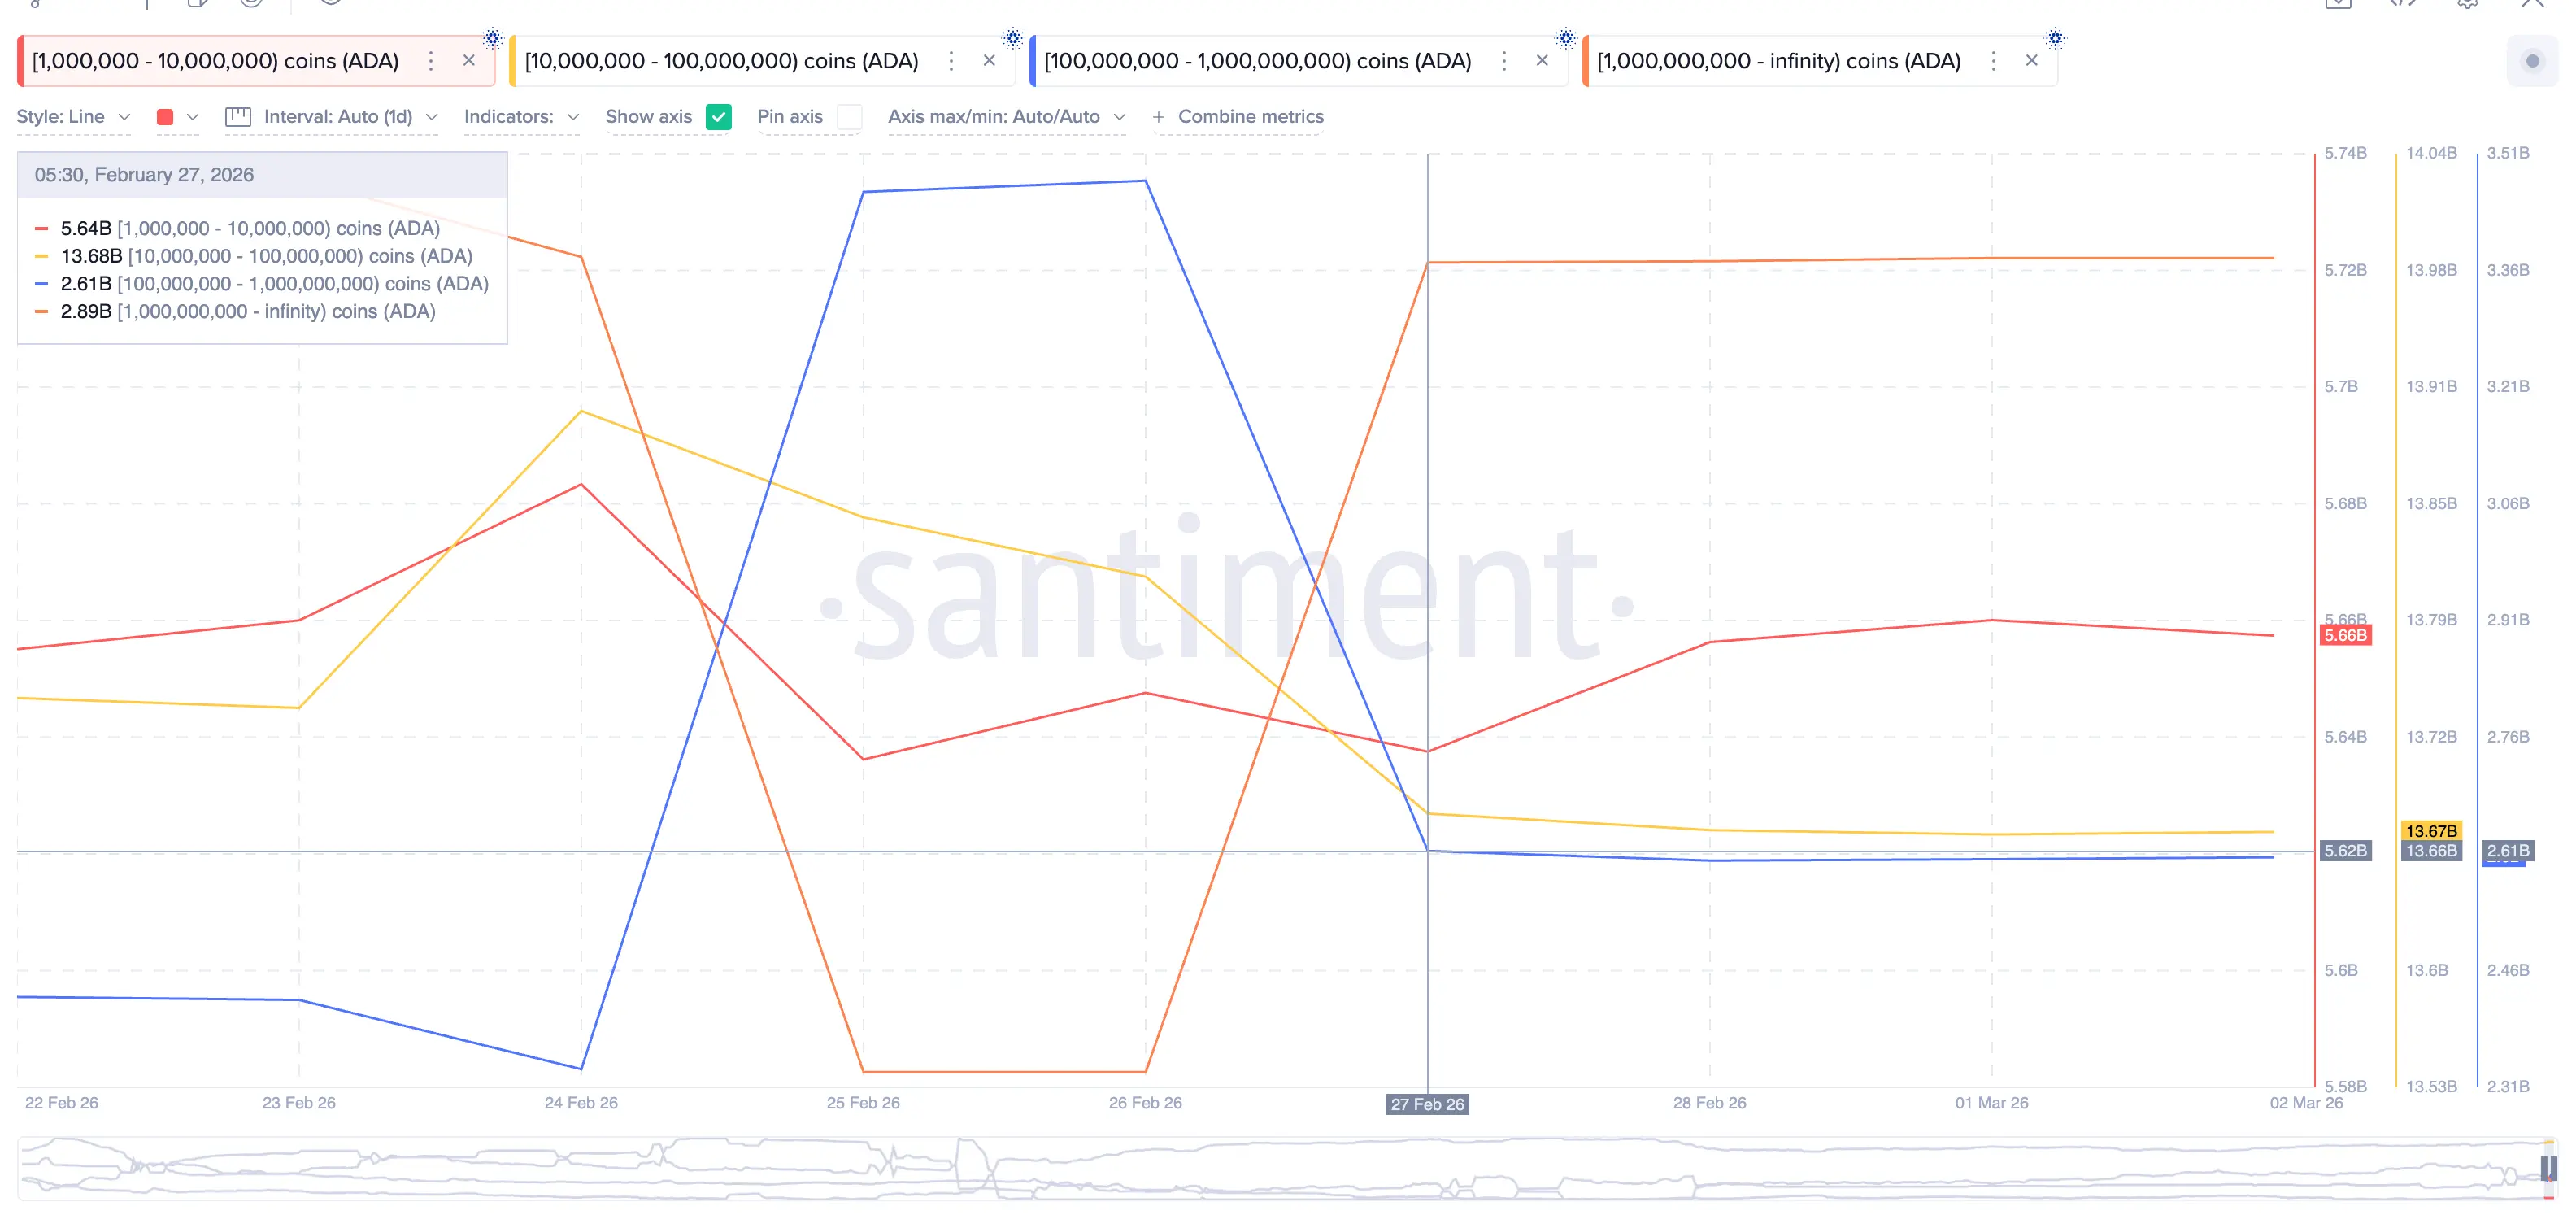 ADA Whales | Source: Santiment
In total, about 2.15 billion ADA were sold by whale groups over three days. At an average price of around $0.27 during this period, this equates to selling pressure of approximately $540 million—all entering the market just as retail investors were actively buying.
ADA Whales | Source: Santiment
In total, about 2.15 billion ADA were sold by whale groups over three days. At an average price of around $0.27 during this period, this equates to selling pressure of approximately $540 million—all entering the market just as retail investors were actively buying.
MFI data indicates genuine buying support, but whale data shows a large supply was sold off. Retail investors and mid-sized addresses tried to absorb whale selling pressure, but the massive scale of liquidation in a short time overwhelmed this absorption capacity.
Derivatives Market Reinforces ADA’s Downtrend
Derivatives market data also paints a similar picture. Open interest in Cardano futures contracts dropped sharply from a peak of $1.95 billion in September to below $450 million in mid-February—one of the lowest levels of the year. This suggests retail traders using leverage largely exited the market before the divergence signal appeared.
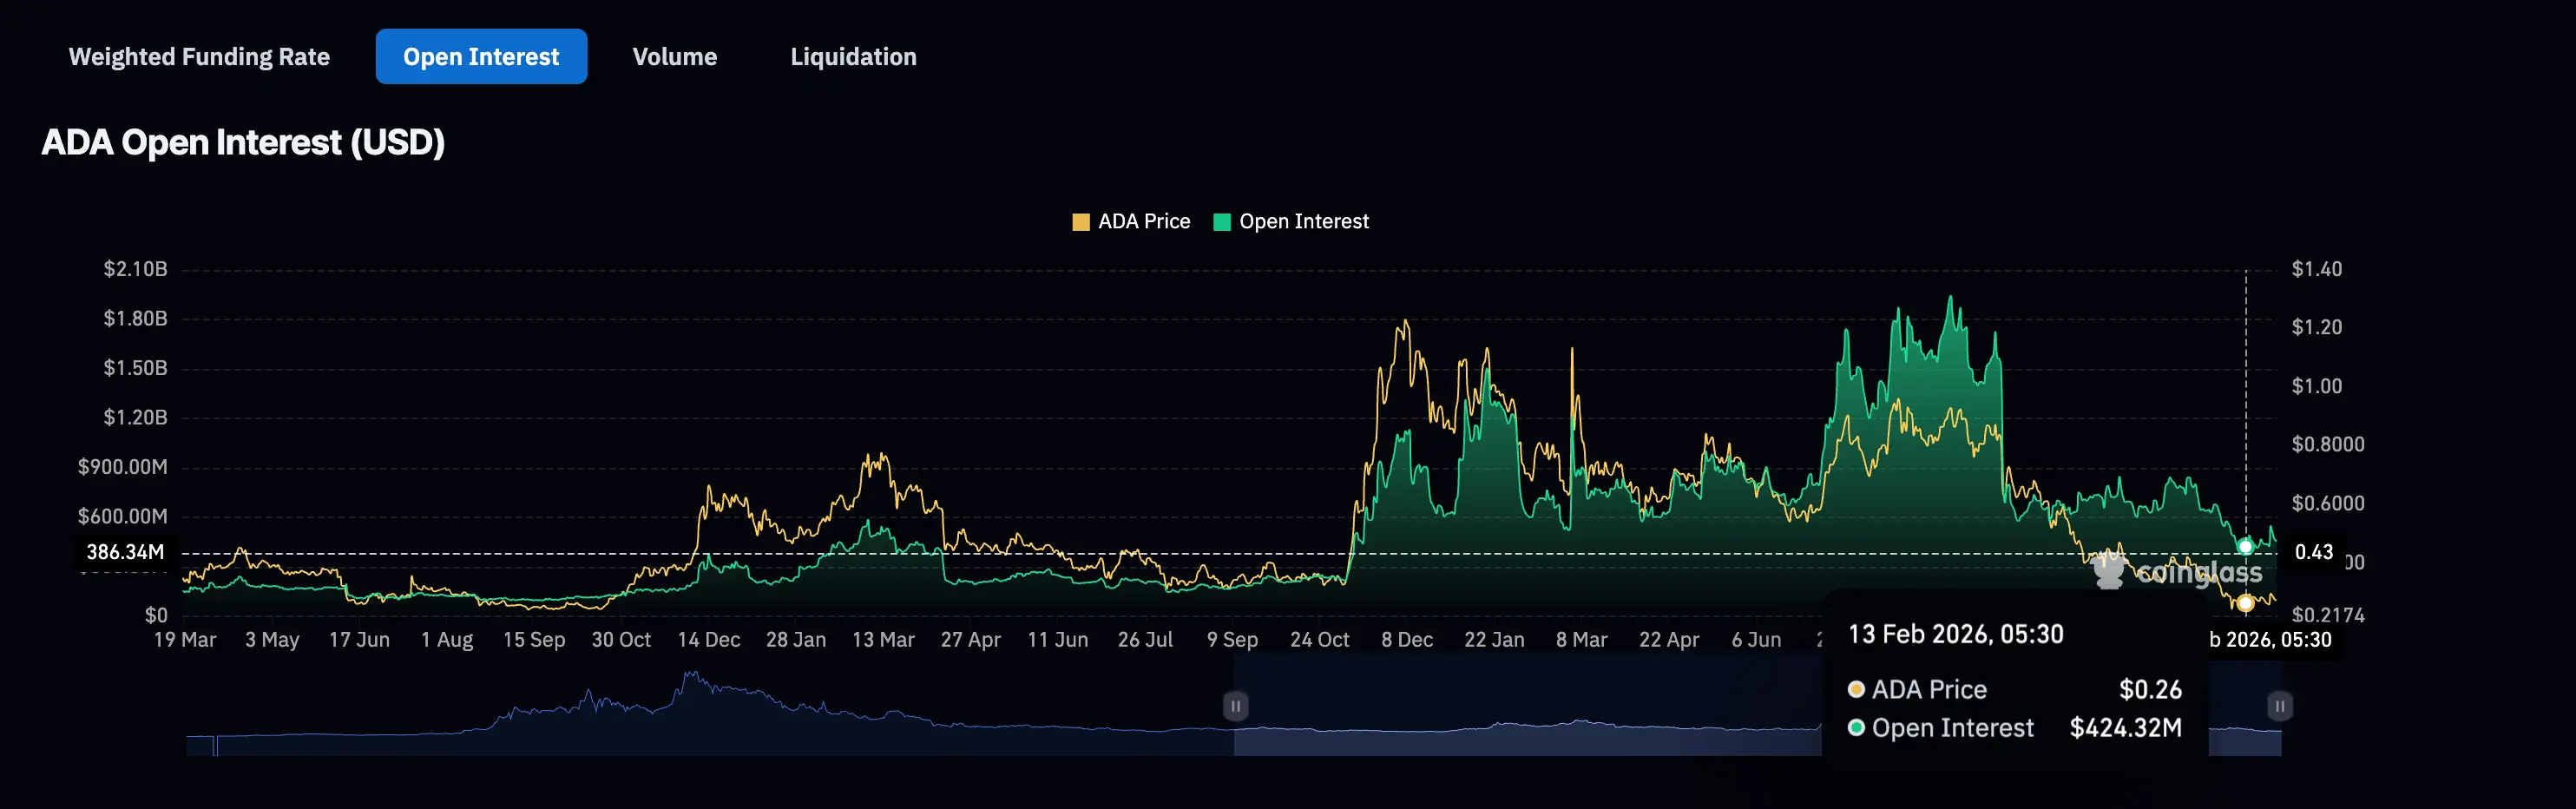 Open Interest Volume | Source: Coinglass
Therefore, the buying support indicated by the MFI likely came from spot trading, as retail investors accumulated during the dip, guided by the RSI divergence signal. However, spot buying alone was insufficient to absorb the large supply sold by whales.
Open Interest Volume | Source: Coinglass
Therefore, the buying support indicated by the MFI likely came from spot trading, as retail investors accumulated during the dip, guided by the RSI divergence signal. However, spot buying alone was insufficient to absorb the large supply sold by whales.
Cardano Price Outlook: Whales Will Decide the Next Trend
As of March 2, ADA’s daily price structure remains below late December levels, trading around $0.27. However, RSI continues to form higher lows, indicating the technical divergence still exists. If the price forms a new low, this divergence could be reactivated.
On the upside, $0.31 is a key resistance level. Closing above this level on a daily basis would break the current downtrend, opening the path toward $0.37.
Conversely, dropping below $0.26 would confirm weakening momentum. In that case, $0.23 and $0.21 would become critical support levels. If $0.21 breaks, deeper Fibonacci extensions at $0.18 (61.8%) and $0.15 (78.6%) could become next targets.
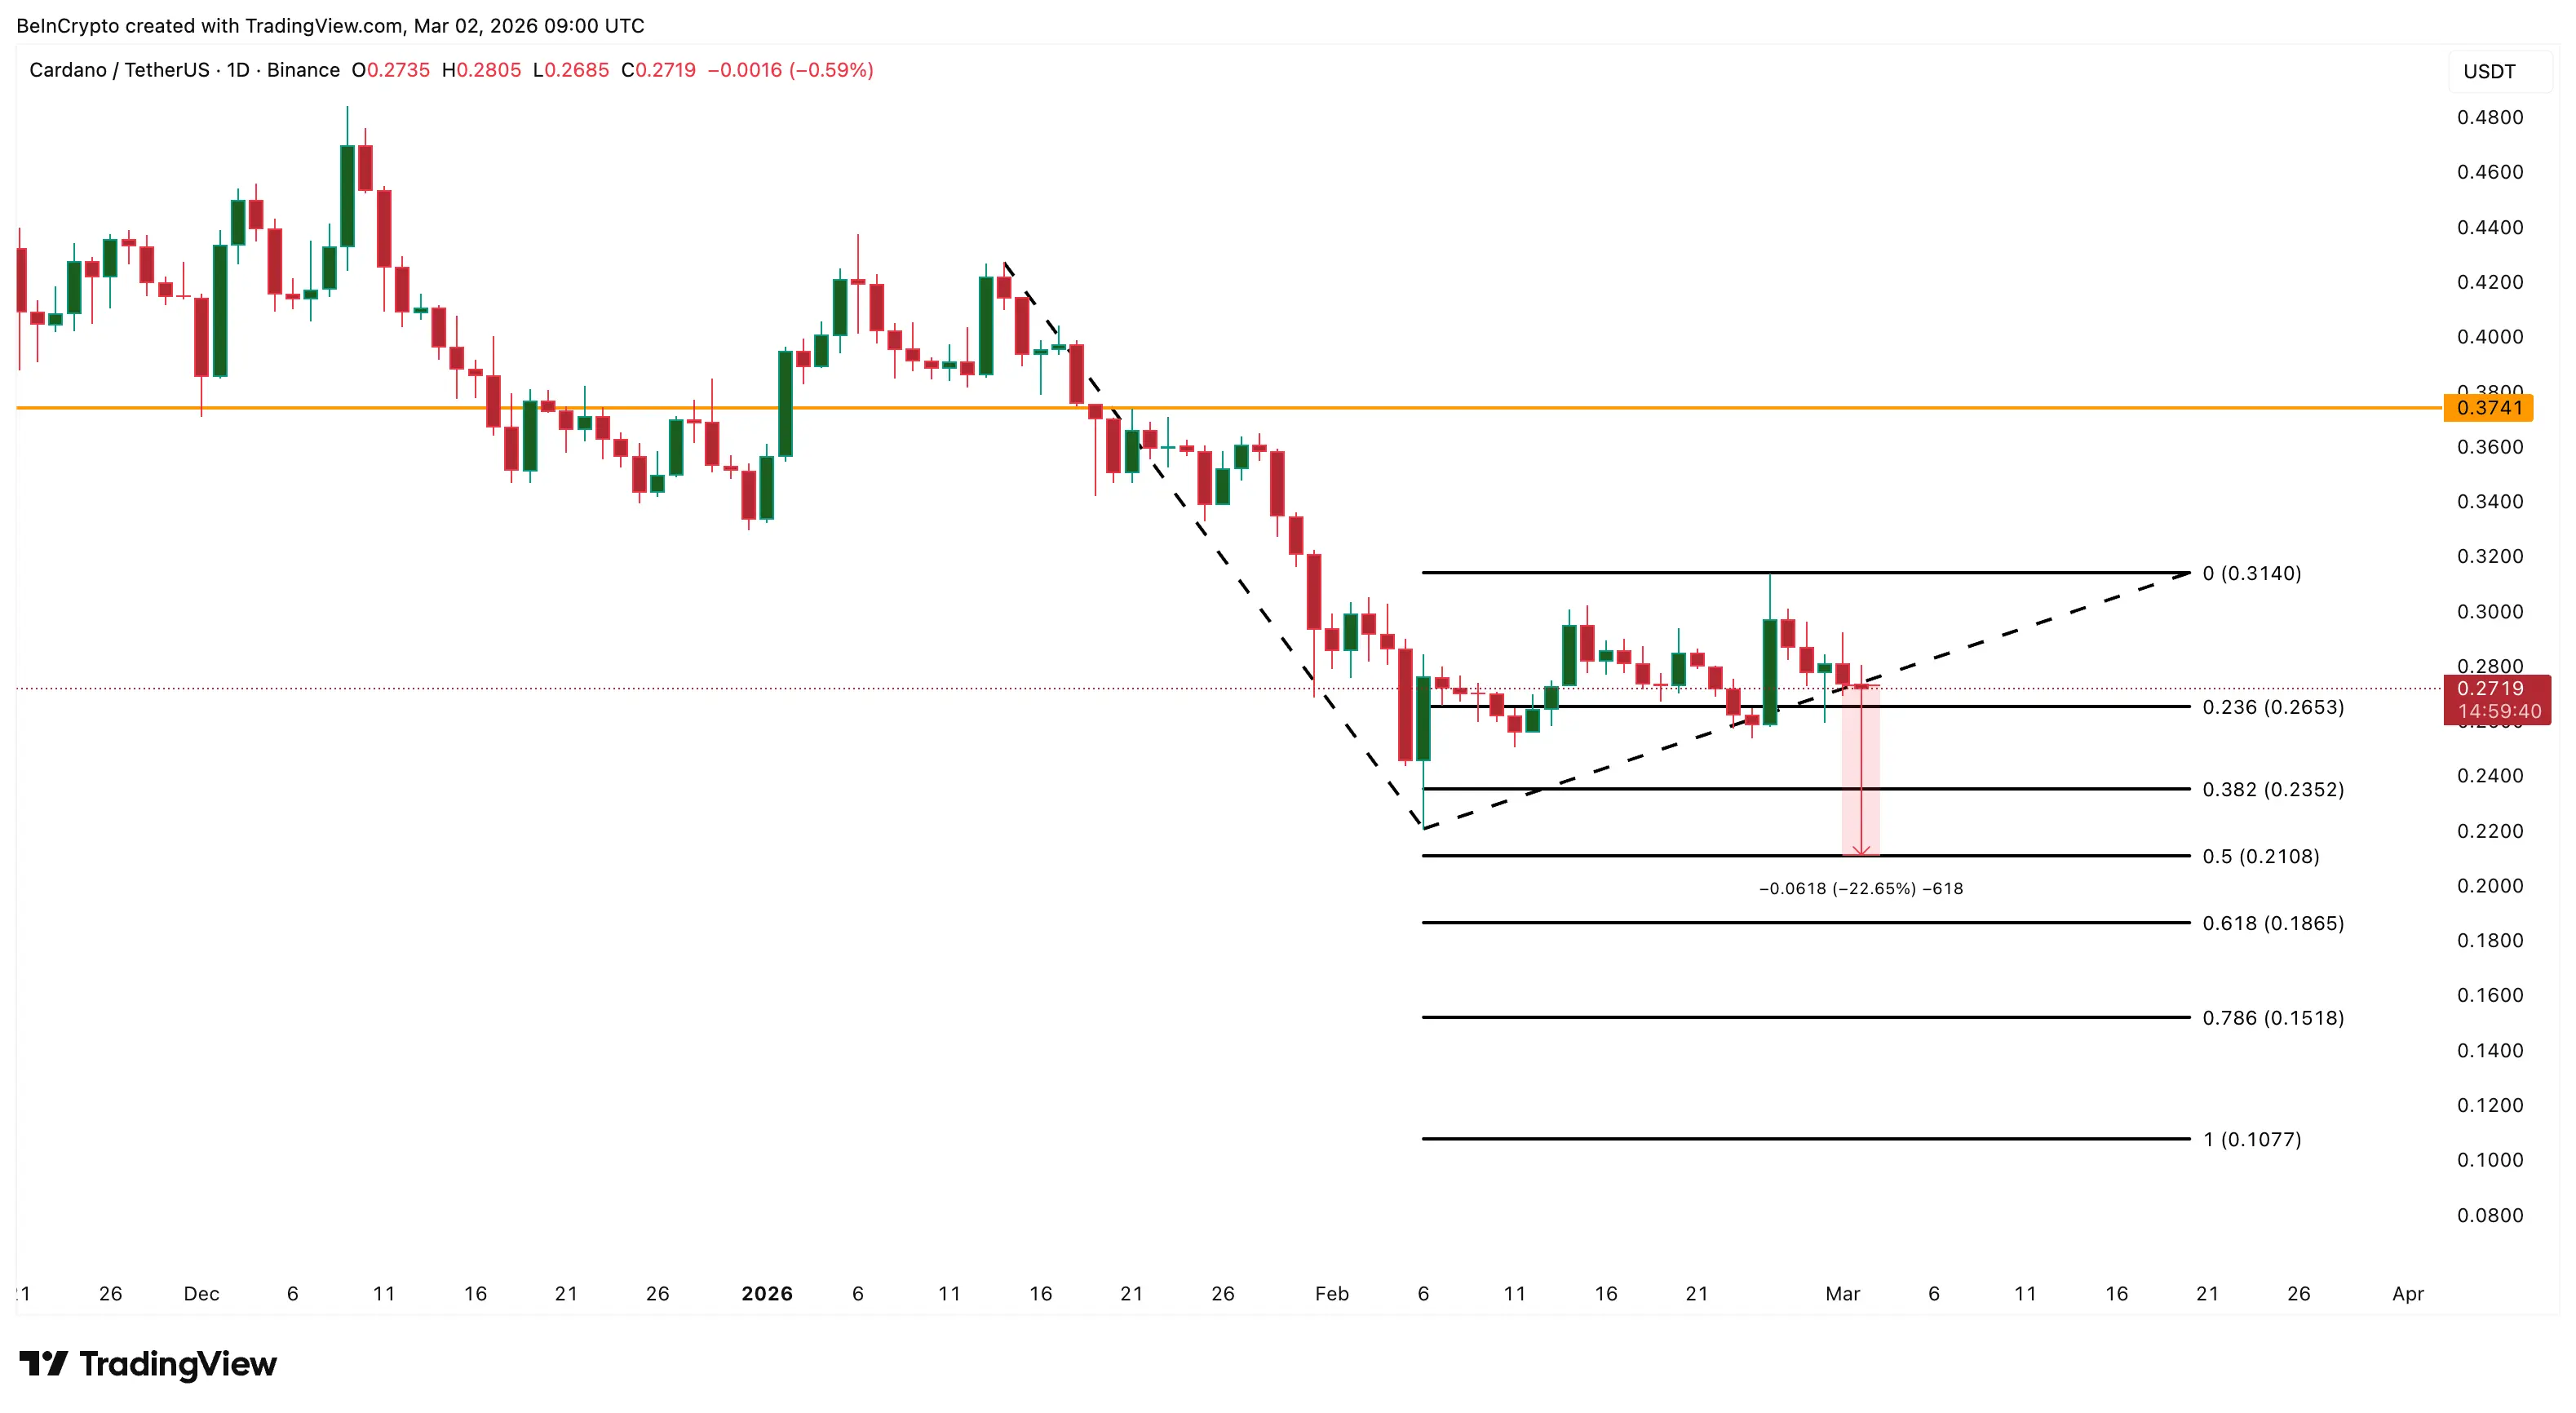 Cardano Price Analysis | Source: TradingView
However, the most crucial factor influencing Cardano’s next move isn’t a specific price level but whether whales will return to buy. Santiment data as of March 2 shows that large holders have yet to start significant accumulation.
Cardano Price Analysis | Source: TradingView
However, the most crucial factor influencing Cardano’s next move isn’t a specific price level but whether whales will return to buy. Santiment data as of March 2 shows that large holders have yet to start significant accumulation.
If ADA drops to $0.21 or lower and whales begin buying, this could create a much stronger technical setup than the February rally. Whale re-entry signals a potential market bottom.
For the divergence signal to succeed, active participation from whales is essential to confirm the trend. Without it, Cardano’s price structure may continue downward in the near future.
Ông Giáo