Ethereum approaches $3,110, up 0.5% in 24 hours. The staking queue surges to 1.759 million ETH ($5.5 billion), hitting a new high in 2023. New validators must wait 30 days, while the exit queue drops to zero. Technicals remain on trend; the 50-day and 100-day moving averages converge around $3,110. After breaking through $3,180, testing $3,300, momentum could accelerate toward $3,420.
$5.5 Billion Staking Surge Locks Liquidity Supply
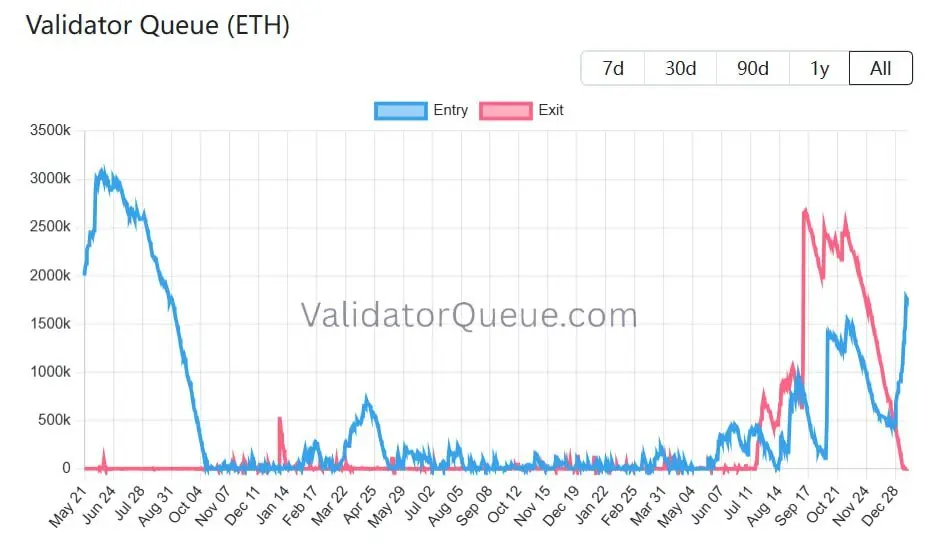
(Source: ValidatorQueue)
According to ValidatorQueue data, the staking application queue on Ethereum’s beacon chain has surged to 1.759 million ETH, approximately $5.5 billion, the highest level since August 2023. New validators now need to wait over 30 days to activate, a rare occurrence in Ethereum’s history, typically only during staking demand spikes.
More importantly, the exit queue has fallen to zero, indicating no large influx of stakers waiting to exit. In short, more ETH is queued for locking, while no one is waiting to exit. This dynamic reduces available liquidity when prices approach resistance levels, creating structural support for price increases.
The surge in the staking queue reflects institutional and large holder confidence in Ethereum’s long-term prospects. Staking is not a short-term speculative activity but a long-term holding strategy. When investors are willing to lock large amounts of ETH and wait 30 days to start earning yields, it shows they believe current prices are undervalued and that future upside is sufficient to cover this time cost.
From a supply-demand perspective, 1.759 million ETH will soon be removed from circulating supply and enter staking. This accounts for about 1.5% of current circulating supply. Such a contraction in supply will directly impact market balance. If demand remains stable or increases, reduced supply will inevitably push prices higher. Historical data shows that Ethereum’s price typically rises significantly within 2 to 4 weeks after the staking queue surges.
Three Major Bullish Signals from Staking Data
Staking Queue Hits New High: 1.759 million ETH queued (55 billion USD), highest since August 2023
Exit Queue Zero: No stakers waiting to exit, indicating long-term holding confidence
Extended Waiting Period: New validators must wait over 30 days, demand far exceeds processing capacity
The surge in the staking queue also has another important implication: the market is shifting from a speculative phase to a value-investment phase. When large funds choose to lock ETH for a stable 2.81% yield instead of chasing short-term volatility in spot markets, it indicates a change in risk appetite among market participants. This shift from “trading for arbitrage” to “staking for income” often signals a price bottom formation.
Technical Compression Structure Foresees Explosion
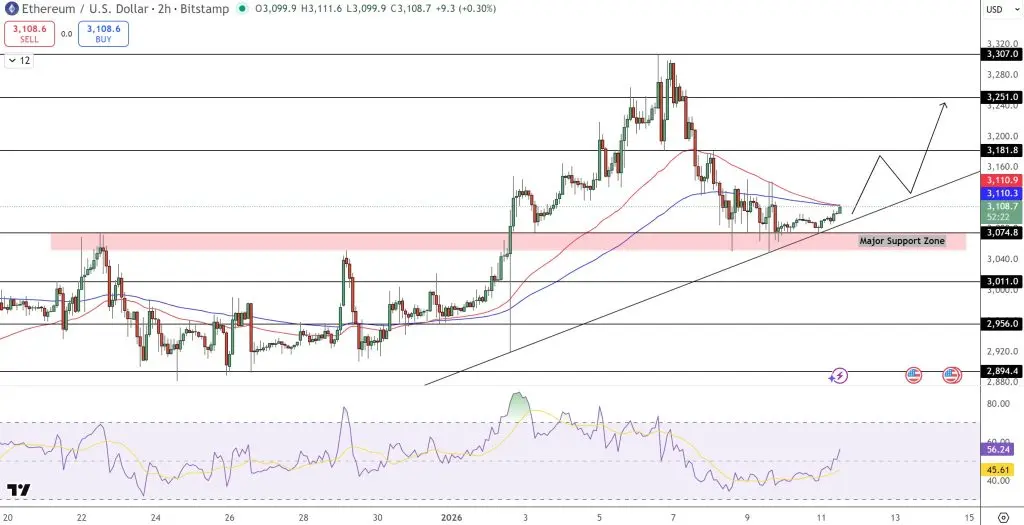
(Source: Trading View)
From a technical perspective, Ethereum’s price is in a consolidation phase. The price is squeezed between an ascending trendline and a descending channel formed by the 50-day and 100-day moving averages, both flattening around $3,110. This convergence typically signals increased volatility and market preparation for a directional breakout.
Since late December, Ethereum has continuously made new lows. Despite multiple attempts to test lower, it remains above the ascending trendline. This pattern usually reflects controlled consolidation rather than trend exhaustion, especially as the price refuses to break key support zones. Recent candlestick charts show repeated long lower shadows around $3,050 to $3,070, indicating buyers are entering early rather than waiting for deeper pullbacks.
Momentum indicators support this view. RSI has rebounded from oversold levels and is stable above 55, suggesting bullish pressure is strengthening but not yet overextended. RSI in the 50–70 range is typical of healthy upward trends; the current 55 reading indicates room for further gains. More importantly, RSI shows no signs of weakening or bearish divergence, increasing the reliability of a breakout.
The 50-day and 100-day moving averages are flattening and converging near $3,110, indicating decreasing volatility. The candlestick patterns also confirm this, with small-bodied candles and long lower shadows, showing buyers absorbing supply rather than retreating. This “low volatility + price compression + moving average convergence” setup is a classic precursor to a breakout in technical analysis.
From a chart pattern perspective, Ethereum appears to be forming a bullish flag. After rising to a previous high, the retracement forms a flag pattern rather than a reversal. The price remains above support zones around $3,050 to $3,070, which are close to the 0.618 Fibonacci retracement level, often associated with trend continuation. As long as the price stays above this support, the overall trend is more likely to continue than reverse.
$3,180 is the Key Breakout Level; $3,300 is the Primary Target
Ethereum’s breakout hinges on overcoming the $3,180 resistance. According to TradingView projections, a decisive break above $3,180 could lead to a move toward $3,250, and if momentum persists, a test of $3,300. As long as ETH remains above the upward trend support, the trend favors continuation.
$3,300 is not an arbitrary target. This level is a critical resistance tested multiple times in late 2025 but not broken through effectively, representing a zone of significant capitulation. A successful breakout and stabilization here would clear many profit-taking pressures and open the way to higher levels. According to pattern measurement rules, the target after a flag breakout is typically the flagpole height added to the breakout point, which also points to around $3,300.
If momentum continues, $3,380 to $3,420 are reasonable next targets. These levels are key support-turned-resistance zones from the first half of 2025 and near the psychological milestone of $3,400. Breaking above $3,300 would significantly improve market sentiment, and FOMO could drive prices rapidly toward this zone.
From a trading standpoint, this structure favors patience over prediction. The strength of breaking resistance is more important than pre-guessing. Markets often change when attention is lowest. As staking demand increases and prices tighten, Ethereum no longer appears as a sluggish market but as one preparing for the next growth phase, which is often the most critical environment for early positioning.
Disclaimer: The information on this page may come from third parties and does not represent the views or opinions of Gate. The content displayed on this page is for reference only and does not constitute any financial, investment, or legal advice. Gate does not guarantee the accuracy or completeness of the information and shall not be liable for any losses arising from the use of this information. Virtual asset investments carry high risks and are subject to significant price volatility. You may lose all of your invested principal. Please fully understand the relevant risks and make prudent decisions based on your own financial situation and risk tolerance. For details, please refer to
Disclaimer.
