Middle East Geopolitical Shock: Analyzing Hedging Capital Flows and BTC Pricing Logic Through Options Data
On March 1, 2026, the global macro markets experienced an epic “black swan” event: a direct military strike by the United States and Israel against Iran resulted in the death of Iran’s Supreme Leader, Khamenei.
This extreme tail risk event instantly reshaped the risk premium models for major global asset classes. The complete ignition of the Middle East powder keg not only caused violent fluctuations in traditional crude oil and safe-haven assets but also pushed the cryptocurrency market, at a critical juncture, into a crossroads of liquidity and pricing power.
By analyzing Binance spot data and Deribit options data from a quantitative and derivatives perspective, we deeply examine the immediate impact of this geopolitical crisis on the crypto market and provide forward-looking projections of future volatility paths and market trends.
The essence of geopolitical conflict is a reshaping of the global supply chain, energy prices, and the resulting inflation expectations. The US-Israel attack on Iran triggered a textbook risk aversion pattern in financial markets: commodities like oil and gold became the preferred safe havens, while high-risk assets faced indiscriminate selling in the first instance.
The outbreak of intense conflict in the Middle East immediately impacts global energy supply chains and fiat currency confidence. In traditional financial markets, Brent crude oil is likely to gap higher due to supply disruptions, and traditional safe assets like gold will see institutional accumulation. However, in the crypto space, Bitcoin’s narrative as “digital gold” and its “high elasticity risk asset” nature are experiencing a fierce internal conflict.
From a macro liquidity perspective, panic caused by geopolitical tensions (VIX soaring) typically triggers indiscriminate cross-asset sell-offs to secure dollar liquidity. But after a brief liquidity squeeze, Bitcoin—an asset not controlled by any sovereign, with censorship resistance and portability—often absorbs some of the capital fleeing from high-risk emerging market fiat currencies.
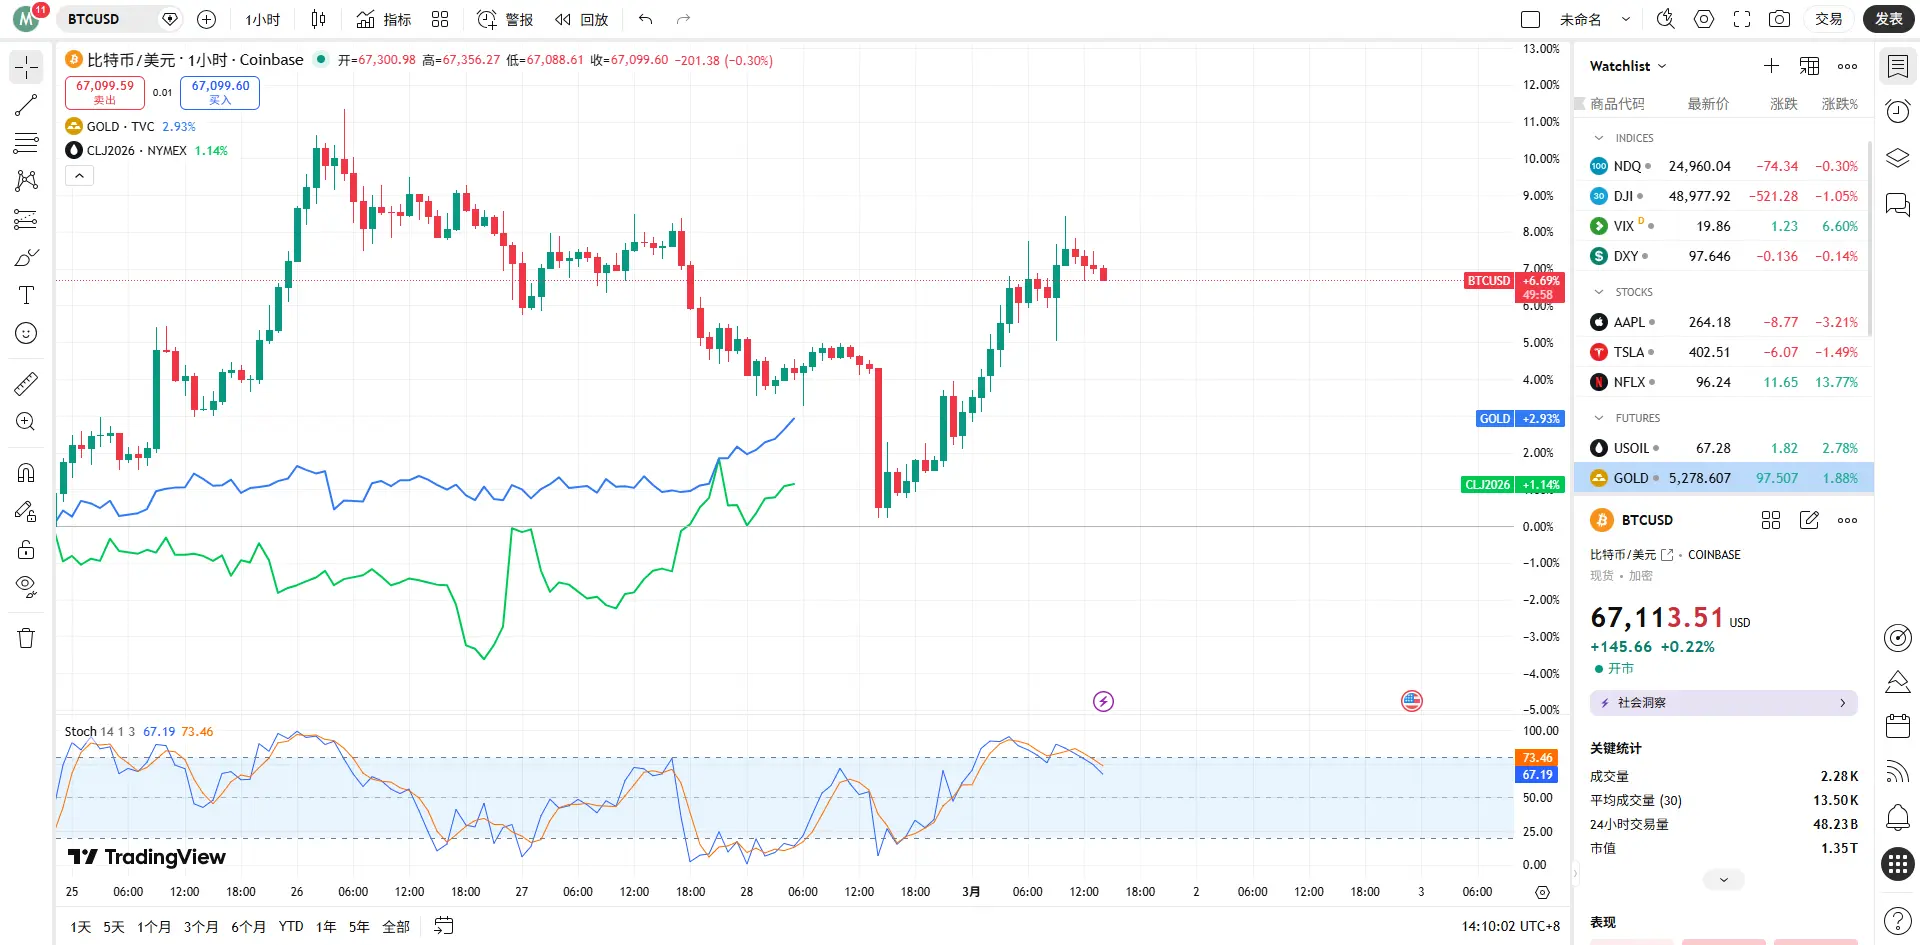
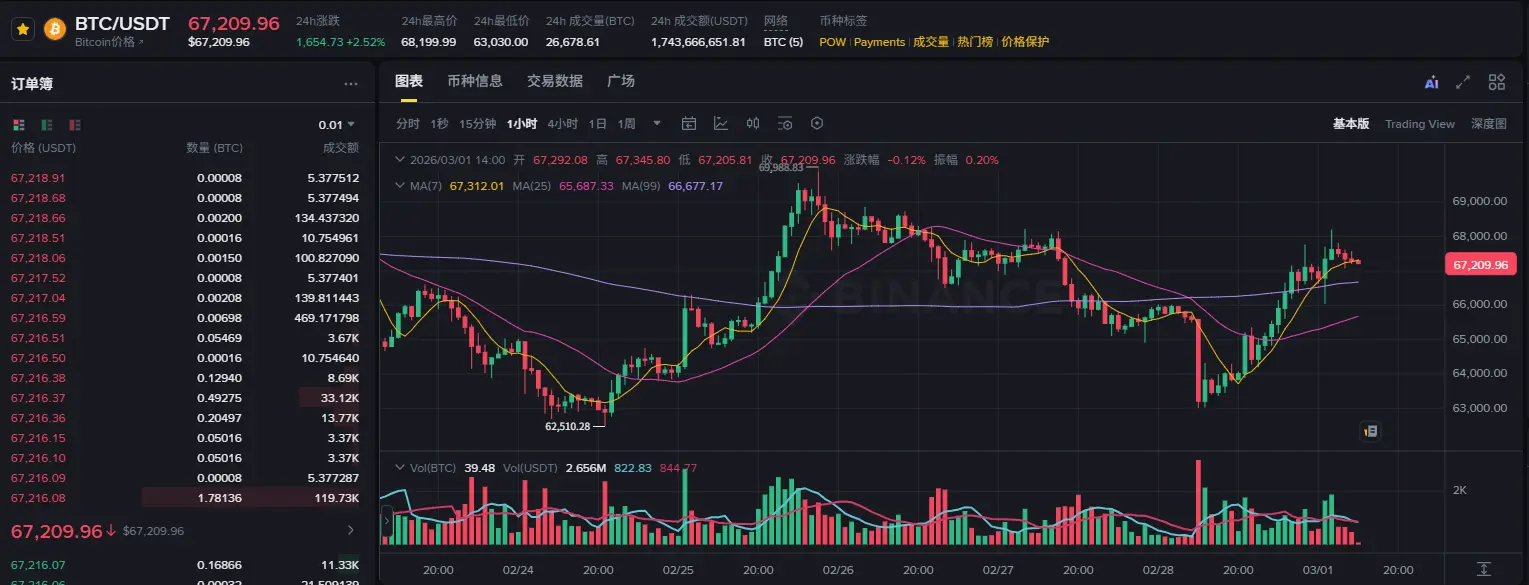
Combining Binance spot and futures data (as of 14:00 on March 1, 2026), BTC/USDT is fluctuating around $67,392. During this major crisis, Bitcoin has not experienced a collapse like the March 12, 2020 event, but has instead held firm at the critical support level of $67,000.
In the past 24 hours, trading volume reached $1.74 billion, indicating significant disagreement and turnover between bulls and bears at this level. The moving averages in the price chart show a bullish alignment followed by high-level consolidation, suggesting that despite the shock from breaking news, the spot market’s support has remained resilient, and institutional long-term holdings have not fundamentally shaken.
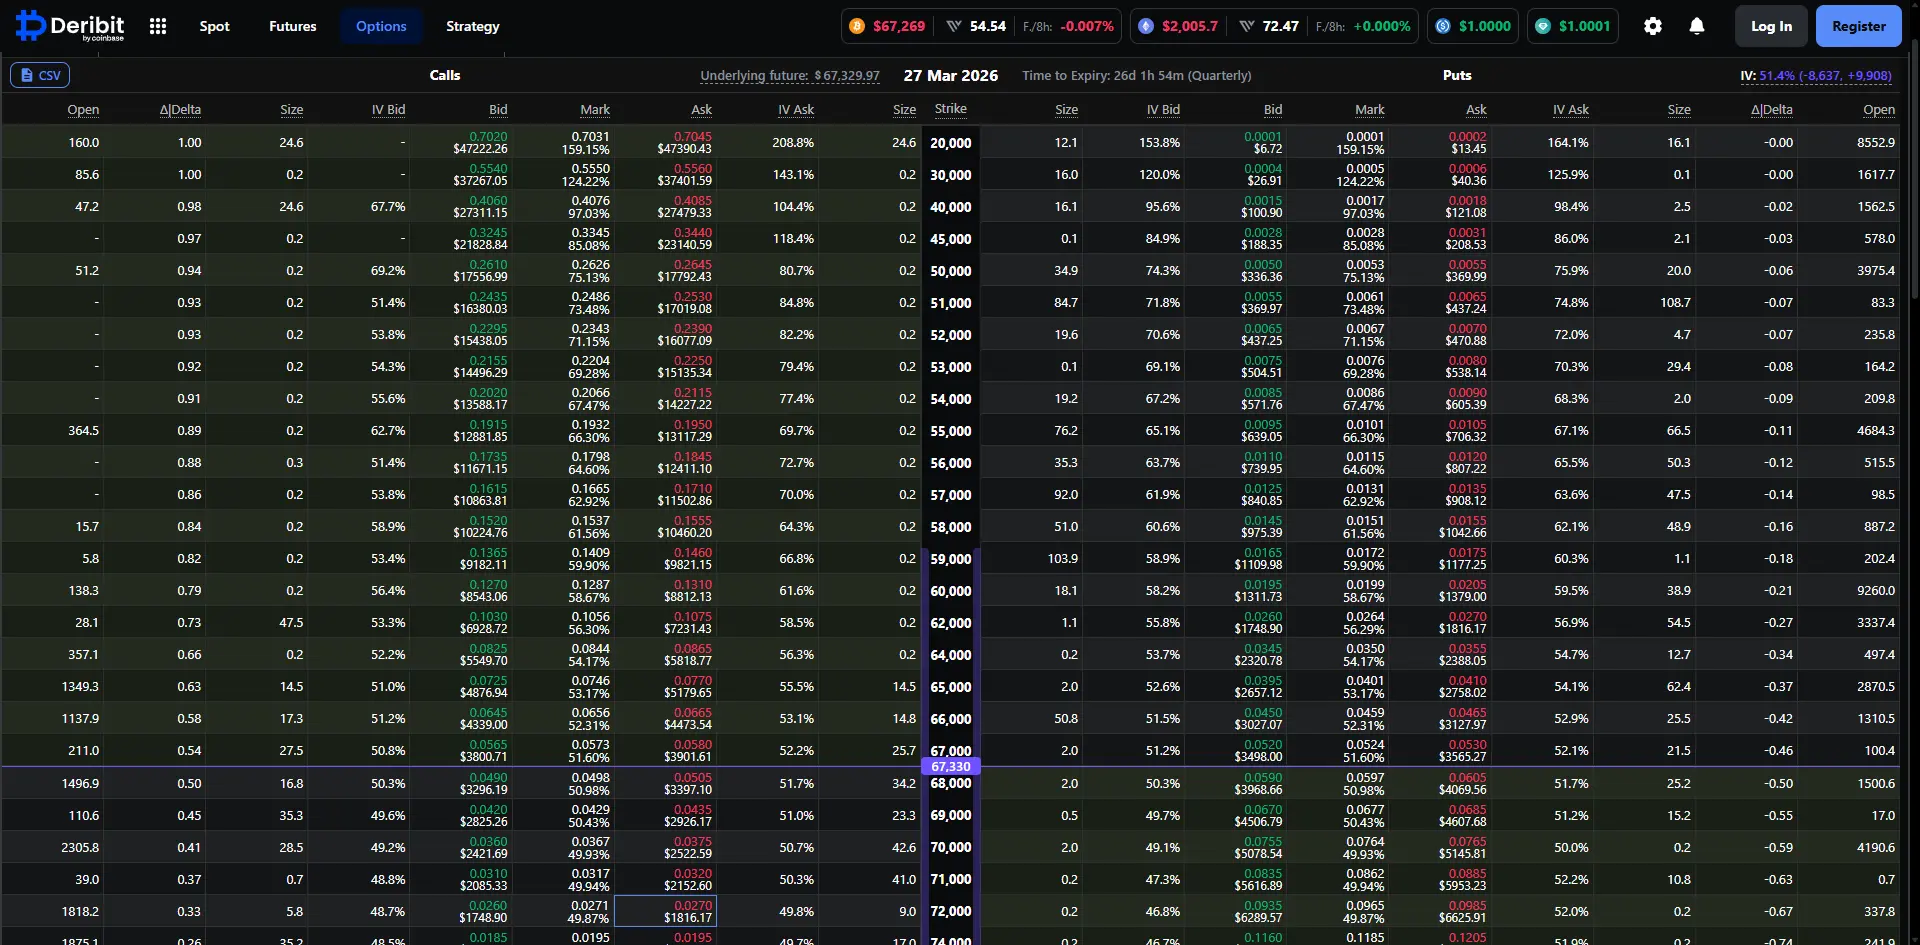
To understand the true intentions of smart money, derivatives markets, especially options data, provide the most direct quantitative insight. Analyzing the upcoming March 27, 2026, BTC options expiring on Deribit, we can clearly outline the strategic outlook of major institutions over the next month.
Currently, the implied volatility (IV) of BTC options expiring on March 27 has reached a relatively high 51.3%. In the context of the geopolitical crisis, option sellers have rapidly increased the volatility surface to hedge against potential extreme moves and gamma risk. An IV above 51% indicates the market is hedging against wide-ranging volatility over the next two to three weeks. For quantitative traders, shorting volatility at this point offers a poor risk-reward profile, and the market is collectively engaged in “buying straddles” or constructing tail-risk hedges.
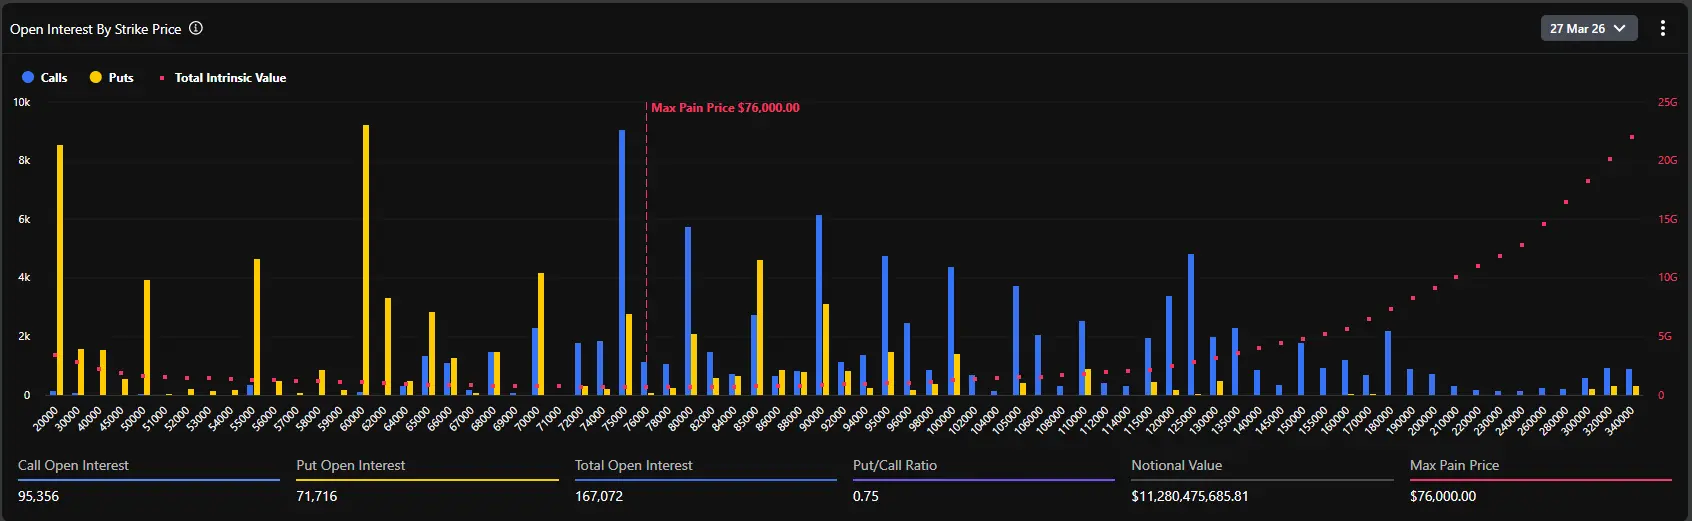
The distribution of open interest (OI) in options shows that the market’s maximum pain point is at $76,000—a highly forward-looking and controversial figure.
Typically, as expiration approaches, the underlying asset price tends to gravitate toward the maximum pain point to minimize the overall value of options held by buyers. Currently, the spot price (~$67,400) is more than 12% below this maximum pain point. This significant deviation reveals two core logics:
First, before the crisis erupted, the market was extremely optimistic, with large funds betting on a breakout to new highs by the end of March (in the $75,000–$80,000 range), which directly pushed the maximum pain level higher.
Second, the external shock of the geopolitical crisis suppressed the upward momentum of the spot price. However, with a total open interest of approximately 167,072 BTC (over $11.2 billion in nominal value), longs have not experienced a mass liquidation due to the war news.
Data shows the current put/call ratio (based on open interest) is 0.75. Since this is below 1, it indicates that, overall, call options still dominate the open interest. Notably, at strike prices of $75,000, $80,000, and even $100,000, there are massive accumulations of call options (up to nearly 10,000 BTC at a single strike).
However, the 24-hour volume-based put/call volume ratio (PCR) has reached 1.37. The divergence between the low open interest ratio (0.75) and the high volume ratio (1.37) vividly illustrates current market psychology: long-term institutions maintain their bullish exposure (not selling spot or closing long calls), while in the short term, a large influx of capital is buying out-of-the-money puts as tactical hedges, causing a surge in short-term put trading volume.
Analyzing detailed options data from Deribit, we observe that in the $67,000–$70,000 range, delta distributions are extremely dense. The current spot price of $67,495 is situated in the “meat grinder” zone of bullish and bearish battles.
If geopolitical tensions worsen further, leading to significant macro fund withdrawals and a drop below $65,000 (a strong support level), market makers will be forced to sell in spot or futures markets to hedge their short puts, potentially triggering a liquidity feedback loop and testing the psychological $60,000 level.
Conversely, if the Middle East conflict enters a stalemate after brief violence, and panic sentiment peaks and then recedes, the crypto rebound could be fierce. Given the large volume of call options between $70,000 and $76,000, once spot prices stabilize and break above $70,000 resistance, market makers will be compelled to buy spot to hedge their negative gamma exposure. This classic “Gamma Squeeze” effect could rapidly push BTC prices toward the maximum pain point of around $76,000.
The aftershocks of Middle East geopolitical turbulence will continue to ferment. The subsequent actions of the US and Iran will determine the final direction of safe-haven capital flows. In the short term, BTC spot is expected to fluctuate violently within a broad range of $62,000–$70,000. Futures leverage will be repeatedly liquidated during this process. Quantitative strategies should focus on “deleveraging and capturing volatility,” suitable for calendar spreads or grid market-making at key support and resistance levels, avoiding directional exposure.
From the perspective of options positioning, the massive expiry on March 27 is an unavoidable market magnet. Unless a global, uncontrollable third world war-level liquidity crisis erupts, the diminishing panic will reprice Bitcoin’s “safe-haven” and “inflation-hedge” attributes. In mid to late March, a corrective rebound is highly likely, with spot prices strongly motivated to approach the $75,000–$76,000 zone (the maximum pain point and dense call strike area).
This event marks a new, higher-risk phase of geopolitical conflict. Whether it’s the resurgence of inflation expectations driven by war (oil soaring) or a trust crisis in fiat currencies caused by sanctions on specific countries, these underlying factors reinforce Bitcoin’s strategic value as a “borderless, non-sovereign hard asset.” For family offices, macro hedge funds, and large institutions, the traditional 60/40 portfolio of dollar bonds and US stocks can no longer cope with tail risks. Bitcoin’s allocation as a “non-correlated asset” is expected to see a systemic increase after this crisis.
The US and Israel’s strike on Iran is the first thunderclap in 2026 reshaping the global financial landscape. Beneath the panic, data from the crypto options market quietly reveals that institutional funds are “short-term defensive hedging, long-term still bullish.”
For professional finance practitioners, stripping away emotional noise and closely monitoring implied volatility trends and gamma exposure shifts among market makers are the keys to penetrating the fog of war and seizing the next asset pricing cycle. As the maximum pain point at $76,000 looms like a lighthouse, every deep correction driven by panic is accumulating energy for future breakthroughs.
Related Articles
3 Green Days Power Strong Crypto ETF Week as Bitcoin ETFs Add $787 Million
Bitcoin ETFs See Daily Outflow of $35.9M While Solana ETFs Continue Weekly Growth
Bitcoin Treasury Firm ProCap Adds $31 Million in BTC as Stock Buybacks Grow