Is the Cardano Crash Over? ADA Chart Signals Optimism

CaptainAltcoin
ADA-1,69%
TAO0,77%

The Cardano price has been grinding lower for months now. Since late 2025, each bounce has topped out beneath the last one, and sellers have consistently stepped in before any real recovery could take shape. But there is now a growing argument that the worst may already be behind it.

Analyst Mr Brownstone pointed out on X that there is a legitimate chance the February 2026 low marked the end of a larger corrective phase.

His view is based on Elliott Wave structure, specifically the idea that a PRIMARY WAVE (2) may have completed at that low. It’s an optimistic take, but one that still requires confirmation.

What the Cardano Chart Is Showing

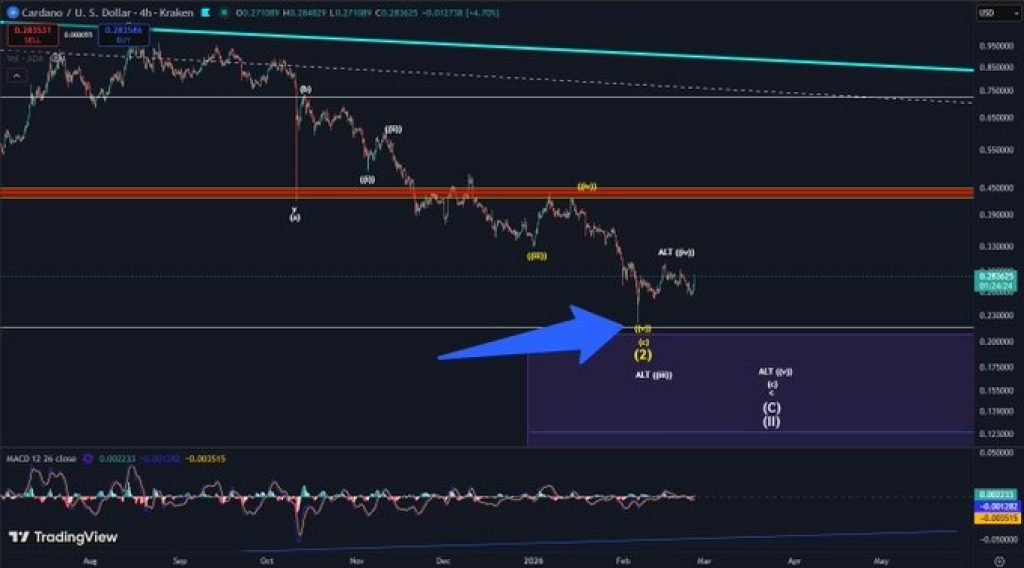
On the 4H chart, the ADA price dropped sharply into the February low around the $0.22 area. That level clearly stands out as a major pivot, as price reacted quickly and bounced from it. Since then, the fall has slowed down, and ADA has begun to establish a range rather than continuing to plummet lower.

The alternative wave count, shown in yellow, indicates that the overall correction may have ended at that stage. If that interpretation is correct, ADA would now be transitioning from a prolonged correction into the early stages of a new upward phase.

However, the analysis also makes it clear that confirmation is not immediate.In order for the overall bullish pattern to be confirmed, the Cardano price must reclaim $0.74. Until then, this is a developing pattern and not yet a reversal.

Source: X/MrBrownStone

Cardano Price Key Level Bulls Must Defend

The most important level on the chart right now sits near $0.222. That February low is the line separating optimism from another wave down.

However, if the ADA price declines from the current levels and creates a higher low above the $0.222 level, it would further reinforce the argument for the bottom already being in.

If ADA pulls back and forms a higher low, it would show that sellers are losing control and that buyers are stepping in sooner than they did during the previous drops.

_****TAO vs. Other AI Cryptos: Why Bittensor Is Different (And Why It Could Be the Bitcoin of AI)**

But if price slips under $0.222, that idea falls apart. At that point, the market would be signaling that the correction still has unfinished business. In that case, the market may need one more deeper flush before the correction truly ends.

According to the analysis, even that scenario could represent the final phase of the pullback, but it would delay any strong recovery narrative.

The Cardano price is no longer falling in a straight line. The panic phase has eased, and the chart looks more like it’s catching its breath than breaking down. Sellers aren’t pressing with the same force, and price is hovering instead of sliding.

The real test comes on the next dip. If buyers step in before $0.222 gives way, this stretch could end up being the floor. If that level cracks, the market likely isn’t done cleaning itself out.

Disclaimer: The information on this page may come from third parties and does not represent the views or opinions of Gate. The content displayed on this page is for reference only and does not constitute any financial, investment, or legal advice. Gate does not guarantee the accuracy or completeness of the information and shall not be liable for any losses arising from the use of this information. Virtual asset investments carry high risks and are subject to significant price volatility. You may lose all of your invested principal. Please fully understand the relevant risks and make prudent decisions based on your own financial situation and risk tolerance. For details, please refer to Disclaimer.

Related Articles

Bitunix Analyst: Hormuz Risk Escalation, Oil-Gold Chain Activation, BTC Upside Short Liquidity Accumulation

Dubai Gold Air Transport Hub flights suspended, Iran closes the Strait of Hormuz, leading to a sharp rise in oil prices and increased inflation expectations. Institutions favor gold, but rising oil prices may suppress gold prices. In the crypto market, BTC fluctuates between 69,500 and 70,500, with market focus on short squeeze and liquidity changes. Overall, macro volatility has increased, and BTC remains within the range, trading sideways.

GateNews1h ago

XRP Today's News: $650 million rush into exchanges, are investors preparing to sell?

In the past week, approximately 472 million XRP tokens flowed into exchanges, breaking the net outflow trend seen for several months and reflecting a defensive stance among holders amid geopolitical uncertainties. Although large inflows are generally seen as a warning sign of selling, they could also be a hedge. On the technical side, $1.30 is a key support level; if broken, the price could accelerate downward to $1.12. The resistance levels above are $1.50 and $1.61.

MarketWhisper1h ago

"1011 Insider Whale" claims the crypto market is still in a range-bound fluctuation

ChainCatcher Message: "1011 Insider Whale" GarrettJin posted on X platform stating that the current market transmission path is influenced by geopolitical impacts on the macro environment, which in turn further affects the crypto market. He pointed out that attention should be focused on indicators such as oil prices, the US dollar index, and the yields of 2-year and 10-year US Treasury bonds. GarrettJin believes that the crypto market is still in a range-bound consolidation phase and states that maintaining caution is a common choice in the current environment.

GateNews1h ago

Bloomberg: The US-Iran conflict has limited impact on Bitcoin, currently consolidating between $60,000 and $70,000.

Bitcoin briefly declined in the US following news of strikes against Iran, but then rebounded, with trading prices surpassing pre-attack levels, indicating the market's low sensitivity to risk. After a significant correction, Bitcoin consolidated in the $60,000 to $70,000 range, retail participation decreased, and overall inflows weakened, resulting in a smaller impact from the new shock.

GateNews2h ago

Pi Network Foundation sells 48.88 million tokens, PI technical outlook is bearish

Pi Network recently experienced a surge in market supply after the foundation sold 48.88 million tokens, causing the price to fluctuate around $0.1700. Technical analysis shows that PI failed to break above the 50-day EMA at $0.1740, indicating a generally bearish outlook. If the $0.1700 support level is broken, further declines may occur. The community has criticized the transparency of token transfers, which has impacted market confidence.

MarketWhisper2h ago

Bitcoin briefly surged past $70,000 before falling back! Iran's capital outflow surged by 700%, VanEck calls it "building a bottom"

Bitcoin plunged and then rebounded after the US and Israel airstrikes on Iran, reaching a high of $70,110, currently around $68,500. Capital outflows from Iran's largest crypto exchange Nobitex surged by 700%, indicating that cryptocurrencies are becoming a channel for capital flight. VanEck's CEO believes the market is in a bottoming phase and remains optimistic about the future. Meanwhile, JPMorgan's Dimon warns of inflation risks, showing that geopolitical uncertainties continue to impact the market.

動區BlockTempo2h ago
Comment
0/400
No comments
Trade Crypto Anywhere Anytime
qrCode
Scan to download Gate App
Community
  • 简体中文
  • English
  • Tiếng Việt
  • 繁體中文
  • Español
  • Русский
  • Français (Afrique)
  • Português (Portugal)
  • Bahasa Indonesia
  • 日本語
  • بالعربية
  • Українська
  • Português (Brasil)