CoinDesk senior analyst James Van Straten points out that Bitcoin has experienced the longest miner capitulation in history. As the Hash Ribbon approaches a golden cross, multiple indicators suggest the market has entered a deep value zone, and the darkest decline may be over.
(Background: Michael Saylor: Bitcoin’s 45% retracement is like Apple’s “Valley of Despair”)
(Additional context: Female investor Cathie Wood: Bitcoin is “undoubtedly” superior to gold and has more structural advantages in the modern financial system)
After a three-month period of volatility and decline, Bitcoin (BTC) is showing key reversal signals. According to data from on-chain analytics firm Glassnode, cited by CoinDesk senior analyst James Van Straten, the Hash Ribbon indicator is recovering, indicating that the longest miner capitulation phase since November last year may be ending. Historical data shows that such signals often precede market bottoms.
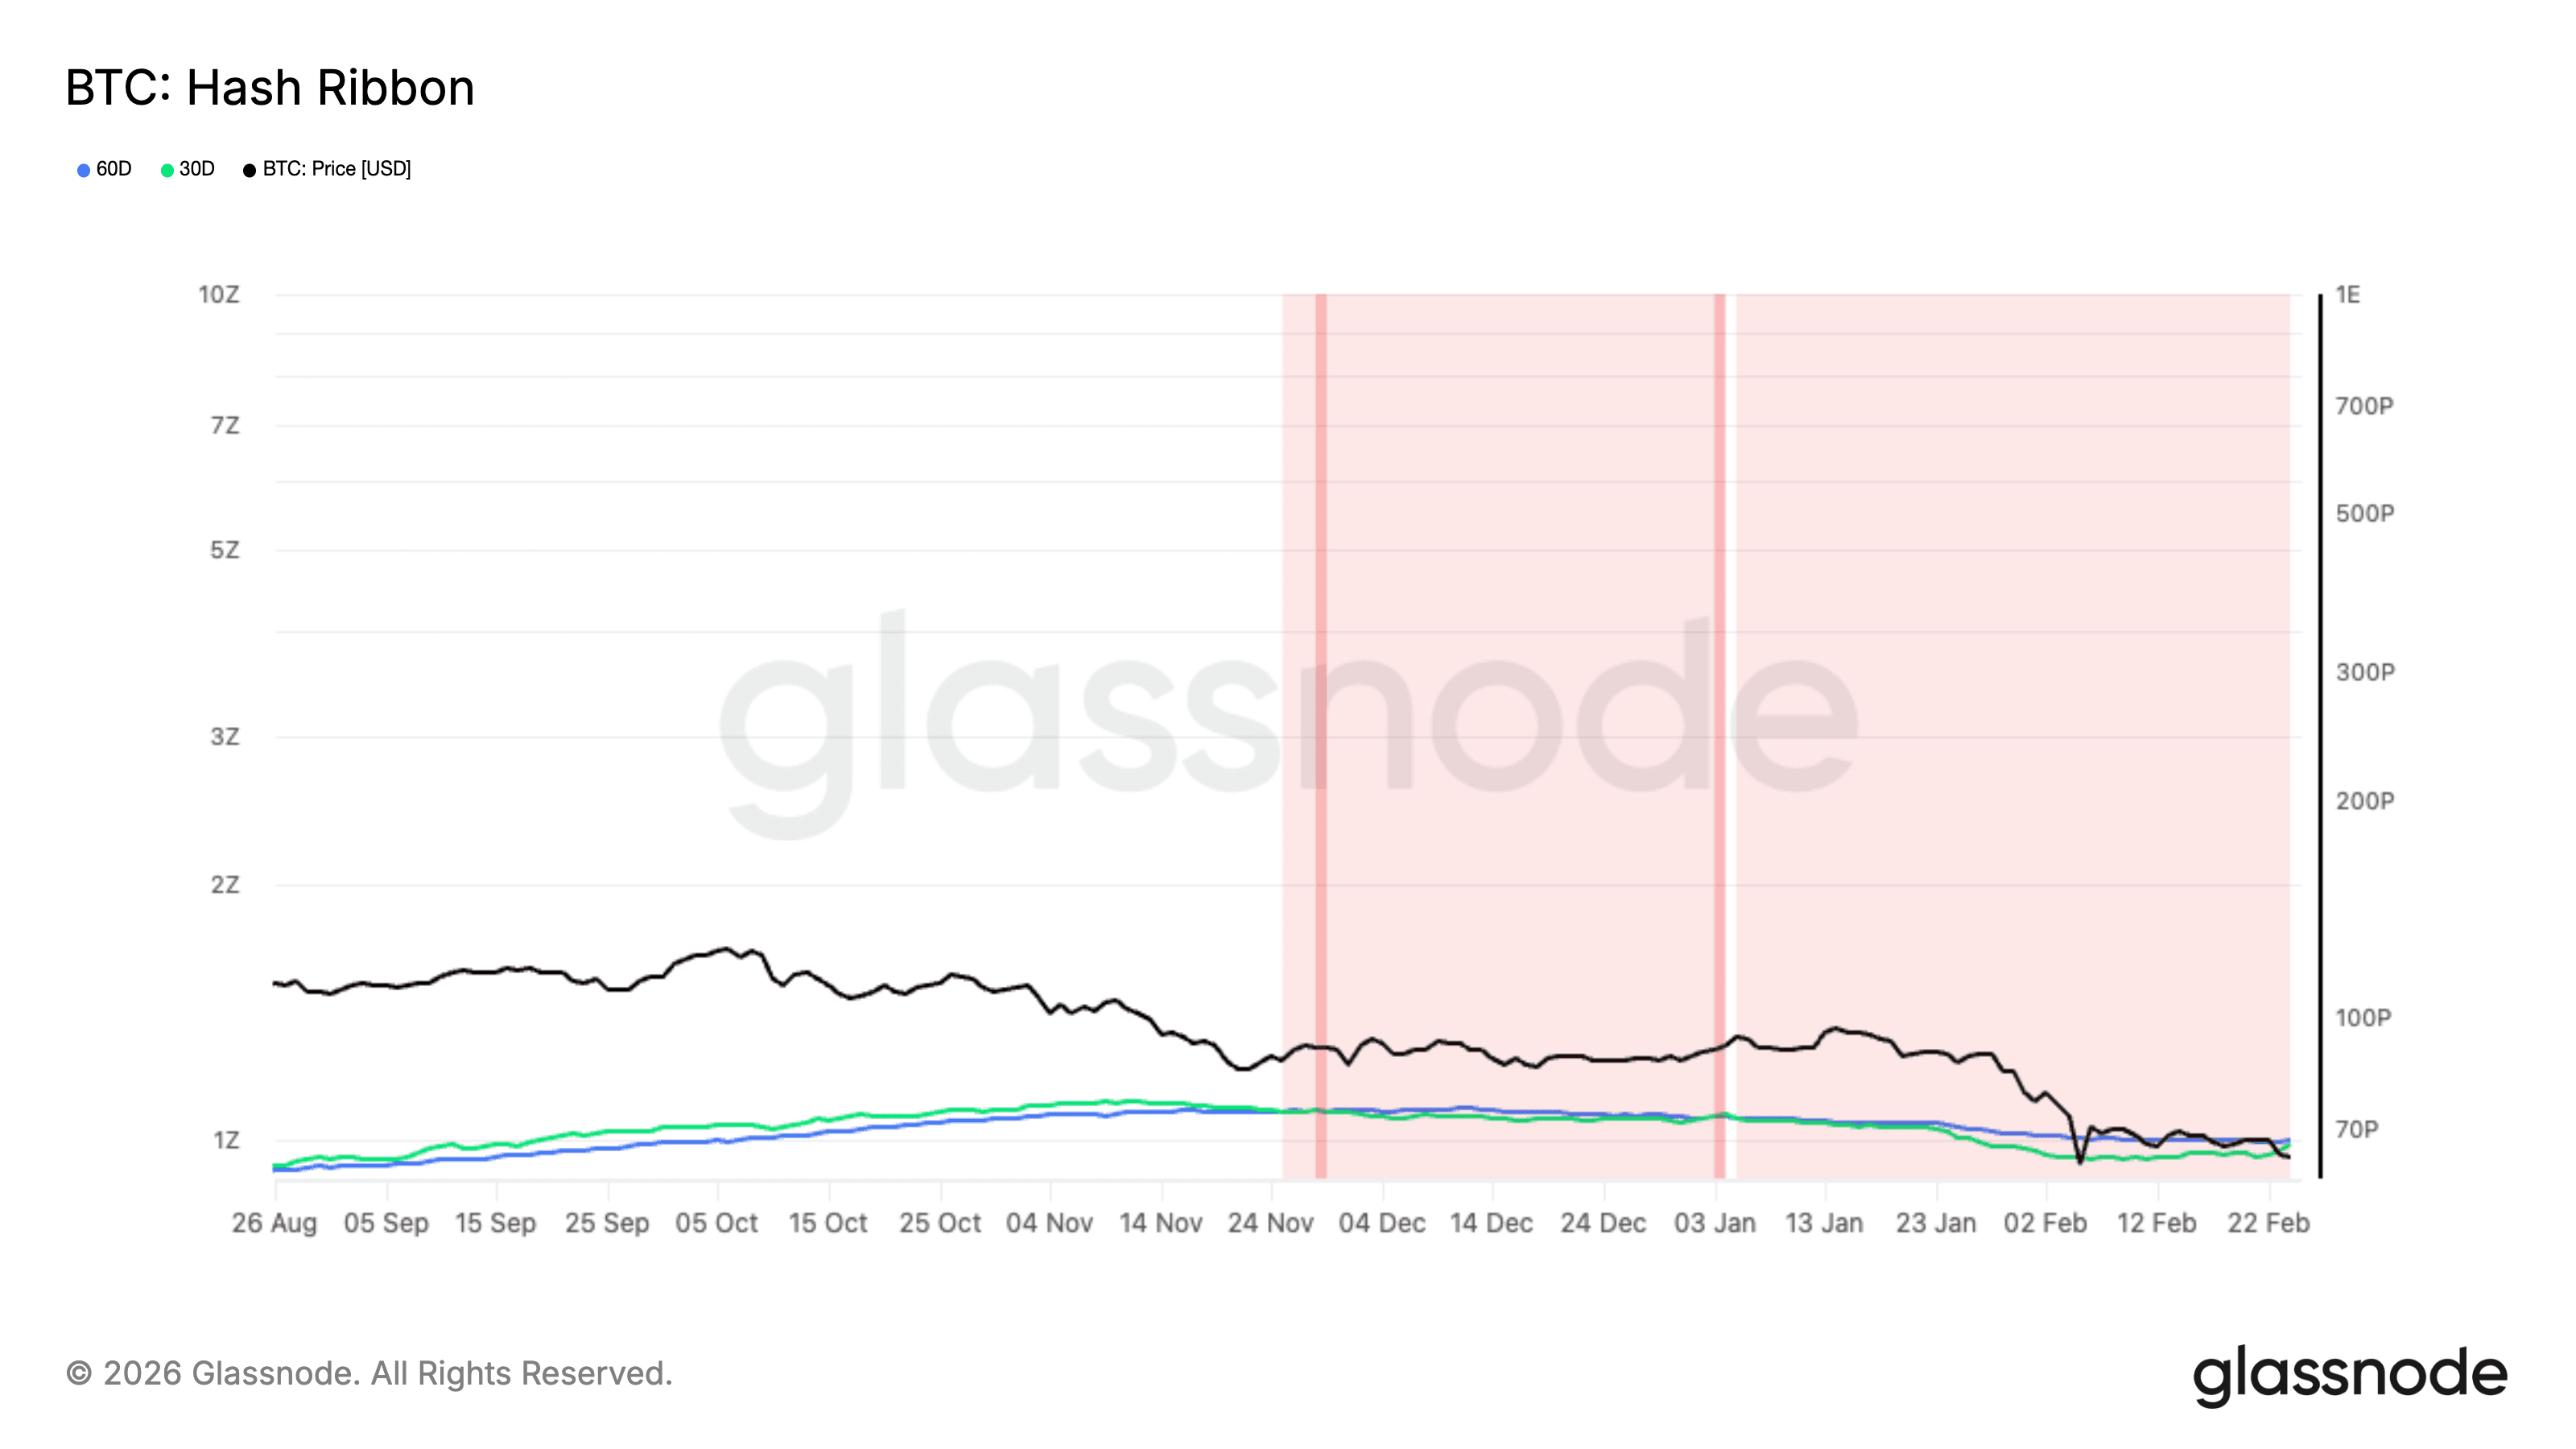
Image source: James Van Straten
What is “Miner Capitulation” and Why Is It Related to Price Bottoms?
In the cryptocurrency market, “miner capitulation” occurs when mining revenues are insufficient to cover electricity and operational costs, forcing inefficient miners to shut down equipment and sell their Bitcoin holdings to stay afloat. This collective selling pressure often causes the network’s hash rate to temporarily decline.
The Hash Ribbon indicator tracks the 30-day and 60-day moving averages (MA) of hash rate to assess market stress. When the 30-day MA crosses above the 60-day MA, it signals miners are coming back online, easing network pressure. Over the past decade, such crossovers have accurately marked important market lows, including those at the end of 2018 and 2022.
Data Analysis: Price Has Fallen Below “Average Production Cost”
In addition to the hash rate indicator, another piece of evidence supporting a bottom is Bitcoin’s production cost. Van Straten cites data from checkonchain, indicating that Bitcoin’s current trading price (around $65,000–$66,000) is below the estimated average production cost of $66,000.
When Bitcoin’s price drops below production costs, the market is generally considered to be in a “deep value zone.” This phenomenon is rare; the last time it occurred was in November 2022, when Bitcoin hit a cycle low of $15,500. Currently, the price falling below the cost line will further shake out the last weak holders, completing the capitulation process.

Disclaimer: The information on this page may come from third parties and does not represent the views or opinions of Gate. The content displayed on this page is for reference only and does not constitute any financial, investment, or legal advice. Gate does not guarantee the accuracy or completeness of the information and shall not be liable for any losses arising from the use of this information. Virtual asset investments carry high risks and are subject to significant price volatility. You may lose all of your invested principal. Please fully understand the relevant risks and make prudent decisions based on your own financial situation and risk tolerance. For details, please refer to
Disclaimer.
Related Articles
The Hormuz Strait crisis remains unresolved, and Bitcoin has fallen below 68K.
Affected by the US-Iran conflict, global markets have been severely impacted, with the S&P 500 Index declining for four consecutive weeks. Gold has experienced a modest rebound around $4,500, while oil prices remain stable at elevated levels. Trump has issued an ultimatum to Iran, with potential escalation of conflict between the two sides. Bitcoin and Ethereum have also declined in tandem, and market sentiment has turned conservative.
ChainNewsAbmedia1m ago
River (RIVER) Price Keeps Pumping as TD Indicator Signals Another Rally
Analyst Ali Martinez highlights the accuracy of the TD Sequential indicator in predicting River (RIVER) price movements. The indicator has consistently identified significant buy and sell signals throughout RIVER's volatility, suggesting potential future trends based on current signals.
CaptainAltcoin1h ago
ETH 15-minute decline of 0.88%: Capital outflow dominates market, intensifying short-term selling pressure
On March 22, 2026, from 21:00 to 21:15 (UTC), Ethereum (ETH) recorded a -0.88% return rate within 15 minutes, with the price fluctuating in the range of 2029.54 to 2060.75 USDT, reaching an amplitude of 1.52%. Market attention has increased, short-term volatility has significantly intensified, reflecting rapid conversion of funding pressure into price pressure.
The main driver of this anomaly is accelerated capital outflows from trading platforms: approximately 420,690 USD equivalent of ETH flowed in within 10 minutes, but the number of withdrawals reached 2,319 transactions in the past 1 hour, far exceeding deposits during the same period by 5
GateNews2h ago
BTC Drops 0.58% in 15 Minutes: Tight Liquidity and Institutional Hedging Create Downward Pressure
2026-03-22 21:00 to 21:15 (UTC), BTC recorded a -0.58% return within just 15 minutes, with prices fluctuating in the range of 67562.1 to 68223.5 USDT, with an amplitude of 0.97%. During this period, market sentiment was highly tense, overall attention increased, and short-term volatility accelerated noticeably.
The main driving force behind this anomaly was the resonance formed by spot market liquidity shortage and medium-sized funds accelerating their exit. On-chain data shows a significant net outflow of -371.99 BTC in the $100k-$1M transaction range, driving selling
GateNews2h ago
Risk-Off Drips throughout Markets
Geopolitical tensions and rising uncertainty have led to a risk-off sentiment in global markets, with investors moving away from assets like Bitcoin and Ethereum. High oil prices and inflation concerns influenced portfolio adjustments, while Bitcoin selling pressure increased as short-term holders took profits. The market remains sensitive amid low sentiment.
CryptoBreaking2h ago
