SUI Price on Edge as Grayscale’s $GSUI ETF Debuts Tomorrow

SUI-2,88%
BTC-1,01%
ETH-2,64%
SOL-3,46%

SUI trades near $0.97 ahead of Grayscale’s GSUI ETF launch on NYSE Arca, with weekly gains of 10% and rising open interest.

SUI price is trading near key resistance levels as Grayscale prepares to launch its Sui Staking ETF under the ticker GSUI.

The token has posted steady weekly gains, and traders are watching whether the ETF debut could drive further price movement.

SUI Records Weekly Gains Ahead of ETF Launch

SUI traded around $0.97 on Wednesday after a modest daily increase of less than 1%.

Over the past seven days, the token has gained about 10%, reflecting gradual upward momentum.

The broader crypto market has also shown signs of recovery. Bitcoin traded above $68,000, while Ethereum hovered near the $2,000 level.

Other major altcoins such as Solana, XRP, and Dogecoin recorded mild gains during the same period.

SUI has remained above the $0.90 support zone in recent sessions. Market participants are monitoring whether sustained trading above $0.98 could support additional upside pressure.

Grayscale’s GSUI ETF Set for NYSE Arca Trading

Grayscale Investment confirmed that its Sui Staking ETF will begin trading on NYSE Arca under the ticker GSUI.

The launch follows an 8-A filing with the US Securities and Exchange Commission, which became effective automatically.

Grayscale Sui Staking ETF (Ticker: $GSUI) offers investors direct exposure to $SUI. 💧 $GSUI starts trading tomorrow on @NYSE Arca. pic.twitter.com/HzhTyAd3pd

— Grayscale (@Grayscale) February 18, 2026

The ETF is designed to provide regulated exposure to the SUI token. Investors will gain access to SUI price performance and potential staking rewards through a traditional exchange-traded product structure.

The fund carries a management fee of 0.35%, though Grayscale stated that the fee will be waived for the first three months.

The waiver remains in place until assets under management reach $1 billion. The launch adds another crypto-linked ETF to US markets.

**Related Reading:  **$143M in Short Liquidations Stack Above SUI – What Happens Next?

Technical Indicators and Price Levels in Focus

SUI recently tested resistance near the $1.20 level after stabilizing above $1.00. Analysts are observing whether the token can break above this resistance and approach the $1.50 range.

The Relative Strength Index stands near 52, which suggests moderate bullish momentum without entering overbought territory. Meanwhile, the Moving Average Convergence Divergence indicator shows the short-term line approaching the signal line.

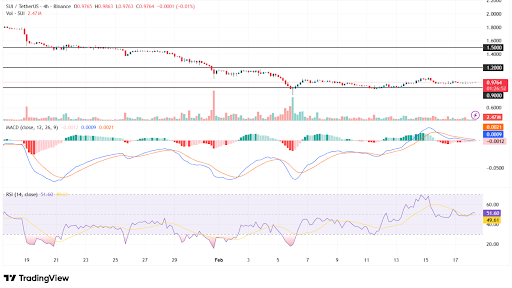
SUI consolidates near resistance as momentum cools. Source: TradingView

Open interest in SUI derivatives rose by 0.82% to about $512.65 million. The increase suggests growing trading activity as the ETF launch approaches.

Traders continue to monitor the $0.90 support level, as a break below that area could shift short-term price direction.

Disclaimer: The information on this page may come from third parties and does not represent the views or opinions of Gate. The content displayed on this page is for reference only and does not constitute any financial, investment, or legal advice. Gate does not guarantee the accuracy or completeness of the information and shall not be liable for any losses arising from the use of this information. Virtual asset investments carry high risks and are subject to significant price volatility. You may lose all of your invested principal. Please fully understand the relevant risks and make prudent decisions based on your own financial situation and risk tolerance. For details, please refer to Disclaimer.

Related Articles

Analysis: Bitcoin technical indicators show a death cross, previously warning of the "final market decline" in earlier cycles.

ChainCatcher Message, analyst @alicharts recently stated that the death cross of the 50 and 200 simple moving averages on the Bitcoin 3-day K-line chart occurred on February 27. Historically, such signals often indicate the final decline phase of a bear market. The article cites historical data since 2014, indicating that Bitcoin has fallen about 50% after this indicator appears in each bear market.

GateNews4m ago

Middle East Geopolitical Shock: Analyzing Hedging Capital Flows and BTC Pricing Logic Through Options Data

On March 1, 2026, a U.S.-Israel military strike resulted in the killing of Iran's top leader, triggering intense volatility in global markets. Traditional safe-haven assets like crude oil and gold rose, while Bitcoin faced significant turmoil. Options market data shows that institutional funds remain optimistic about the future, but hedging demand surged in the short term. Overall, the crypto market is expected to experience a corrective rebound after the panic, with particular attention to the $76,000 options maximum pain point.

PANews26m ago

U.S.-Iran Conflict » Analysts Say Bitcoin Bottoming Out, Market Focuses on Oil and U.S. Inflation Changes

The US-Iran conflict has driven up oil prices, raising concerns about inflation returning to 5%. Analysts believe that Bitcoin is relatively weak compared to gold, but when valued in gold, the bottom may appear this month, with a potential rebound to $74,000. Technical indicators show that Bitcoin has found support, while rising oil prices could impact the performance of risk assets.

CryptoCity32m ago

Shiba Inu Faces Pressure as 531B SHIB Flood Exchanges

Shiba Inu (SHIB) saw a significant 531 billion token influx on exchanges, indicating a shift towards selling among traders. Price remains below critical moving averages with bearish trends prevailing. Limited demand and rising supply create volatile conditions, especially with low liquidity typical of weekend trading.

CryptoFrontNews51m ago

"24-Hour Market" Gains Popularity Due to Middle East Conflict; Crude Oil and Gold Contracts Become the New Weekend Safe Havens

Due to the Middle East conflict, crypto exchanges like Hyperliquid have become hedging tools, driving the trading of traditional assets and cryptocurrencies. During market closures, traders can use these platforms for instant hedging, accelerating the development of 24-hour markets and demonstrating their indispensability under geopolitical influences.

MarketWhisper55m ago

Pi Network March technical deterioration, is the historical curse repeating?

Pi Network after hitting a new low in early February has recently rebounded to $0.1701, but capital outflow indicates that the rebound lacks support. The technical indicators MFI and CMF continue to show capital outflows. If the support at $0.1597 is broken, it will face greater downward pressure. Historical data from March suggests market caution. Reviewing past performance and technical indicators, the future trend remains to be seen.

MarketWhisper1h ago
Comment
0/400
No comments
Trade Crypto Anywhere Anytime
qrCode
Scan to download Gate App
Community
  • 简体中文
  • English
  • Tiếng Việt
  • 繁體中文
  • Español
  • Русский
  • Français (Afrique)
  • Português (Portugal)
  • Bahasa Indonesia
  • 日本語
  • بالعربية
  • Українська
  • Português (Brasil)