
ONDO has quietly stayed on traders’ radars even through a pretty rough stretch for altcoins. After months of selling pressure, the price is finally starting to calm down near a major support area, and the chart is beginning to look a lot more interesting again.
The ONDO price hasn’t gone on a serious run yet, but the structure is tightening up in a way that usually comes right before a bigger move.
- The ONDO Price Is Getting Squeezed Inside a Falling Wedge
- Resistance Is the Wall ONDO Has to Break
- ONDO Price Outlook From Here
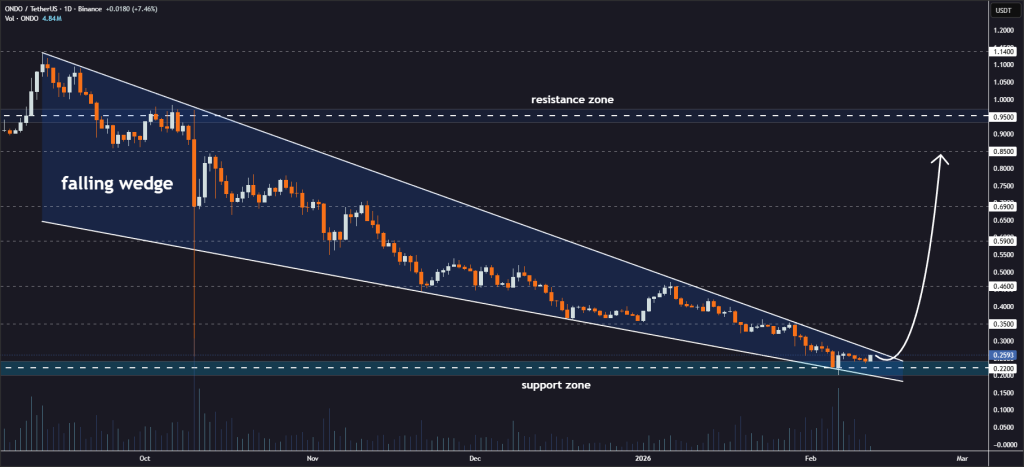
The ONDO Price Is Getting Squeezed Inside a Falling Wedge
On the daily chart shared by Jonathan Carter, the ONDO price has been trading inside a falling wedge for quite a while now. This pattern shows up when price keeps pushing lower, but each move down gets smaller and smaller.
That’s exactly what’s happening here. Sellers have been in control, but they’re losing momentum, and the range is compressing into a tighter channel. Now ONDO is pressing up against the upper edge of that wedge, which is usually the point where things start to heat up.
Source: X/@JohncyCrypto
These setups don’t stay quiet forever, once price runs out of space, volatility tends to come back fast. Support has also been holding strong around the $0.22–$0.25 zone, and buyers keep stepping in there.
Resistance Is the Wall ONDO Has to Break
The big level to watch now is wedge resistance just under $0.30. The ONDO price has been grinding right below it, and this is basically the make-or-break area. If bulls can finally push through, the chart opens up quickly.
The first upside levels traders are eyeing sit around $0.35 and $0.46, which match previous reaction zones. And if momentum really comes back, the bigger targets in the setup stretch toward $0.59, $0.69, and even $0.85.
Of course, nothing is guaranteed. If the ONDO price fails to break out and gets slapped back down, support becomes the key level all over again.
That $0.22 floor is doing a lot of heavy lifting right now. If it breaks, the wedge setup falls apart, and price could slide into another weak leg lower. That’s why this zone matters so much, ONDO is sitting right at a turning point.
Here’s the (Ondo) ONDO Price If Tokenized Stocks Just Become DeFi’s Next Big Collateral Boom_**
ONDO Price Outlook From Here
At the moment, the ONDO price is stuck in a classic squeeze. Support is holding, resistance is tightening, and the wedge is almost complete. That combination usually leads to a sharp move once the market finally chooses a direction.
If ONDO breaks above the wedge, upside targets show up fast. If it doesn’t, traders will be watching support closely for the next reset. Either way, ONDO isn’t drifting anymore, it’s setting up for a real decision move.
Disclaimer: The information on this page may come from third parties and does not represent the views or opinions of Gate. The content displayed on this page is for reference only and does not constitute any financial, investment, or legal advice. Gate does not guarantee the accuracy or completeness of the information and shall not be liable for any losses arising from the use of this information. Virtual asset investments carry high risks and are subject to significant price volatility. You may lose all of your invested principal. Please fully understand the relevant risks and make prudent decisions based on your own financial situation and risk tolerance. For details, please refer to
Disclaimer.
Related Articles
Bitunix Analyst: Hormuz Risk Escalation, Oil-Gold Chain Activation, BTC Upside Short Liquidity Accumulation
Dubai Gold Air Transport Hub flights suspended, Iran closes the Strait of Hormuz, leading to a sharp rise in oil prices and increased inflation expectations. Institutions favor gold, but rising oil prices may suppress gold prices. In the crypto market, BTC fluctuates between 69,500 and 70,500, with market focus on short squeeze and liquidity changes. Overall, macro volatility has increased, and BTC remains within the range, trading sideways.
GateNews2h ago
XRP Today's News: $650 million rush into exchanges, are investors preparing to sell?
In the past week, approximately 472 million XRP tokens flowed into exchanges, breaking the net outflow trend seen for several months and reflecting a defensive stance among holders amid geopolitical uncertainties. Although large inflows are generally seen as a warning sign of selling, they could also be a hedge. On the technical side, $1.30 is a key support level; if broken, the price could accelerate downward to $1.12. The resistance levels above are $1.50 and $1.61.
MarketWhisper2h ago
"1011 Insider Whale" claims the crypto market is still in a range-bound fluctuation
ChainCatcher Message: "1011 Insider Whale" GarrettJin posted on X platform stating that the current market transmission path is influenced by geopolitical impacts on the macro environment, which in turn further affects the crypto market. He pointed out that attention should be focused on indicators such as oil prices, the US dollar index, and the yields of 2-year and 10-year US Treasury bonds.
GarrettJin believes that the crypto market is still in a range-bound consolidation phase and states that maintaining caution is a common choice in the current environment.
GateNews2h ago
Bloomberg: The US-Iran conflict has limited impact on Bitcoin, currently consolidating between $60,000 and $70,000.
Bitcoin briefly declined in the US following news of strikes against Iran, but then rebounded, with trading prices surpassing pre-attack levels, indicating the market's low sensitivity to risk. After a significant correction, Bitcoin consolidated in the $60,000 to $70,000 range, retail participation decreased, and overall inflows weakened, resulting in a smaller impact from the new shock.
GateNews3h ago
Pi Network Foundation sells 48.88 million tokens, PI technical outlook is bearish
Pi Network recently experienced a surge in market supply after the foundation sold 48.88 million tokens, causing the price to fluctuate around $0.1700. Technical analysis shows that PI failed to break above the 50-day EMA at $0.1740, indicating a generally bearish outlook. If the $0.1700 support level is broken, further declines may occur. The community has criticized the transparency of token transfers, which has impacted market confidence.
MarketWhisper3h ago
Bitcoin briefly surged past $70,000 before falling back! Iran's capital outflow surged by 700%, VanEck calls it "building a bottom"
Bitcoin plunged and then rebounded after the US and Israel airstrikes on Iran, reaching a high of $70,110, currently around $68,500. Capital outflows from Iran's largest crypto exchange Nobitex surged by 700%, indicating that cryptocurrencies are becoming a channel for capital flight. VanEck's CEO believes the market is in a bottoming phase and remains optimistic about the future. Meanwhile, JPMorgan's Dimon warns of inflation risks, showing that geopolitical uncertainties continue to impact the market.
動區BlockTempo3h ago