Bitcoin futures suddenly show a liquidity gap! Bears are preparing to push through the $60,000 level

Bitcoin dropped to $65,800 on Wednesday, repeatedly failing to hold above $70,000. The Bitcoin futures liquidity heatmap shows a liquidity gap between $66,000 and $60,500, which may act as a magnetic pull, causing prices to rapidly pass through. Over $350 million in leveraged long positions are concentrated near $60,500 awaiting liquidation. The RSI below 50 indicates limited buying pressure.
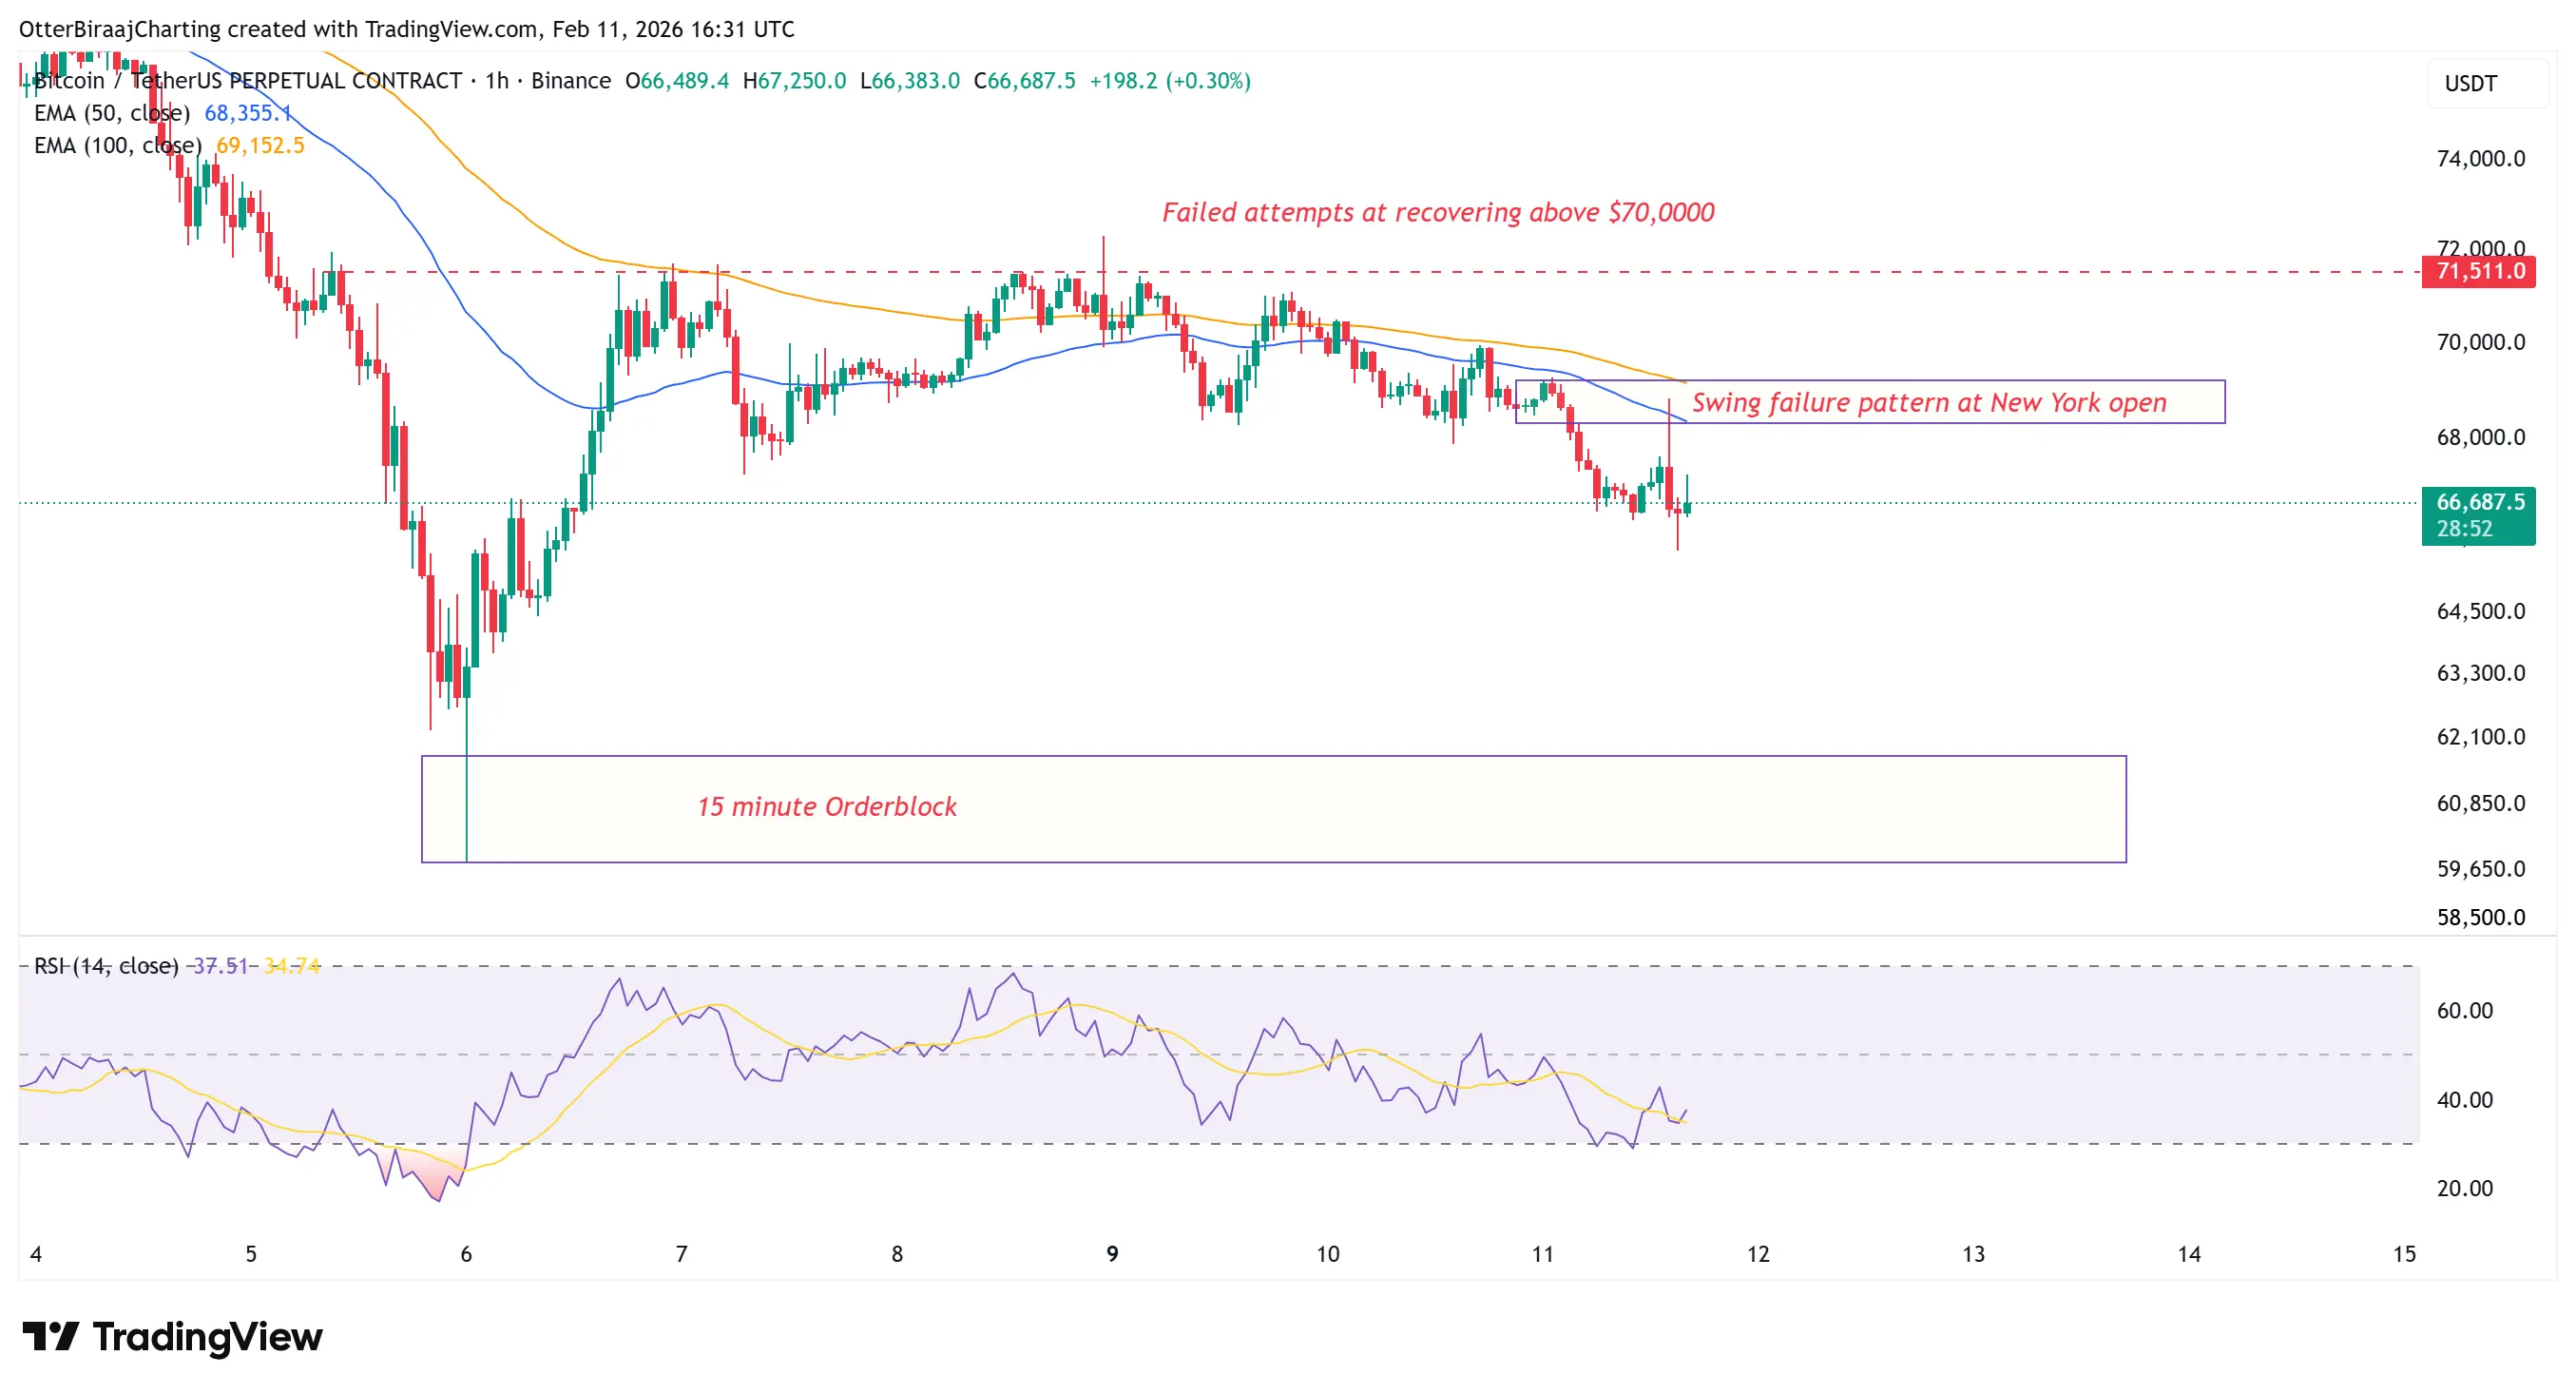
Failure to Defend the $70,000 Level: Chain of Failures for Bitcoin Futures Bulls
(Source: TradingView)
After multiple rejections near the resistance zone of $70,000 to $72,000, Bitcoin formed a series of lower highs. Due to the price trading below key moving averages, the Relative Strength Index (RSI) is trending toward oversold levels. The one-hour chart shows repeated failed attempts to stay above $70,000. Each rejection led to lower highs and persistent selling pressure.
During Wednesday’s New York trading session, Bitcoin briefly touched an intraday high of $69,800 before sharply retreating, forming a classic swing failure pattern. This movement frustrated breakout longs and accelerated the downward momentum. A swing failure pattern is an important reversal signal in technical analysis, indicating that bulls attempted to break resistance but failed, triggering a counterattack from bears.
Bitcoin also broke below the 50-week and 100-week exponential moving averages, confirming a short-term bearish control. The RSI remains below 50, showing limited buying pressure. When prices break below key moving averages and RSI stays weak, the technical bearish structure becomes very clear. Only if prices regain these levels and RSI breaks above 50 can the bearish momentum be initially considered waning.
A 15-minute order block is located near $60,800 to $61,000. After Bitcoin hit a yearly low of $59,800, strong buying pressure appeared in this zone. If the $64,000 level cannot hold, this area will remain a liquidity target. This order block represents the cost basis of early buyers; when prices fall back to this zone, these holders may add to their positions or hold, providing temporary support.
From the perspective of Bitcoin futures open interest, bulls have been repeatedly thwarted. Each attempt to approach $70,000 results in rejection by bears. These repeated failures weaken bullish confidence and capital, while bears become more aggressive after each successful defense. As the balance of power shifts further in favor of bears, downward pressure naturally increases.
Three Technical Signals of the $70,000 Level Breakdown
Swing Failure Pattern: $69,800 rally and reversal, failed breakout triggers selling
Moving Average Breakdown: Falling below the 50 and 100-week EMAs, confirming short-term downtrend
RSI Weakness: Below 50, indicating limited buying, oversold without rebound
This comprehensive technical deterioration offers an excellent shorting opportunity for Bitcoin futures traders. When multiple indicators signal bearishness, trend followers and quantitative systems will automatically open short positions, creating a self-reinforcing downward spiral.
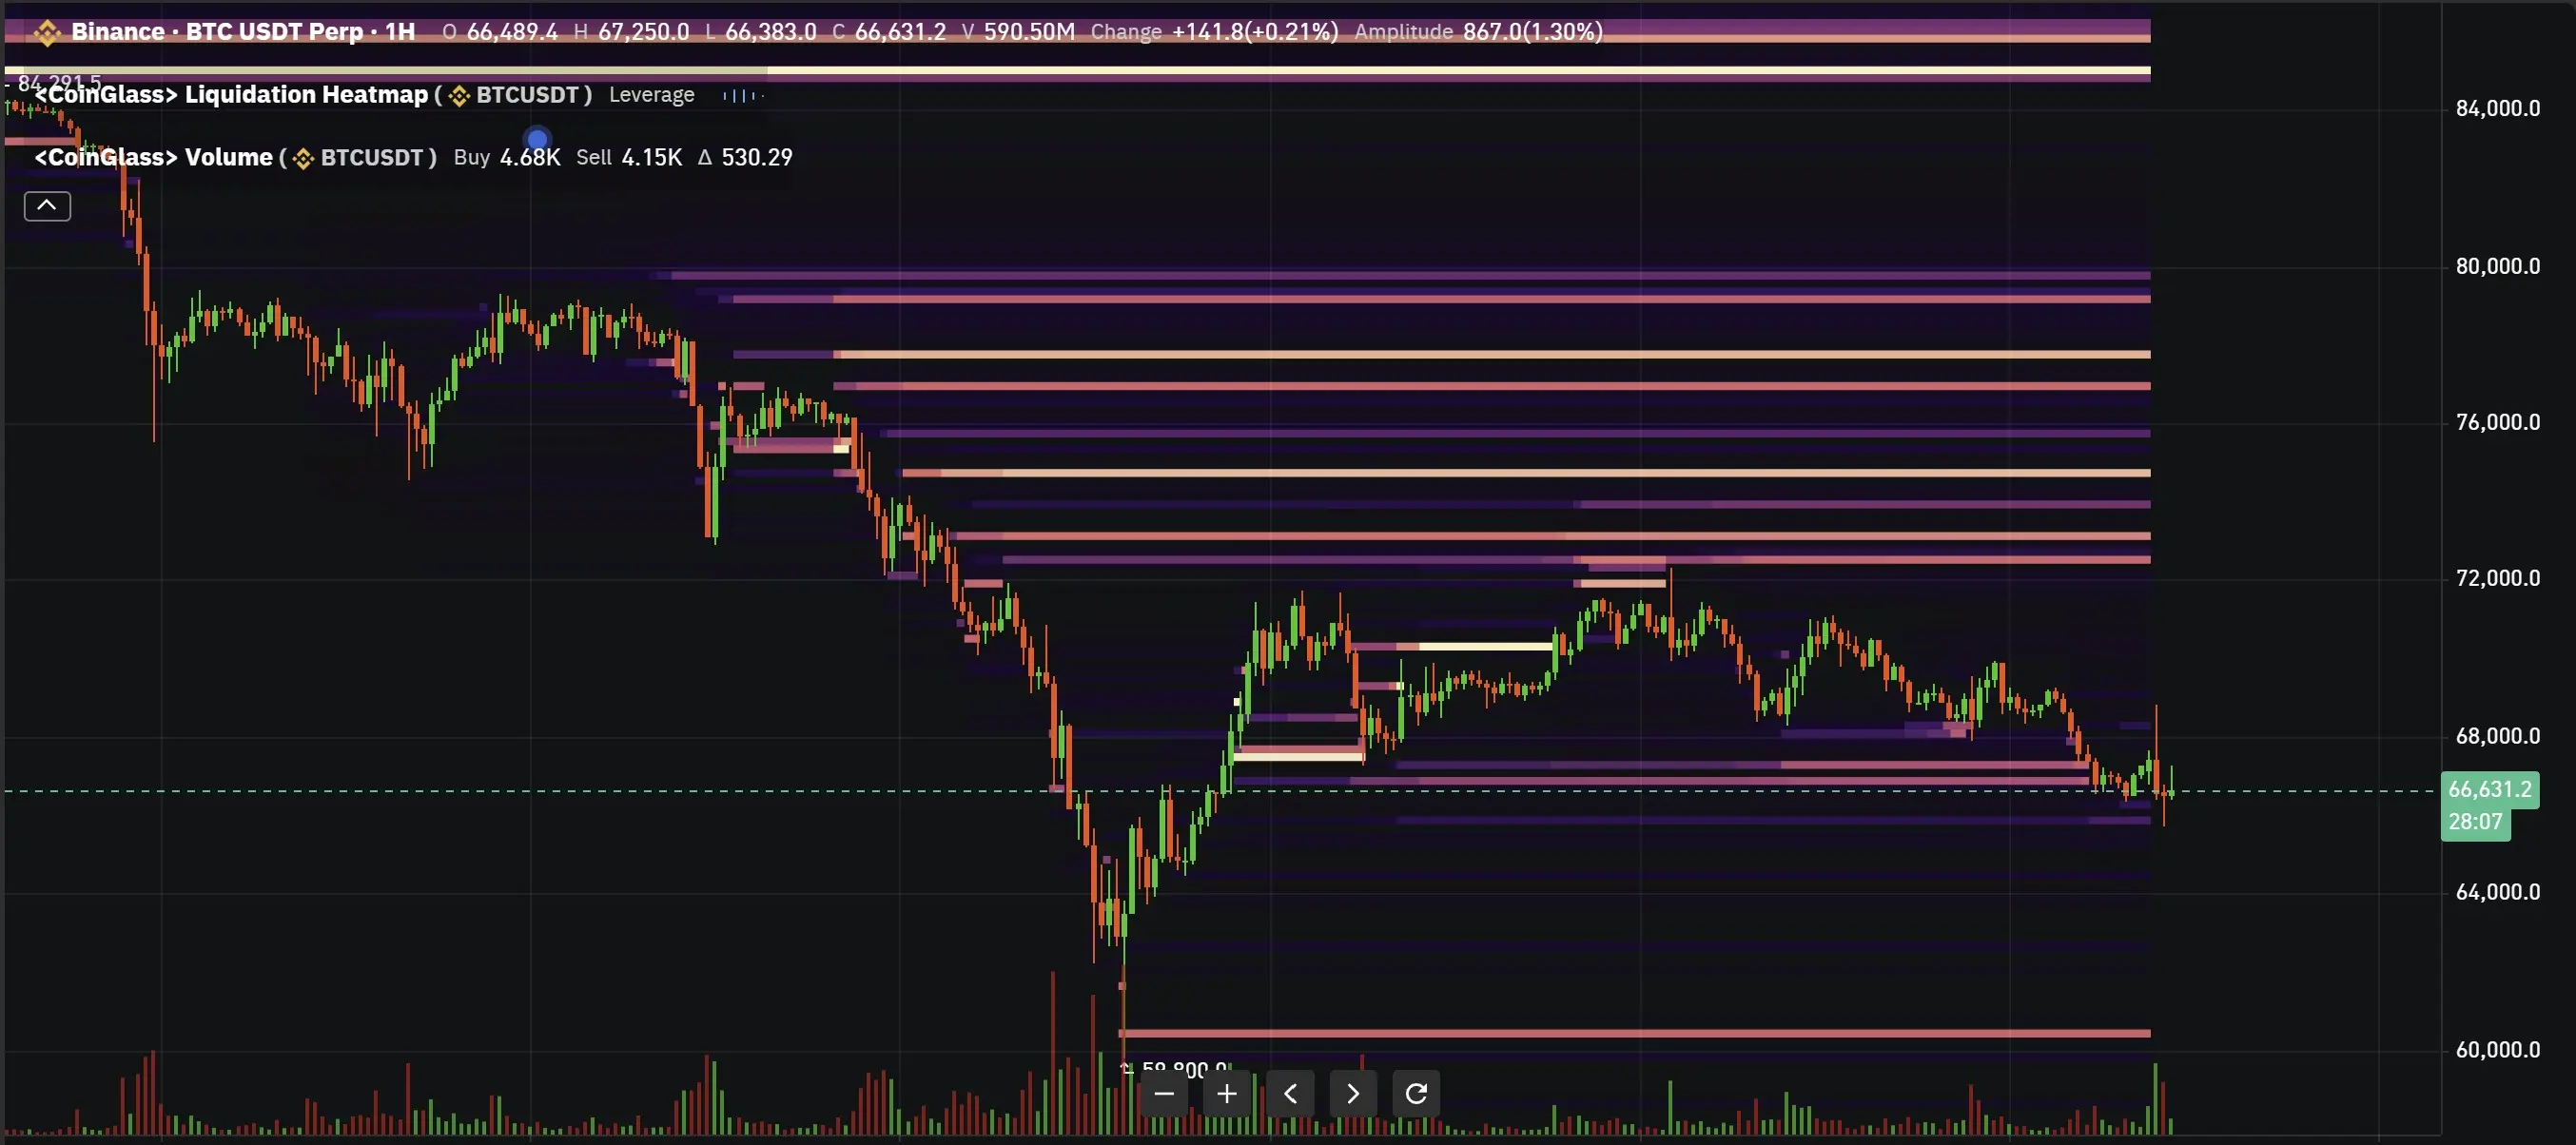
Liquidity Gap Trap: Magnetic Effect of $66,000 to $60,500
(Source: TradingView)
The Bitcoin futures liquidity heatmap shows a large cluster of orders above $72,000, but also highlights a “liquidity gap” between $66,000 and $60,500. This gap may act as a magnetic pull, as prices tend to pass quickly through low-liquidity zones, reaching clusters of stop-loss orders below.
Liquidity gaps typically form for two reasons. First, the price zone was rapidly crossed during prior upward moves without sufficient trading or position building. Second, early buyers in that zone have already exited with stops, removing support. Regardless of the cause, the result is a lack of buy-side support in that area, causing prices to accelerate downward once entering, until reaching the lower liquidity cluster.
The liquidation heatmap shows a lack of liquidity down to $60,500, indicating ongoing downside risk. Although liquidity increases near $60,500, the risk remains because over $350 million in leveraged long positions are still located around that level. This means that if prices fall to this point, these long positions will be forcibly liquidated, creating a chain of selling pressure.
The $350 million liquidation scale at a single price point is enormous. Such liquidations can generate a flood of sell orders in the market, potentially pushing prices down by thousands of dollars within minutes. Even more concerning, once $60,500 is triggered, prices could continue to decline toward $59,800 or lower, as support below is also weak.
From a futures trader’s perspective, this liquidity structure offers a clear shorting strategy. Opening shorts near $66,000 with a target of $60,500 offers an extremely favorable risk-reward ratio. If prices indeed fall into the liquidity gap, shorts could realize 8-9% gains in a short period. This asymmetric opportunity attracts significant short capital, further intensifying downward pressure.
Analyst Warning: VWAP Breakdown and Downtrend Trap
(Source: Husky)
Bitcoin trader Husky states that Bitcoin is breaking below the volume-weighted average price (VWAP) calculated from last week’s low of $59,800, which is currently regarded as the short-term fair value. VWAP is a widely used technical indicator among professional traders, representing the volume-weighted average price of recent trades, often seen as the “fair value” for the day or short-term.
Breaking below VWAP implies that the current market price is below the recent average trading cost, meaning most recent buyers are at a loss. This often triggers stop-losses and panic selling. As the overall market structure weakens, if Bitcoin cannot quickly rebound above $68,000, the risk of further decline toward support around $65,000 increases. Traders expect Bitcoin to fluctuate within the $60,000 to $72,000 range.
Similarly, market analyst EliZ notes that Bitcoin is currently consolidating near $66,500 within a descending channel. A descending channel consists of two parallel downward trendlines, with prices oscillating within but trending downward overall. When trading within a descending channel, each touch of the upper boundary is a selling opportunity, while each touch of the lower boundary may produce a brief rebound.
EliZ warns that if prices break below $66,500, Bitcoin futures could drop toward the support zone of $63,400 to $64,600, increasing the likelihood of a further slide to $60,000. The $66,500 level is the current lower boundary of the channel; a break below would signify a downward breakout, worsening the technical outlook. The $63,400 to $64,600 zone is a previous consolidation support; if this area also fails, the path toward $60,000 and even the $59,800 yearly low will be open.
Looking ahead, analysts believe that within the next few days, Bitcoin could break below $60,000. “Within a few days” suggests this week or early next week—a very urgent warning. If accurate, traders holding long futures positions should act immediately—either cut losses or add margin to prevent liquidation.
For shorts, the current technical setup and futures open interest provide an ideal shorting window. Prices within the descending channel, combined with the liquidity gap, create a pathway for accelerated declines, with $350 million in long liquidations adding downward momentum. The confluence of these factors makes shorting Bitcoin highly attractive risk-reward-wise.
Defense of $60,000: The Last Psychological Barrier for Bulls
Analysts warn that the expanding liquidity gap between $66,000 and $60,000 increases the likelihood of retesting the yearly low of $59,800. $60,000 is not only a technical support level but also a psychological milestone. Falling below this figure could severely damage market sentiment, potentially triggering panic selling.
$59,800 is the low point set on February 6 this year. If prices test or break below this level again, it would confirm Bitcoin’s entry into a deeper bear market. From a technical perspective, breaking the previous low often accelerates the downtrend, as it demonstrates that the support at that level has been fully destroyed.
However, there is also a contrarian possibility. If Bitcoin receives strong support and rebounds in the $60,000 to $61,000 zone, a “double bottom” pattern could form, which is a classic bullish reversal signal. The key is the strength and sustainability of the rebound; a weak bounce followed by another decline would confirm the downtrend remains intact.
Overall market sentiment in the Bitcoin futures space is extremely cautious. Bulls are demoralized after repeated failures, with limited new buying interest. Bears are gaining confidence, viewing each rebound as an opportunity to add to shorts. This one-sided sentiment often persists until an extreme event or catalyst triggers a reversal. Until then, Bitcoin futures are likely to remain dominated by bears.
Related Articles
Dalio: "There is only one kind of gold," Bitcoin is not a true safe haven tool for central banks
Why did Bitcoin drop today? Trump threatens to deploy ground troops, Iran conflict uncertainty prolongs
Crypto Fear Index drops to 10, market "Extreme Fear" has lasted nearly a month
ETF Launch Fails to Stem Tide As XRP Sinks to $1.81, Lowest Since April
Here’s Where Gold Price Could Head Next After the $300 Drop
Analyst Says Not Buying Kaspa (KAS) Here Is a “Disservice” – Here’s Why