Bitcoin faces a psychological test as long-term holder groups begin to waver
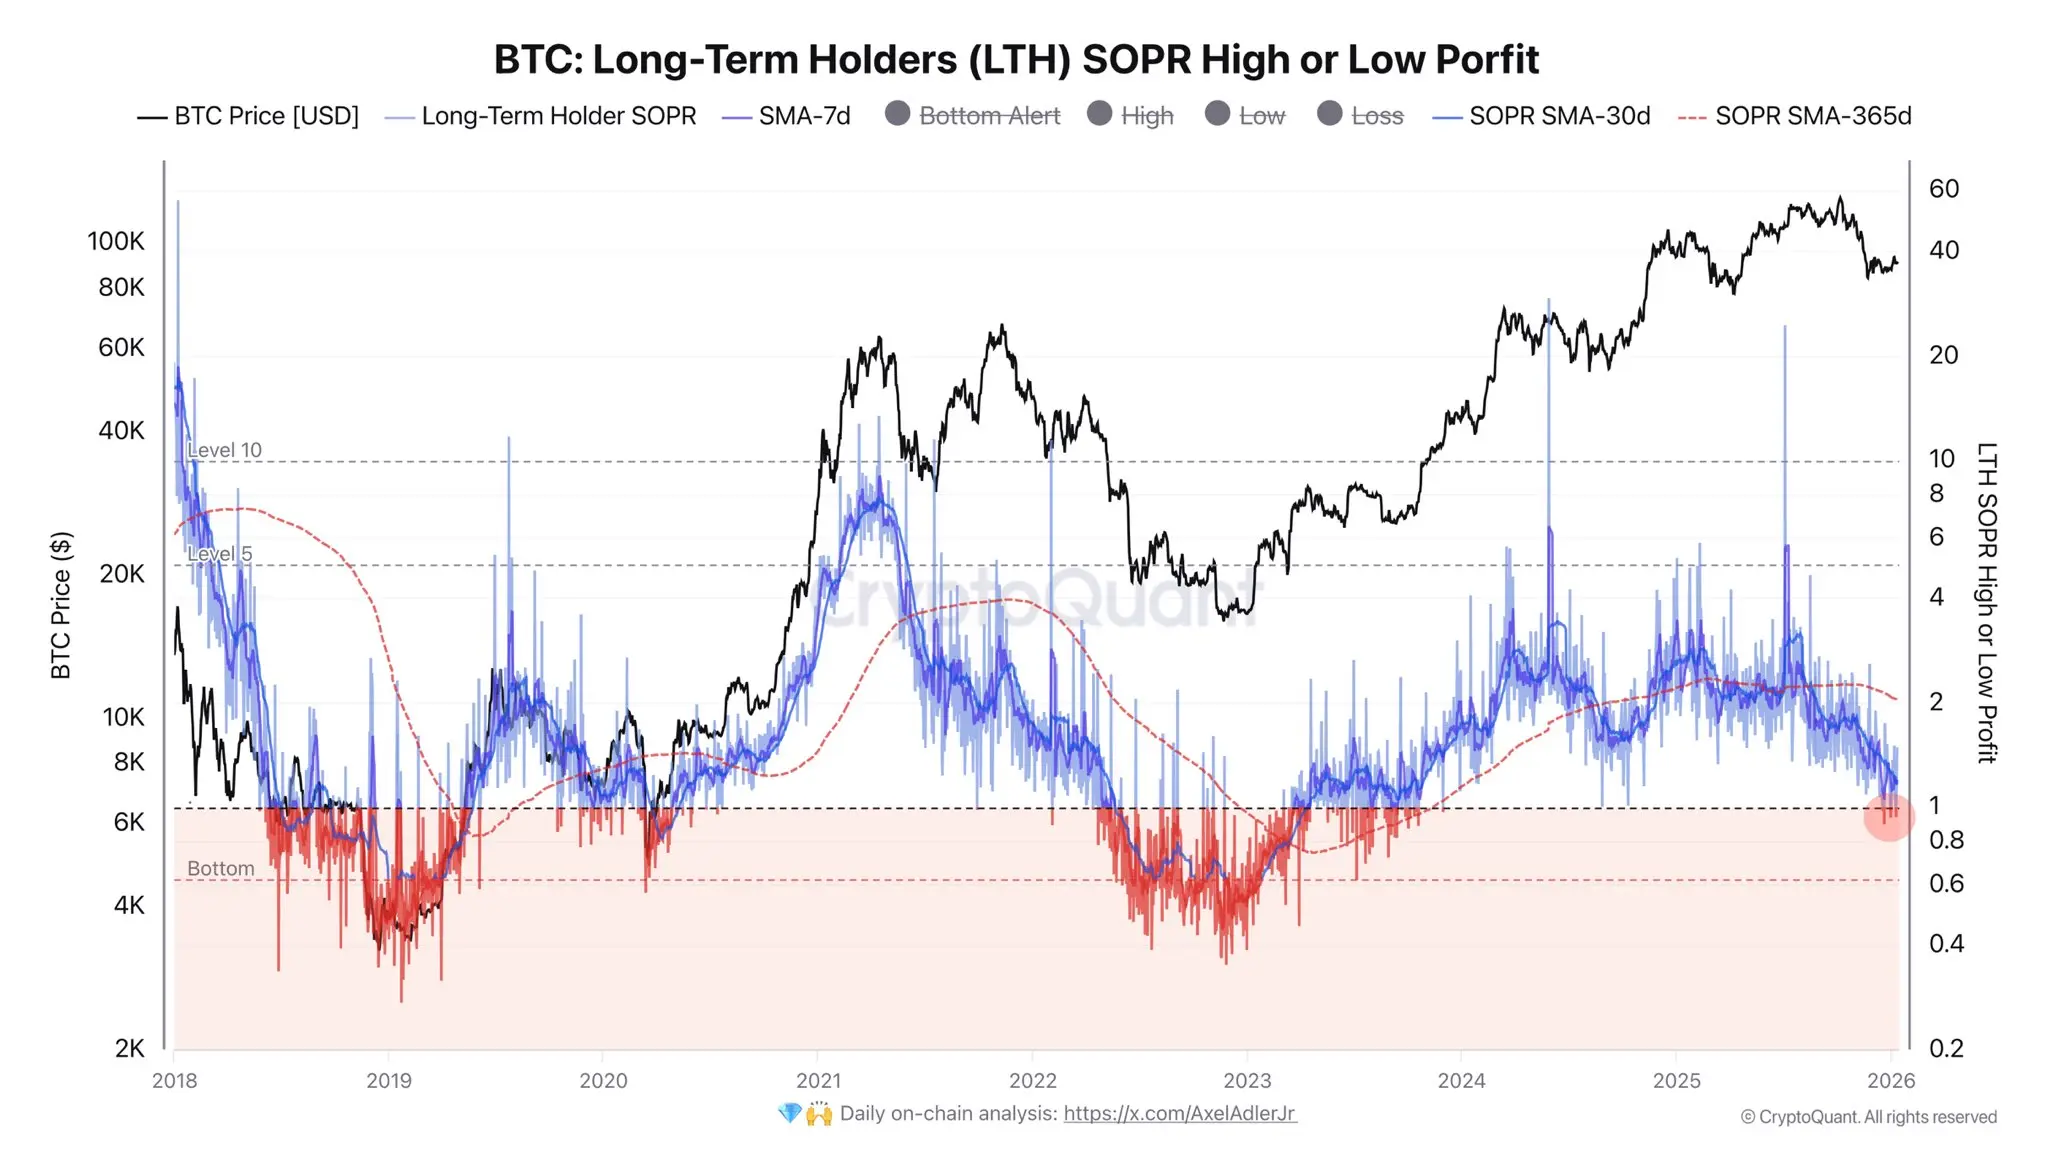
Bitcoin (BTC) is showing early signs of tension among long-term investors, as the LTH SOPR (Spent Output Profit Ratio) index recently dropped below the 1.0 threshold. This indicates that some holders are beginning to sell BTC at a loss.
Although still localized, this development reflects increasing cautious sentiment in the market as BTC fluctuates around the $90,000 level, accompanied by mixed technical signals.
This is a noteworthy signal, because BTC holders for over six months are generally considered a stable support during price corrections. The fact that this group is starting to sell, albeit cautiously, could imply short-term weakening risks or a shift in sentiment after months of accumulation.
The LTH SOPR indicator measures whether on-chain BTC transfers are being sold at a profit or loss. Values above 1.0 indicate profit-taking activity, while falling below 1.0 suggests a “surrender” phenomenon, where investors accept selling at a loss.
According to analysis shared by market observer Darkfost on January 13, Bitcoin’s LTH SOPR for coins held over six months has at times fallen below this threshold. Such behavior often appears during downtrend phases, reflecting selling pressure from a relatively “younger” long-term holder group—those who bought within the past 9 months and are currently at a loss.
 Source: Darkfost This development also coincides with large investors reducing their positions. As previously noted, addresses holding between 1,000 and 10,000 BTC have sold a total of approximately 220,000 BTC over the past year, the fastest decline rate since early 2023.
However, the 30-day moving average of LTH SOPR remains above breakeven at around 1.18, but significantly lower than the annual average near 2.0. This indicates that actual profits are shrinking across the market.
Currently, the market shows conflicting analytical viewpoints. On one hand, LTH SOPR indicates certain pressure and tension; on the other hand, some technical analysts see constructive signals. Egrag Crypto’s analyst points out the emergence of a “hidden bullish divergence” on Bitcoin’s weekly chart, where the price forms higher lows while the RSI indicator forms lower lows—a pattern often signaling a potential continuation of the upward trend.
Additionally, the Sell-Side Risk Ratio—measuring the scale of realized profits and losses—has returned to levels recorded in October 2023, suggesting that distribution is ongoing but at a less intense pace.
Looking ahead, Bitcoin’s outlook will likely depend on its ability to break out of the current accumulation range. Over the past week, the price mostly oscillated between $90,000 and $92,400 with relatively modest volatility. In the last 24 hours, BTC increased by about 1.7% to around $92,200, as short-term holders approach breakeven, according to investor CW.
Analysts suggest that reclaiming the $92,000–$95,000 zone could trigger new buying momentum. However, persistent resistance—possibly the eighth or ninth attempt in recent weeks, according to Ted Pillows—raises concerns that the upward drive may be weakening.
Related Articles
Michael Saylor’s 'Turn of the Century' Post Sparks Fresh Bitcoin Buy Speculation
Crypto News Today: Pepeto Presale Delivers Faster Math Than BTC’s 88% Odds of $122K as ARK Invest Buys $19M Dip
Middle East geopolitical conflicts boost demand for safe-haven assets. What are the defensive assets?
Hyperliquid Whale Sees $42M Bitcoin Long Position Partially Liquidated After BTC Pullback