TRON (TRX) is establishing itself as one of the leading stablecoin payment platforms, thanks to its high practical application value and increasing widespread usage. According to the latest report from Coin Photon, USDT transactions currently make up the majority of weekly transactions on the TRON network, highlighting the platform’s central role in the stablecoin payment ecosystem.
Moreover, an efficient fee-burning mechanism combined with increasingly active staking activities has helped reinforce and increase the protocol’s value. Notably, the digital payment platform Wirex has also announced the deployment of a fully on-chain payment layer on TRON, opening new approaches for daily spending activities and significantly promoting the network’s real-world application.
Is TRON about to resume an uptrend?
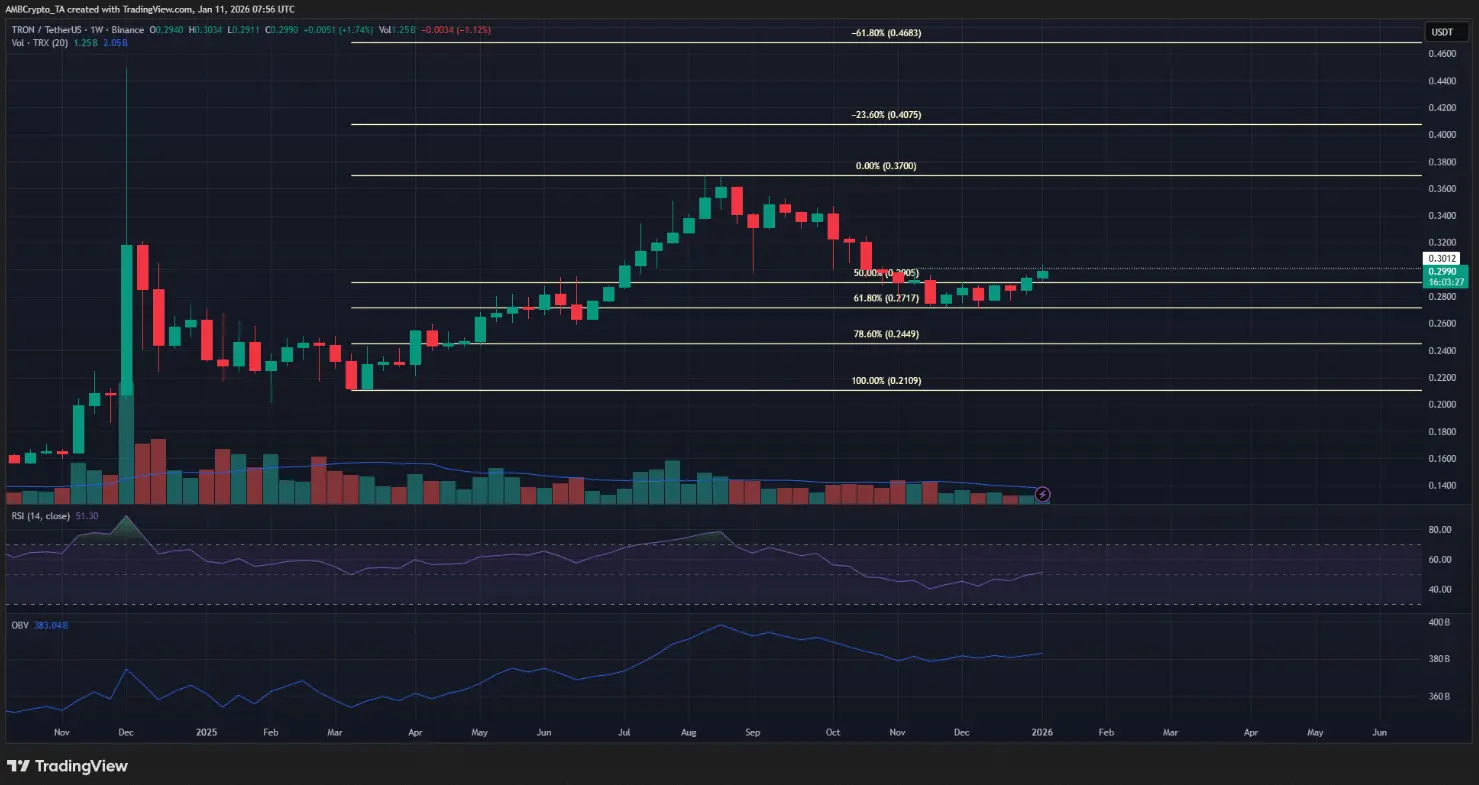 Weekly TRX/USDT Chart | Source: TradingViewThe weekly chart shows that TRX is still moving within a solid bullish structure. The strong rally from March to August pushed the price from $0.21 to $0.37. By the end of the year, the market entered a correction phase, pulling the price back to test the 61.8% Fibonacci level around $0.272 — an important technical support zone.
After completing the test, TRX quickly rebounded, further strengthening the long-term growth outlook. This development opens opportunities for medium-term traders to consider a (Long) strategy in the near future.
Regarding indicators, OBV has shown a slow but steady increase since November, indicating that buying volume remains stable. Meanwhile, the weekly RSI has risen to the 51 zone, reflecting a gradually forming and spreading bullish momentum across larger timeframes.
Why might TRON still be unprepared for a strong breakout?
This is a scenario traders need to be especially cautious about. The $0.30 level is not only a psychologically significant resistance but also served as a notable supply zone in the first two weeks of November.
At the time of writing, TRX was already rejected on lower timeframes on Saturday (January 10). Although the price briefly reached $0.3025, buying pressure quickly weakened, causing TRX to reverse and decline 1.19% to around $0.2990.
More notably, Bitcoin (BTC) momentum has shown signs of stalling in recent days. In a scenario where BTC corrects and loses the $89,000 support zone, the market is likely to see increased selling pressure, which could lead to downside risks for the TRON token.
Trader strategy: Wait for a breakout to buy
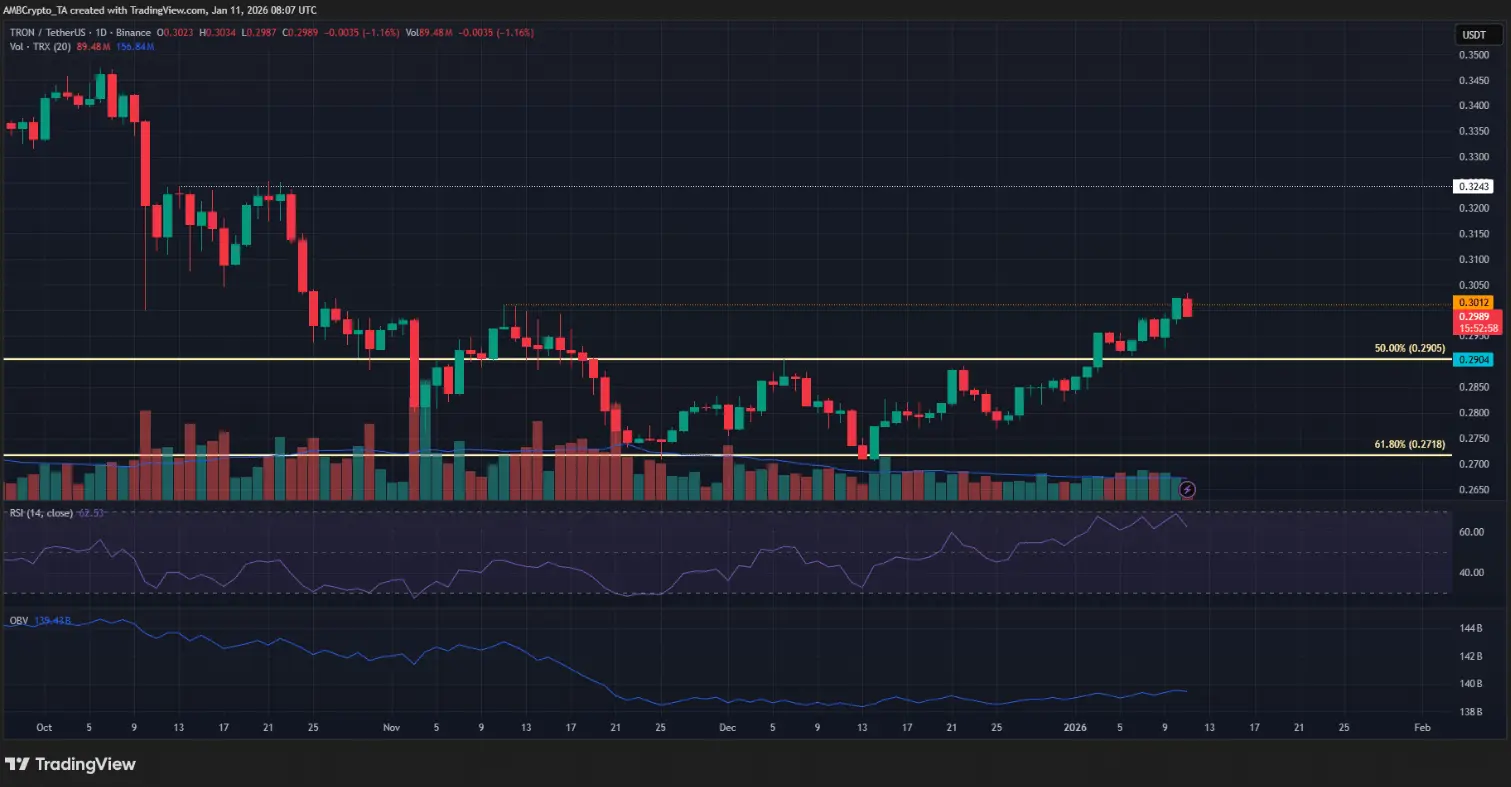 Daily TRX/USDT Chart | Source: TradingViewThe $0.3012 level marks an important oscillation peak formed in early November on the daily chart.
Given that the bullish structure remains intact on the weekly chart and a breakout appears increasingly likely, traders can patiently wait for the price to surpass and reclaim the $0.3012 level, confirming this zone as a solid support before considering opening long positions.
If the positive scenario unfolds, the next price targets are $0.324 and $0.347 respectively. Conversely, losing the $0.29 level would break the bullish outlook, forcing the market to reassess the current trend.
Disclaimer: The information on this page may come from third parties and does not represent the views or opinions of Gate. The content displayed on this page is for reference only and does not constitute any financial, investment, or legal advice. Gate does not guarantee the accuracy or completeness of the information and shall not be liable for any losses arising from the use of this information. Virtual asset investments carry high risks and are subject to significant price volatility. You may lose all of your invested principal. Please fully understand the relevant risks and make prudent decisions based on your own financial situation and risk tolerance. For details, please refer to
Disclaimer.
Related Articles
Will XRP Hold $1.33 or Extend Toward $1.30 Before Rebound?
XRP is currently trading at $1.35, experiencing a 1.3% decline. Key support is at $1.34, while resistance is at $1.40. The price is testing around the Fibonacci levels of $1.33 and $1.30, crucial for potential upward movement or deeper decline.
CryptoNewsLand2h ago
Dogecoin Monthly Breakdown Pattern Reappears as Price Tests $0.0918
Dogecoin is currently trading at $0.09205 at a gain of 2.3, with support of above $0.08878.
As can be seen in the monthly chart, there are recurring breakdown areas that have been followed by significant expansions in price.
The short-term trading range is narrow and the immediate point o
CryptoNewsLand2h ago
Solana Nears $95 Resistance With $17B Volume Surge
Solana approaches a key resistance level near $95, with increased trading volume and open interest signaling active trader interest. The token is currently at $90.20, facing potential upward movement if it surpasses $95, but may test $85 if rejected.
CryptoFrontNews3h ago
Bitcoin Slips to $68,000 as Middle East Conflict and US Jobs Data Trigger Sell-Off
Bitcoin surrendered its $70,000 support level, triggering a broader crypto market retreat that wiped out $329 million in leveraged positions. This downturn was fueled by a perfect storm of geopolitical and macroeconomic pressures.
Wiping out the ‘War Gains’
Bitcoin’s midweek resilience
Coinpedia3h ago
PEPE Hovers at Critical $0.053414 Support as $432M Volume Surge Tightens Breakout Watch
PEPE is trading at $0.053416, just above support at $0.053414, with significant trading volume up 22.14%. Resistance is at $0.053676. Despite a slight decrease in price, there’s increased market activity, suggesting potential volatility.
CryptoNewsLand3h ago
DXY Retest at 99.183: Will 100–101 Break as US Degen Index Stabilizes?
DXY trades at 99.183 while retesting the 100–101 monthly resistance zone.
US Degen Index 6900 sits at $0.0001197 with support at $0.0001175 and resistance at $0.0001214.
A break above 101 on DXY would shift structure higher, while rejection keeps price below key resistance.
The U.
CryptoNewsLand3h ago