Polygon ($POL) Jumps After Open Money Stack Launch — Is a Bigger Move Brewing?

Key Highlights:
-
Polygon ($POL) climbed over 6% following the launch of Polygon Labs’ Open Money Stack, despite broader market volatility.
-
Open Money Stack aims to enable instant, borderless on-chain payments, positioning Polygon as a core infrastructure layer for global finance.
-
On the weekly chart, POL is forming a Power of 3 structure, often seen near market cycle lows.
-
Price recently dipped below $0.15 before stabilizing, aligning with the manipulation phase of the pattern.
-
A reclaim of $0.15 and the 50-week moving average could open the door for a broader upside expansion.
Polygon’s native token $POL has stepped into the spotlight amid broader market volatility, posting over 6% gains in the past 24 hours despite downside pressure across major cryptocurrencies. The move comes following a major announcement from Polygon Labs, sparking renewed interest in the ecosystem.
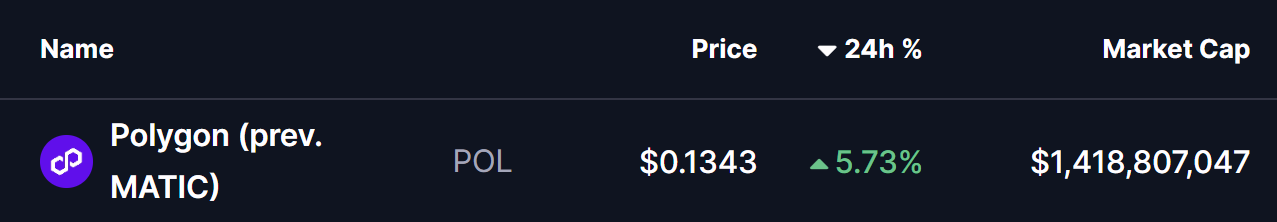
Source: Coinmarketcap
Beyond the short-term reaction, the higher-timeframe chart is beginning to reveal a larger technical structure that could be setting the stage for a potential rebound — provided key levels are reclaimed in the coming weeks.
Polygon Labs Announced Open Money Stack
Polygon Labs has officially introduced the Open Money Stack, a modular and vertically integrated platform designed to enable seamless, instant, and borderless on-chain money movement using stablecoins.
Built on Polygon’s experience facilitating over $2 trillion in on-chain value transfers, the Open Money Stack aims to act as the missing infrastructure layer connecting traditional fiat systems with blockchain rails. The framework brings together core components such as liquidity orchestration, compliance tooling, on- and off-ramps, wallet infrastructure, and on-chain yield mechanisms — all designed to remain chain-neutral and interoperable.
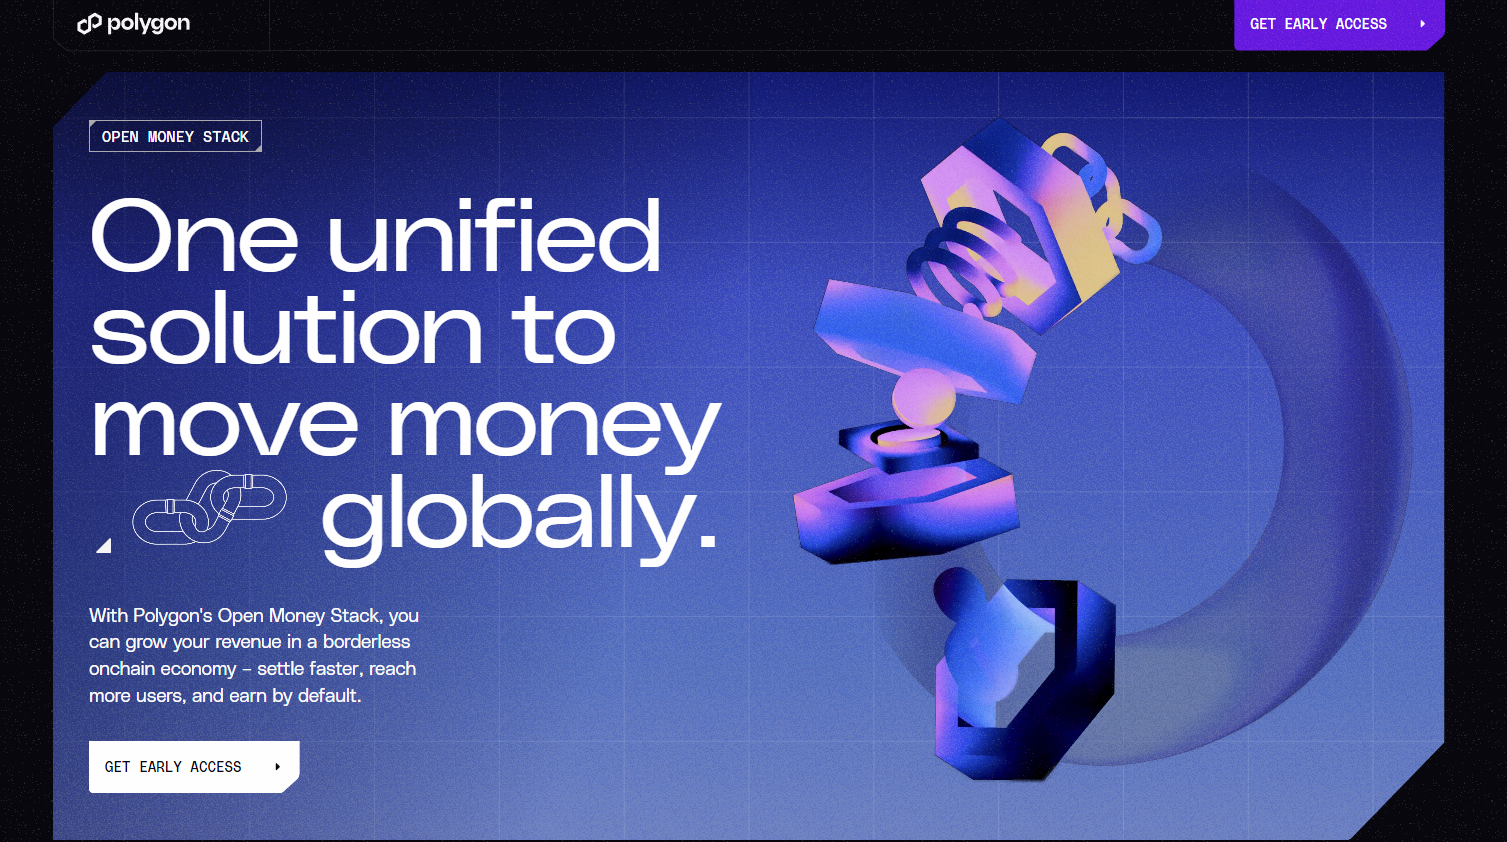
Source: polygon.technology
As Polygon founder Sandeep Nailwal and CEO Marc Boiron stated, “We freed information first with the internet. Money is next.” The initiative seeks to make global payments faster, cheaper, and accessible worldwide, while keeping capital on-chain and productive by default.
The Open Money Stack is rolling out in phases, with early access currently available to design partners. Additional announcements related to payments, orchestration, and compliance are expected in the weeks ahead.
Weekly Chart Structure Signals a Possible Turning Point
From a technical perspective, the weekly chart suggests that POL may be developing a classic Power of 3 (PO3) structure — a pattern often associated with market cycle lows and trend transitions.
This structure typically unfolds across three stages: accumulation, manipulation, and expansion, with the most powerful move often emerging once the final phase begins.
Accumulation Phase
Earlier in the year, POL spent an extended period consolidating inside a defined range, capped by resistance near $0.2766 and supported around the $0.15 region. This sideways price action reflected long-term accumulation, with neither bulls nor bears gaining decisive control.
Manipulation Phase
During the recent market-wide downturn, POL broke sharply below the $0.15 accumulation support, sliding toward a local low near $0.107. This breakdown — highlighted by the red-shaded zone on the chart — fits well with the manipulation phase of the Power of 3 pattern, where stop losses are triggered, sentiment turns bearish, and weaker hands are flushed out.
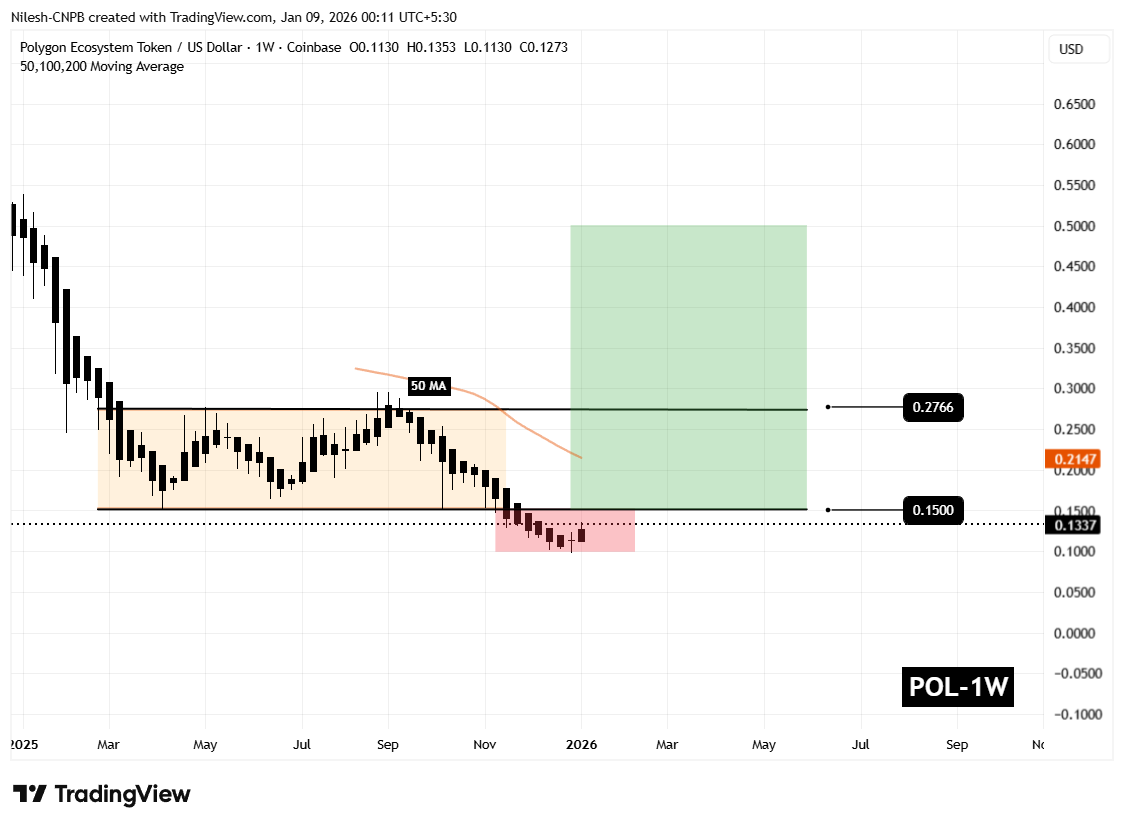
Polygon (POL) Weekly Chart/Coinsprobe (Source: Tradingview)
Notably, selling pressure has begun to cool near this zone, with POL now trading back around $0.13, suggesting early signs of stabilization.
What Comes Next for POL?
At present, POL remains in the lower portion of the structure, trading just below the key $0.15 level — the former accumulation support that now acts as a major decision zone.
For bullish momentum to gain credibility, POL needs to reclaim $0.15 and subsequently move back above the 50-week moving average near $0.2147. A sustained recovery above these levels would signal a transition into the expansion phase of the Power of 3 setup, where upside momentum typically accelerates.
If price successfully pushes through the $0.2566 resistance, the longer-term chart projection opens the door toward the $0.48–$0.50 region over the coming months — an area that aligns with prior structural resistance.
That said, the setup remains conditional. As long as POL trades below $0.15, downside risks cannot be fully ruled out, and volatility may persist. Holding current lows and reclaiming key resistance zones will be critical for bulls to validate a broader trend reversal.
For now, POL sits at an important crossroads — one where fundamentals are strengthening, and the technical structure is quietly preparing for its next decisive move.
Frequently Asked Questions (FAQ)
What is driving the recent price movement in Polygon (POL)?
Polygon’s recent price strength follows the announcement of the Open Money Stack by Polygon Labs, which has improved market sentiment. This fundamental catalyst, combined with a constructive weekly Power of 3 technical structure, has increased bullish interest in POL.
What is the Power of 3 pattern seen on Polygon’s chart?
The Power of 3 (PO3) pattern consists of three phases: accumulation, manipulation, and expansion. On Polygon’s weekly chart, price action suggests it may be transitioning from accumulation into a potential expansion phase, often associated with trend reversals.
Is Polygon (POL) showing signs of a trend reversal?
Technically, Polygon is showing early signs of a possible trend reversal. The formation of higher lows and reclaim attempts above key structural levels suggest buyers are gradually regaining control, though confirmation depends on sustained follow-through.
Is Polygon (POL) a good investment right now?
Polygon’s technical and fundamental setup looks constructive, but cryptocurrency markets remain highly volatile. Investors should consider market conditions, risk tolerance, and conduct independent research before making investment decisions.
Does Polygon’s Open Money Stack impact long-term value?
The Open Money Stack strengthens Polygon’s ecosystem by improving infrastructure for payments and financial applications. Over time, this could support adoption and long-term value if execution and user growth continue.
Disclaimer: The views and analysis presented in this article are for informational purposes only and reflect the author’s perspective, not financial advice. Technical patterns and indicators discussed are subject to market volatility and may or may not yield the anticipated results. Investors are advised to exercise caution, conduct independent research, and make decisions aligned with their individual risk tolerance.
About Author: Nilesh Hembade is the Founder and Lead Author of Coinsprobe, with over 5 years of experience in the cryptocurrency and blockchain industry. Since launching Coinsprobe in 2023, he has been providing daily, research-driven insights through in-depth market analysis, on-chain data, and technical research.
Related Articles
Crypto Market Slides as Bitcoin Falls on War Tensions
Crypto Markets Surge Amid Middle East Tensions and Whale Accumulation
PEPE Holds $0.053796 Support After 12% Drop Amid $580M Trading Spike
Dogecoin Drops 9.6% to $0.08885 as Adam and Eve Pattern Tests Key Neckline
BTC short-term decline of 0.81%: Futures long liquidation wave triggers passive selling and liquidity resonance, intensifying volatility
Breakout Pushes $0.09656 DOGE Above Converging Trendlines as Price Trades Between Key Levels