Is the Cardano price rally slowing down? The chart shows a risk fluctuation within 9%
Over the past week, the price of Cardano (ADA) has increased by nearly 21%, and in the last 24 hours alone, it has risen by about 7%, making it one of the major coins with the most positive developments. This upward momentum was initially considered quite sustainable, as technical signals on the chart indicated an improving trend.
However, upon deeper analysis, the market picture becomes more complex. Although the overall trend still leans towards growth, momentum indicators suggest that the strength of the trend is gradually weakening. Instead of a sharp correction, current data indicate a high likelihood that ADA will enter a sideways accumulation phase before establishing its next direction. Below are detailed analyses of the market signals.
Uptrend maintained, but momentum decreasing on the 12-hour chart
On the 12-hour timeframe, ADA still maintains an uptrend structure. A notable positive signal is the upcoming crossover between the exponential moving averages (EMA), as the 20-period EMA approaches the 50-period EMA. This crossover often signals that the medium-term trend is being reinforced.
However, momentum indicators show signs of stagnation. From December 9 to January 6, ADA’s price was trending downward while the (RSI) increased. This is a hidden bearish divergence—often indicating weakening momentum, with potential short-term correction risks, rather than a trend reversal.
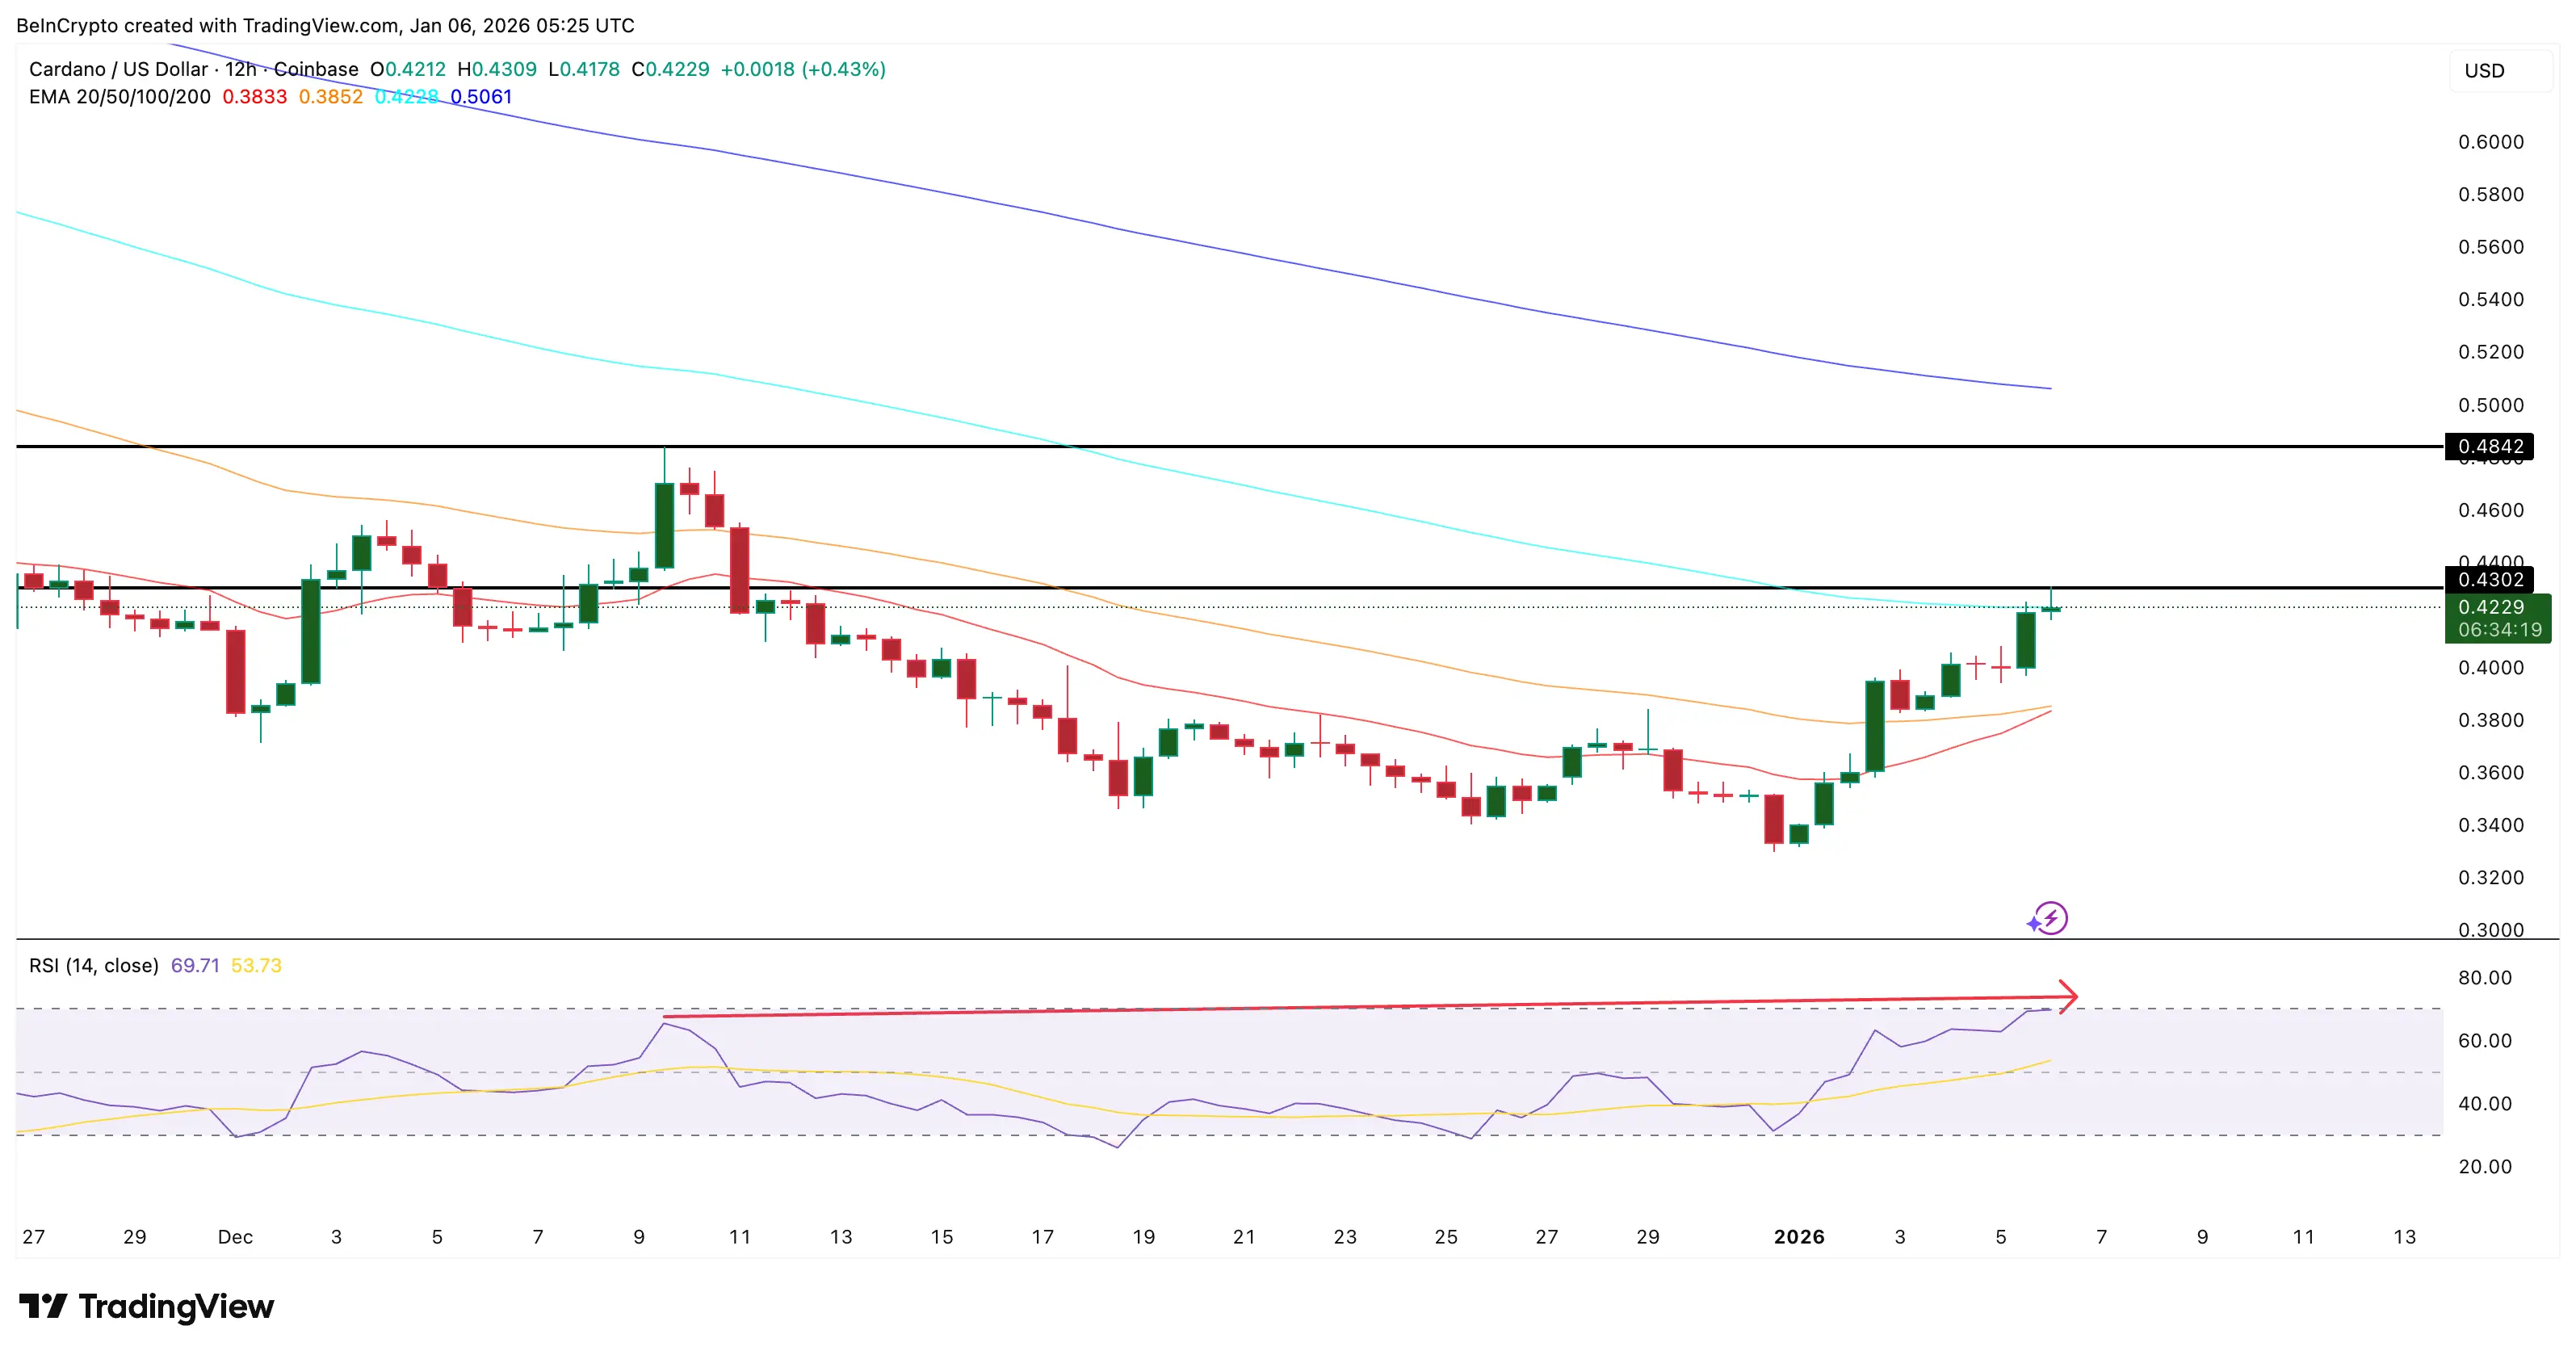 Conflicting indicators appear | Source: TradingView If the next candle of ADA forms below the $0.43 level, a lower high pattern will be confirmed, increasing the risk of correction.
In summary, the uptrend still exists, but the driving force has weakened. This combination often leads to an accumulation phase, moving sideways rather than continuing a strong rise or a sharp decline.
On-chain data: Patient investors, no signs of panic
On-chain indicators suggest the likelihood of a deep correction is quite low at this time.
The Spent Coins Age Bands index tracks the amount of ADA moved by investor groups with different holding periods. When this value decreases, it indicates that investors are holding onto their coins rather than selling.
The two most prominent groups are:
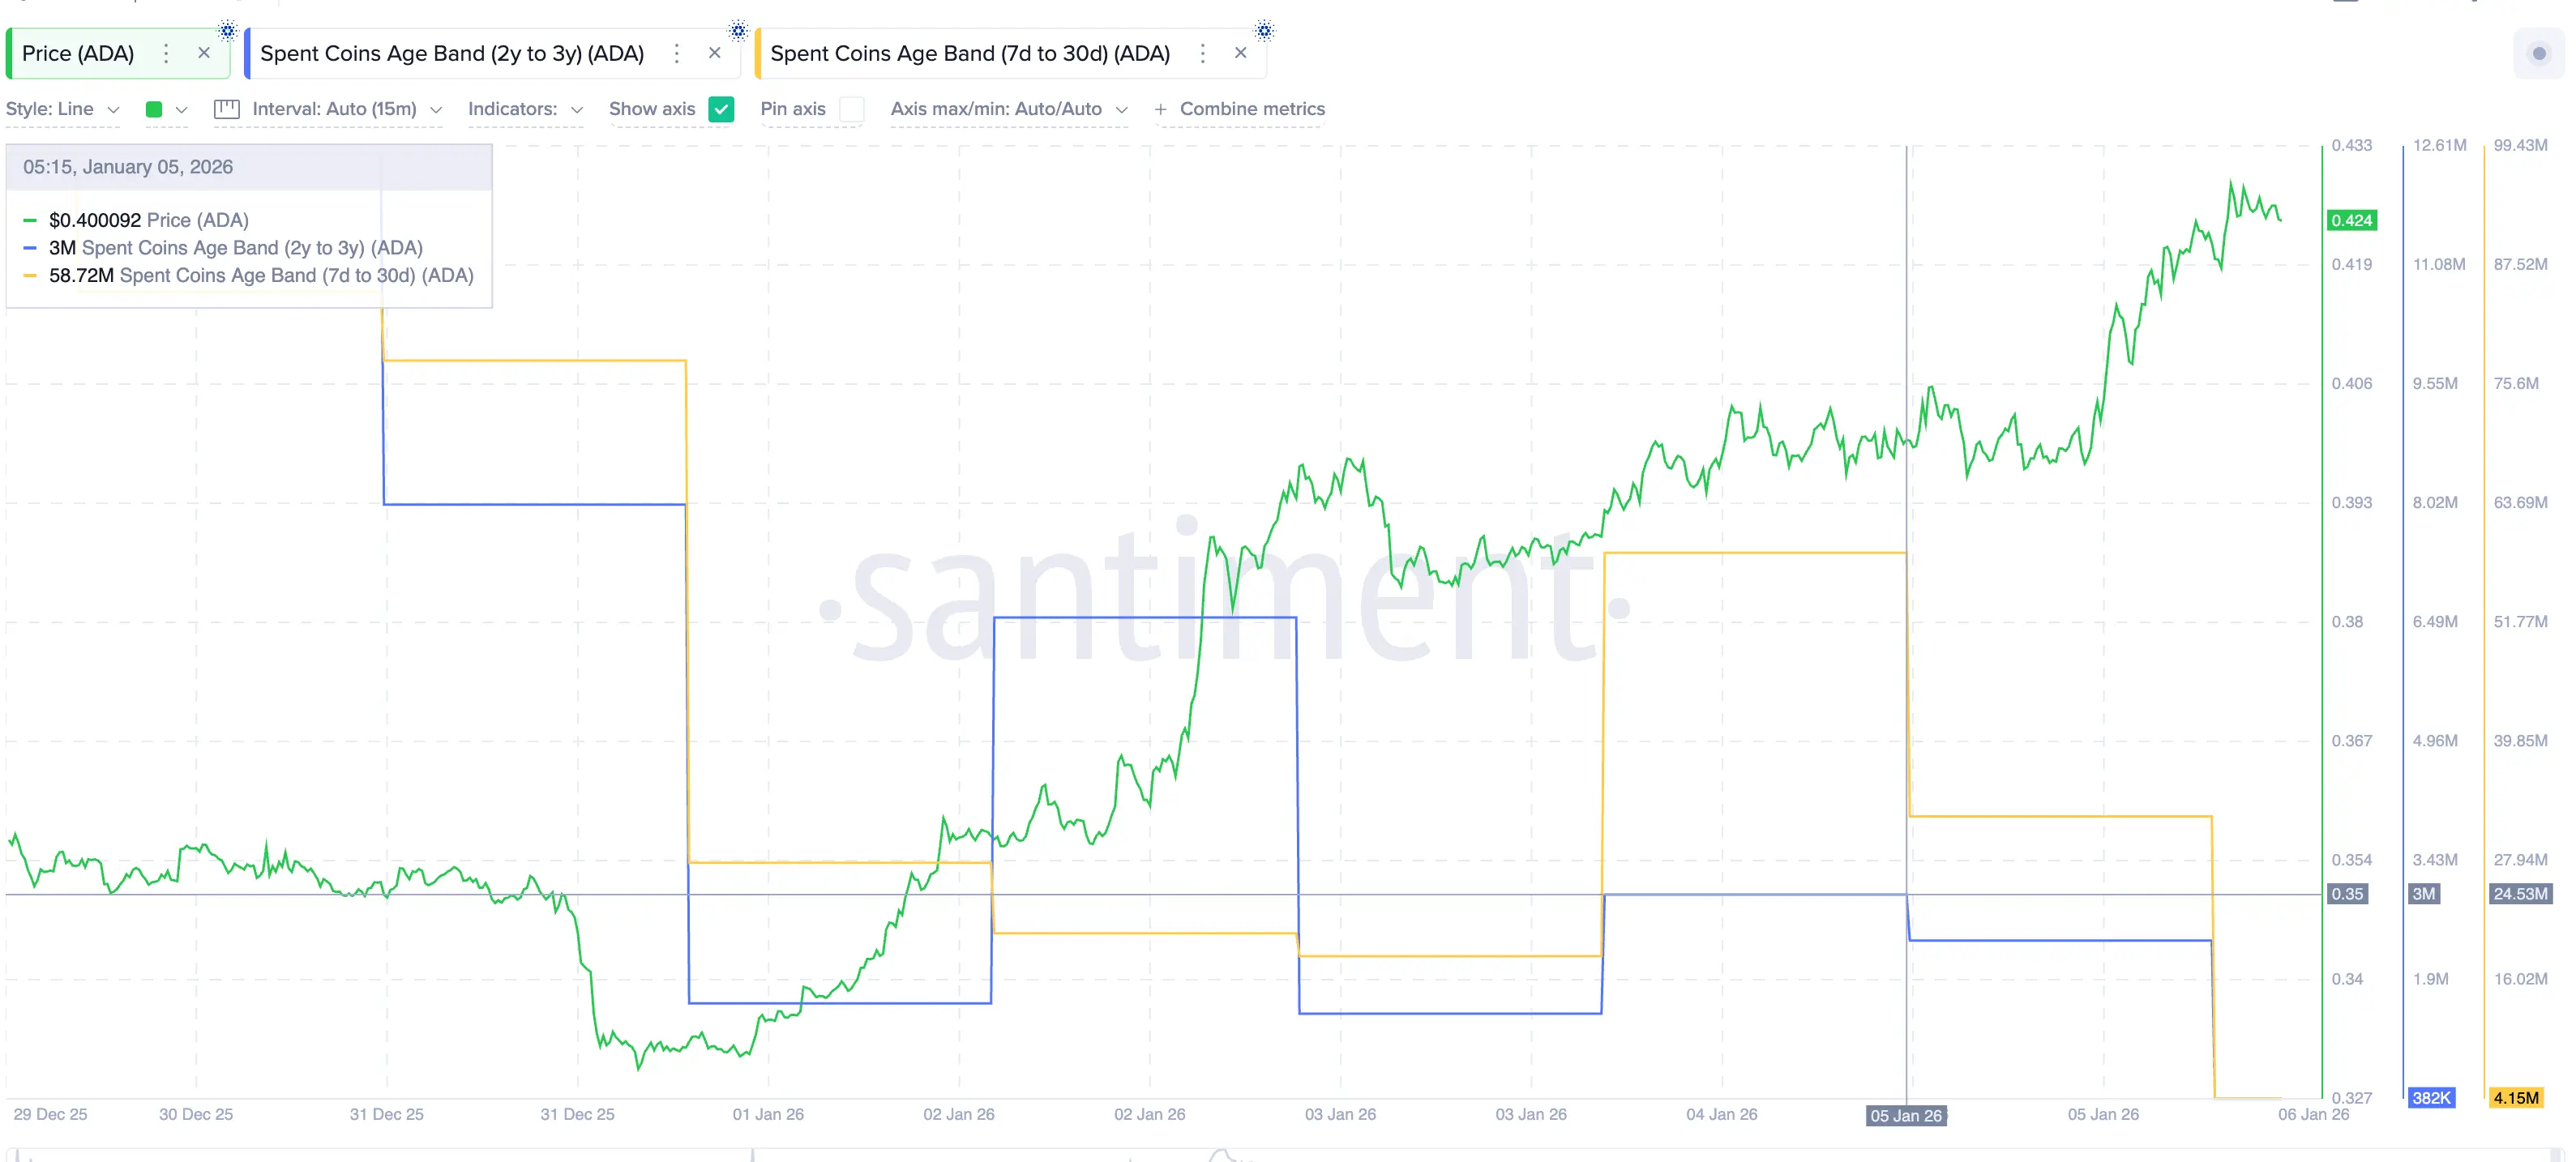 Slow transaction activity of ADA coins | Source: Santiment This shows that both short-term and long-term investors are choosing patience, with no signs of panic selling or strong profit-taking, even after the recent impressive rally.
When market momentum decreases but capital flow remains low, the market typically shifts into an accumulation state, trading within a narrow range rather than experiencing sharp declines.
Important ADA price levels: Trading range of 9%
In the context of weakening trend strength and momentum, price levels become particularly significant.
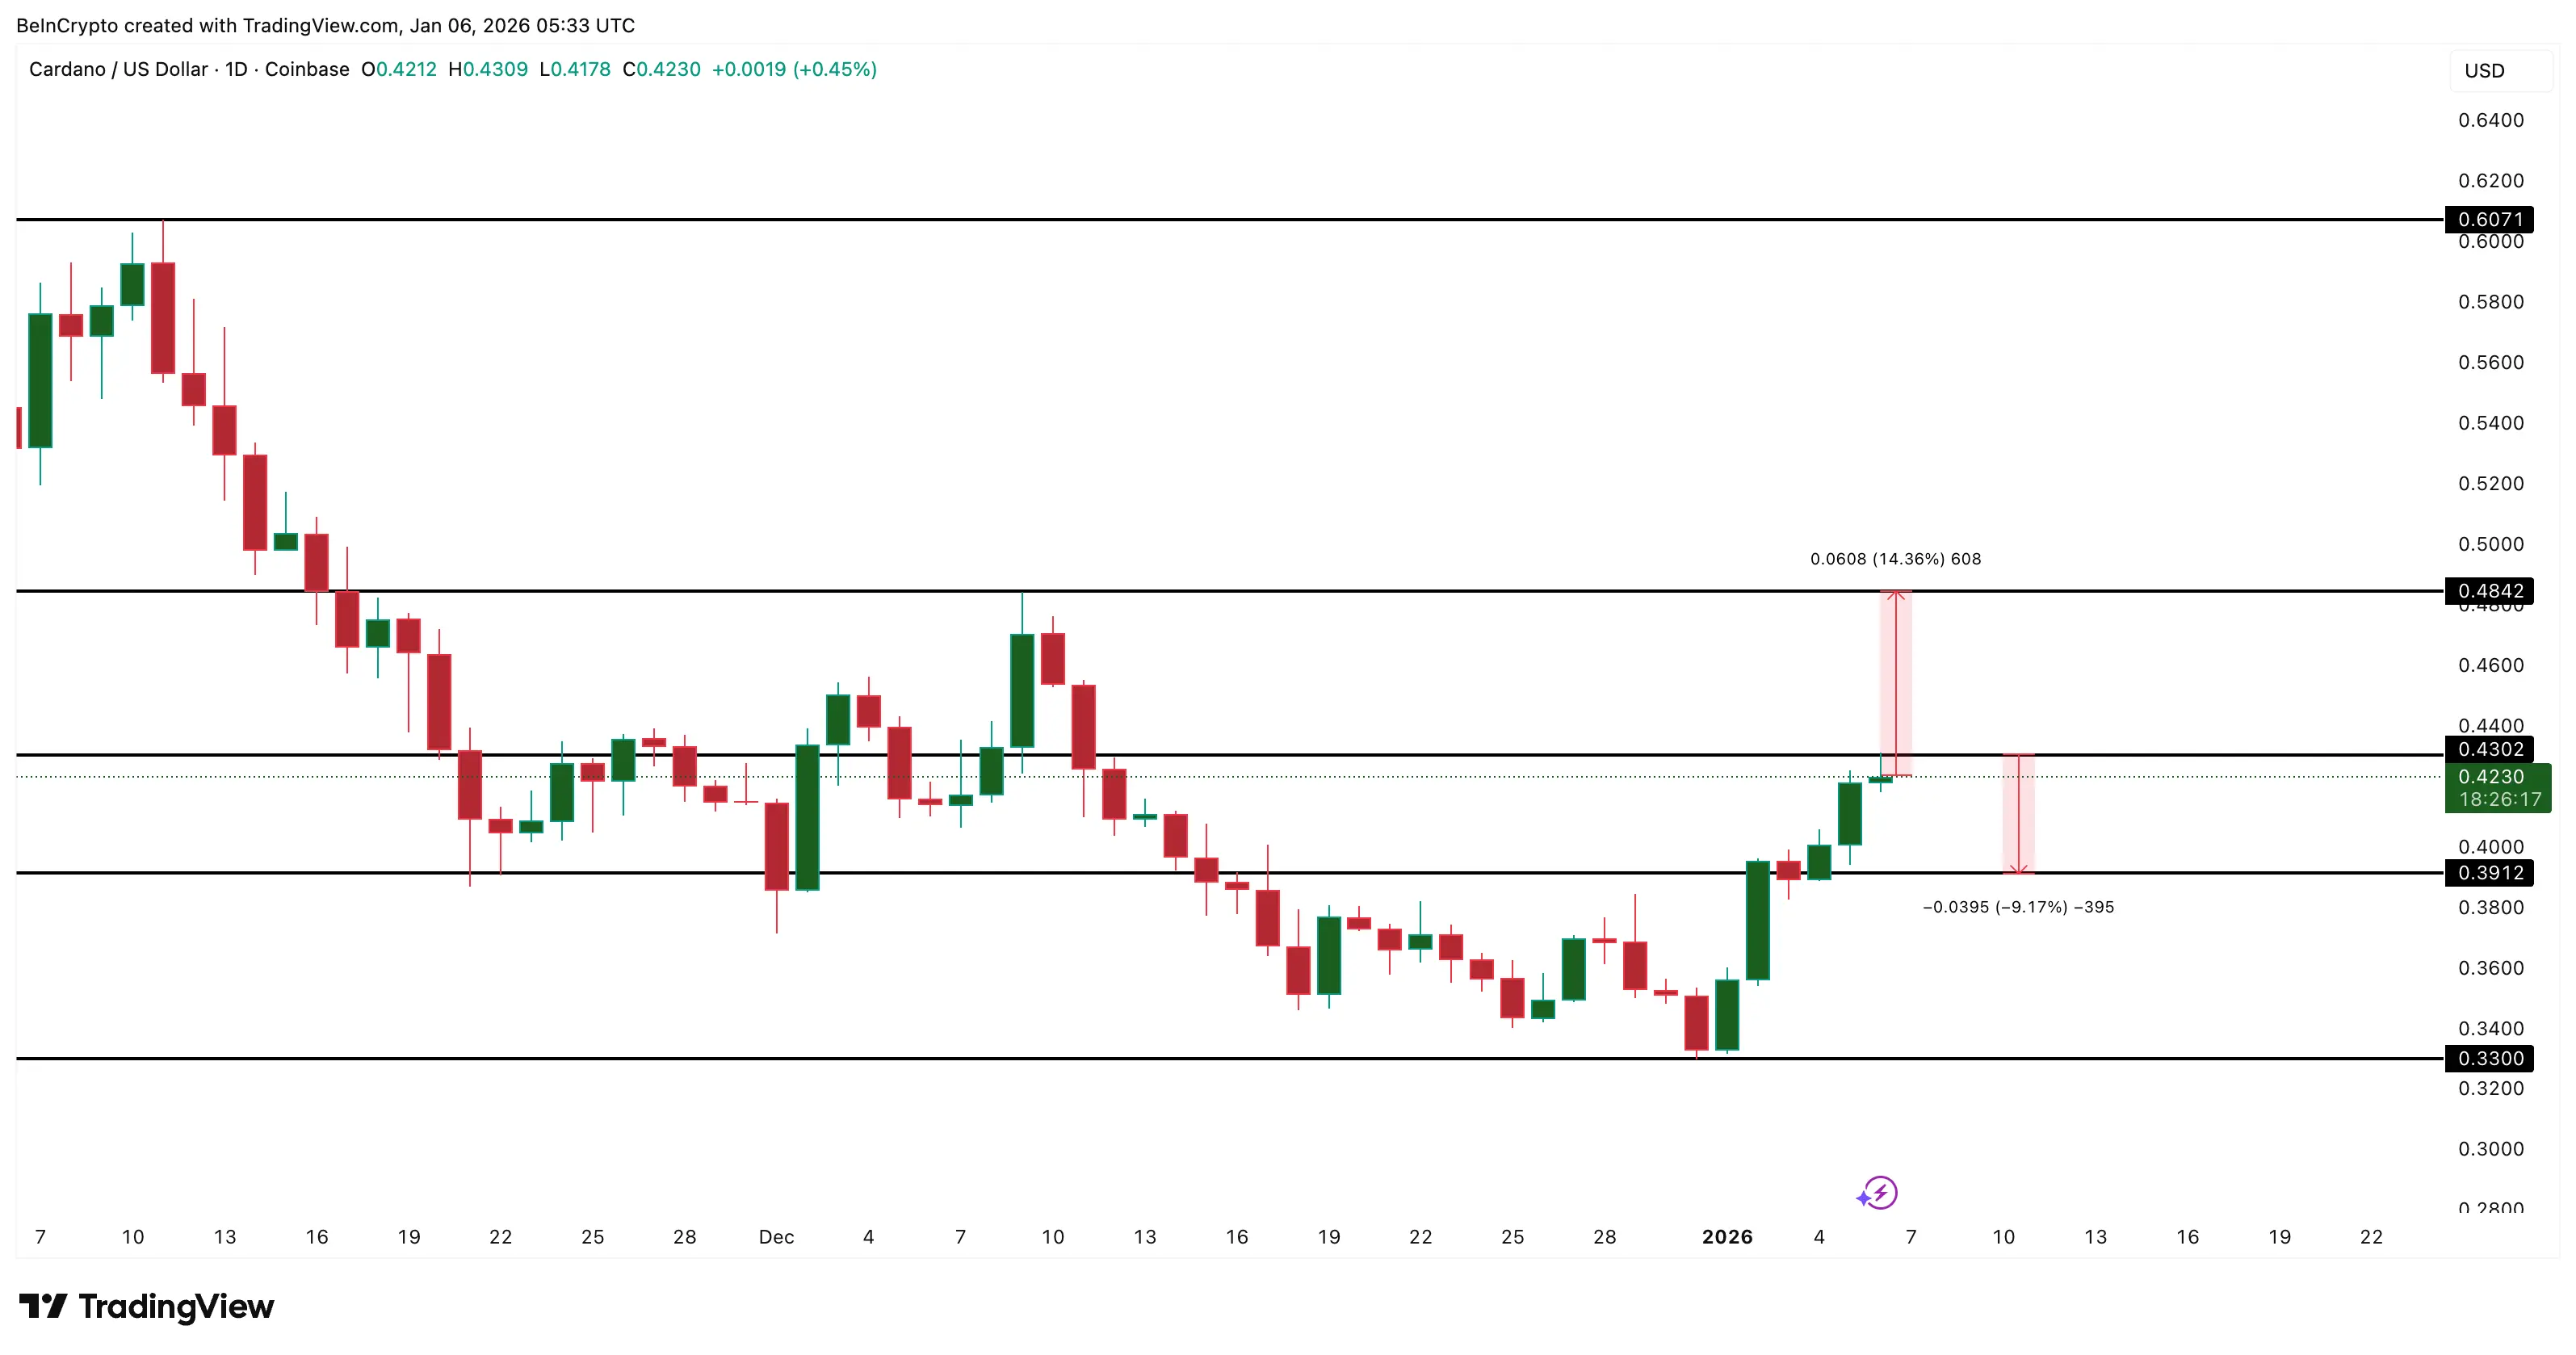 ADA price analysis | Source: TradingView Until one of these levels is broken, the most likely scenario is that ADA will trade within the range of $0.39 to $0.43, corresponding to about a 9% fluctuation.
This range accurately reflects the current market dynamics: the uptrend still exists, patient investors have not sold, but momentum needs time to reset before the next major move.
Related Articles
PiDay 2026 Incoming – Why This Guy Thinks PI Is About to Moon
Altcoin Polkadot Experienced Bullish Surge, Analysts Share Technical Breakout Details
HBAR Slips Below $0.09 as Bearish Structure Targets $0.07
ETH short-term increase of 1.10%: Whales adding positions and leveraged short liquidations trigger a structural rebound
Citrini AI reports warn of an economic collapse? Bitcoin and stablecoins become safe havens, institutions bet on a new payment system
Bitcoin falls below $64,000! The US and Israel carry out airstrikes on Iran, Middle East conflict escalates, impacting the crypto market