[Old T's Big Mouth Brings a Rebound? But the Downtrend Still Dominates!]
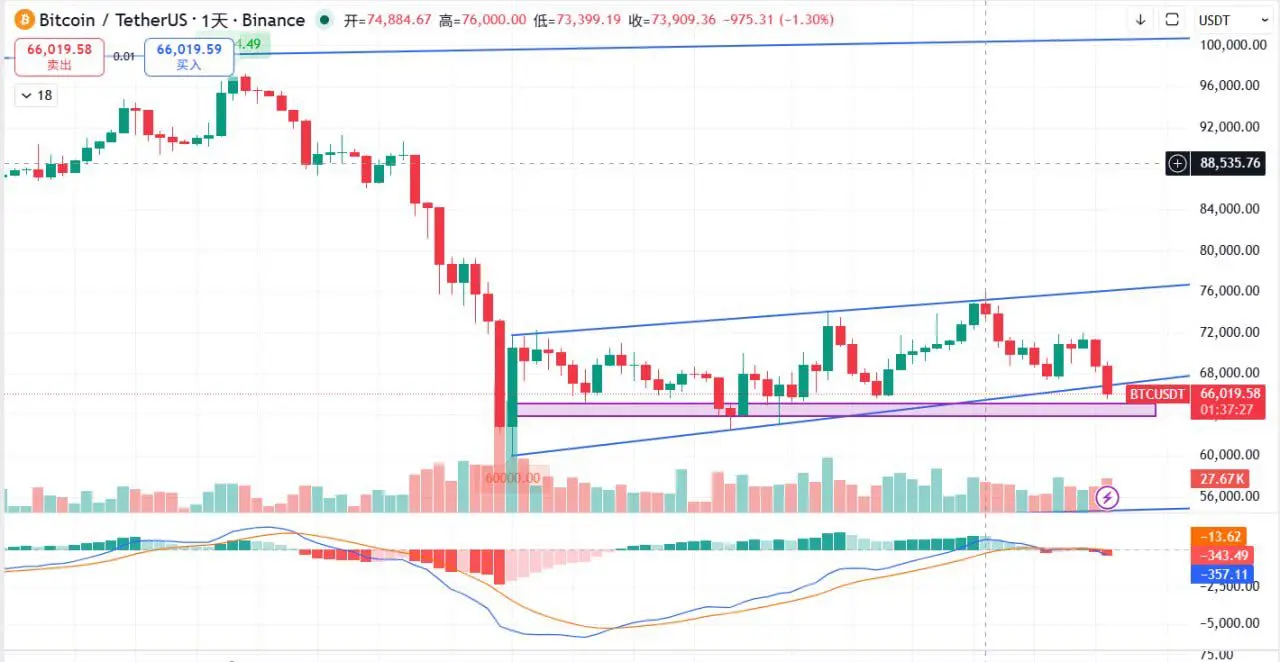
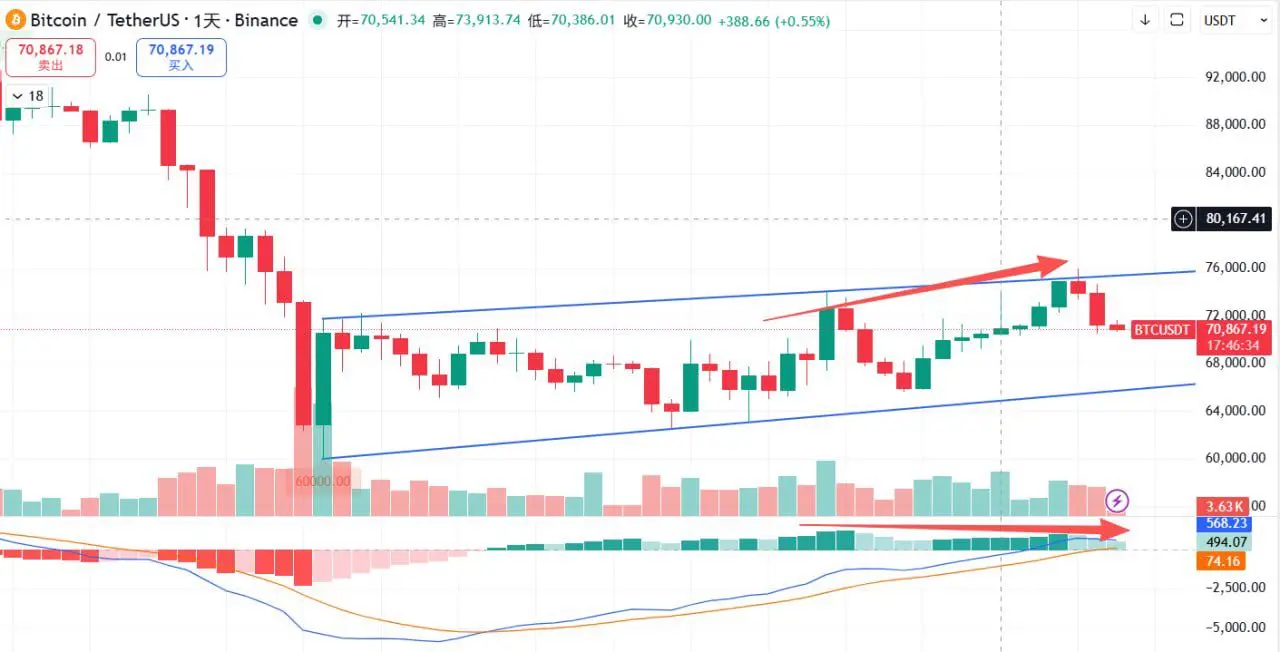
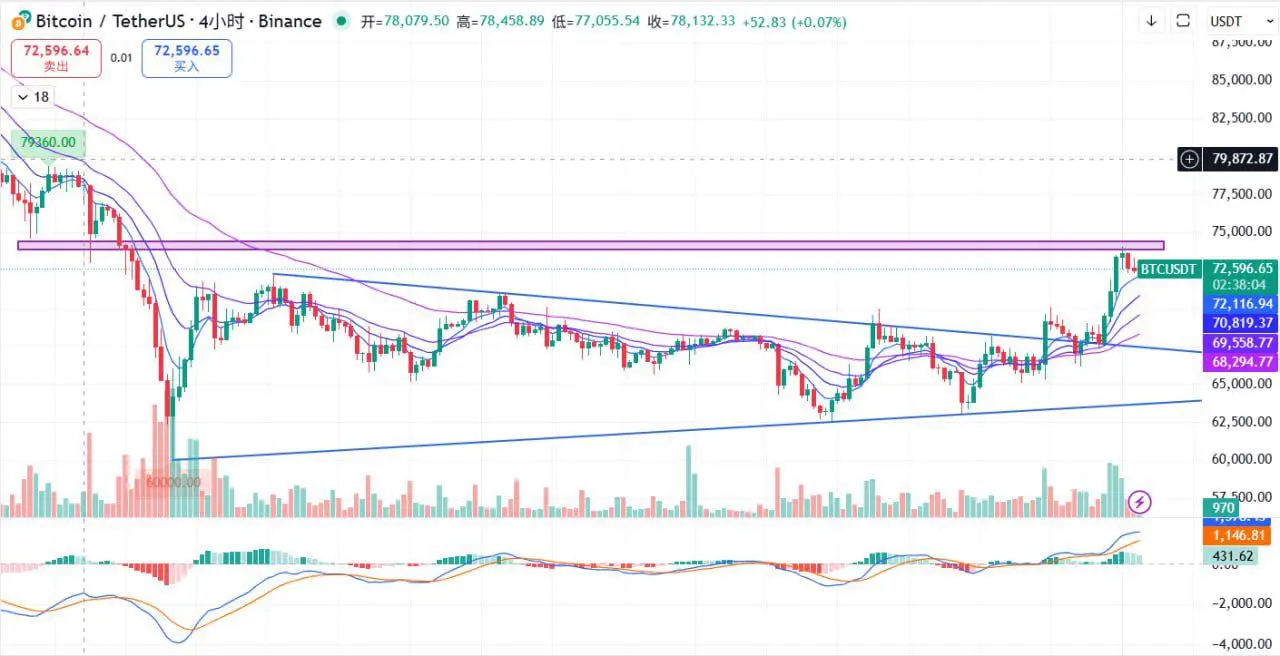
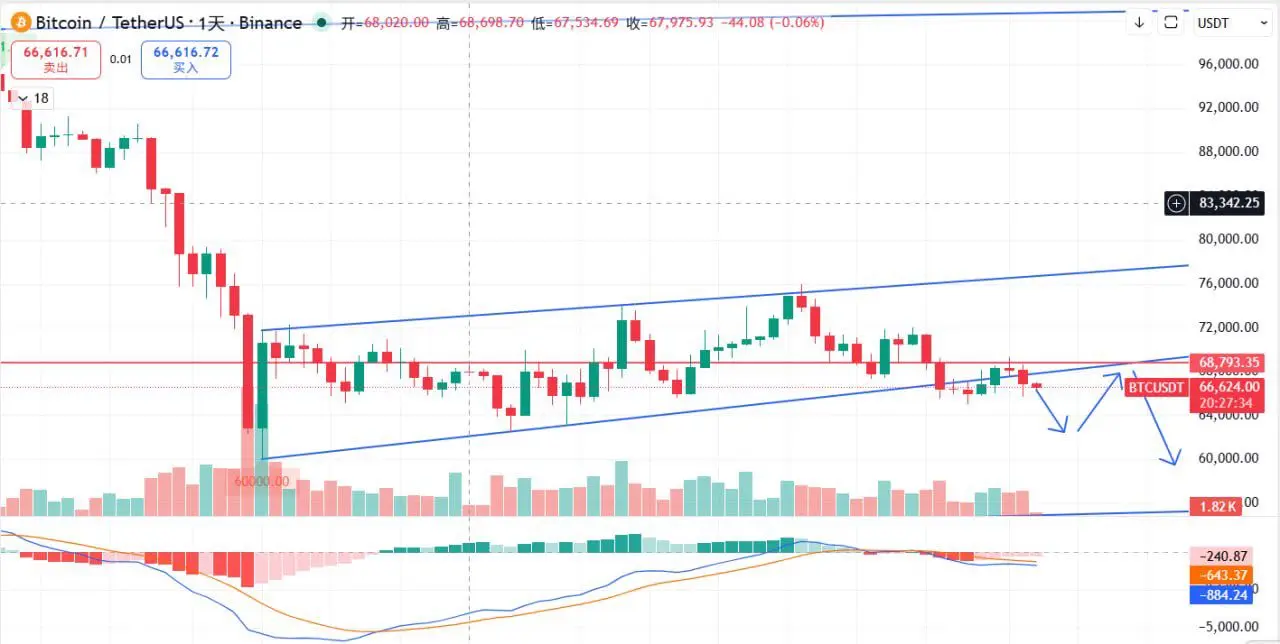
Big Pancake's weekly chart continues to close in the red, with two bullish candles already erasing the previous large bullish candle, indicating a clear bearish trend.
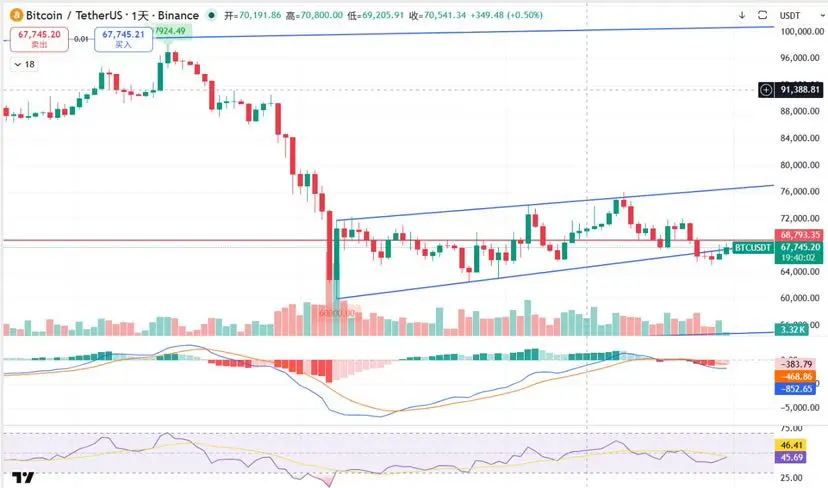
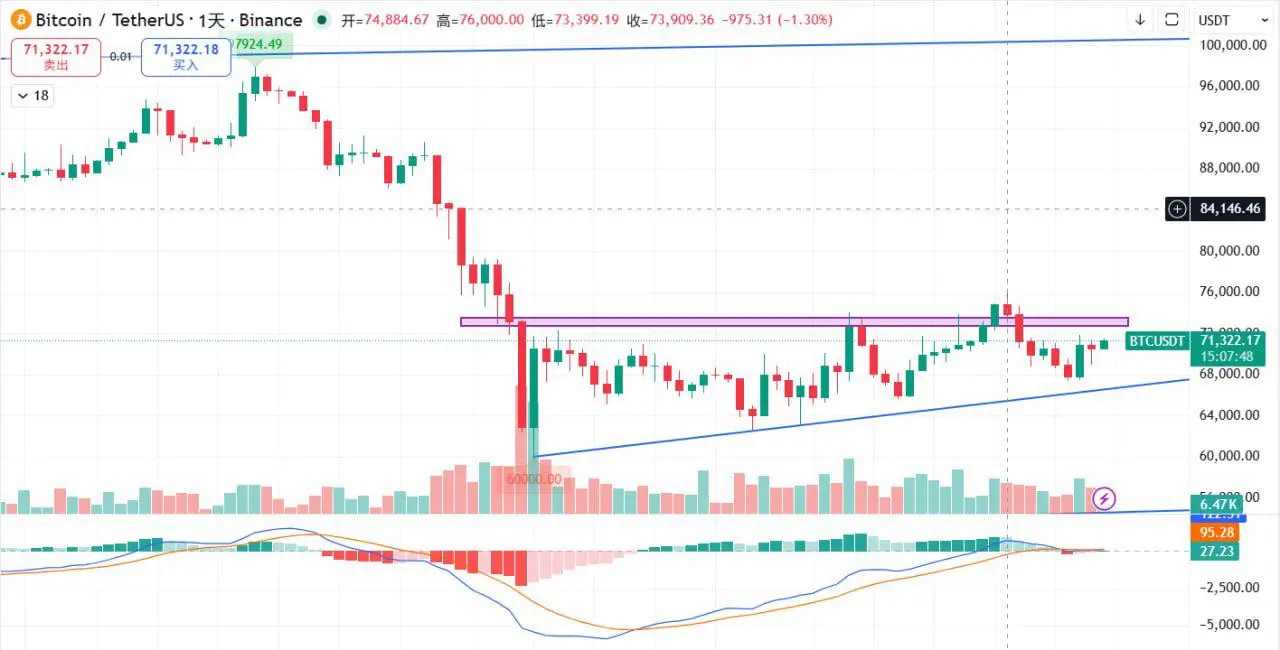
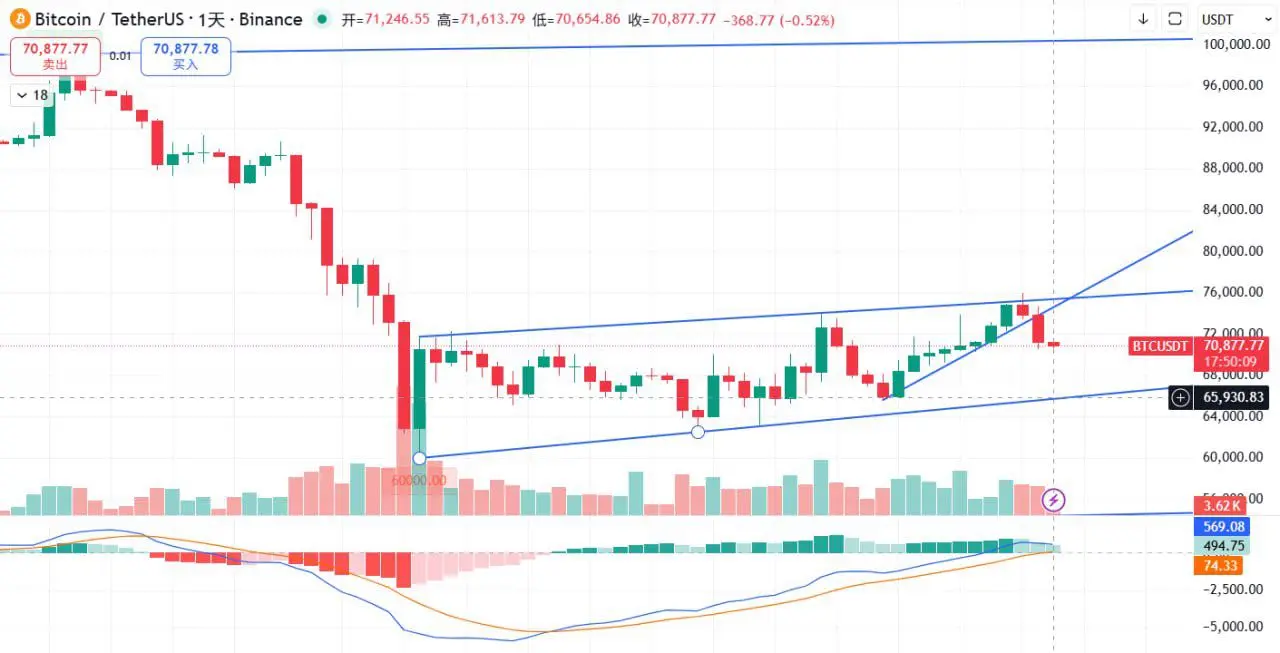
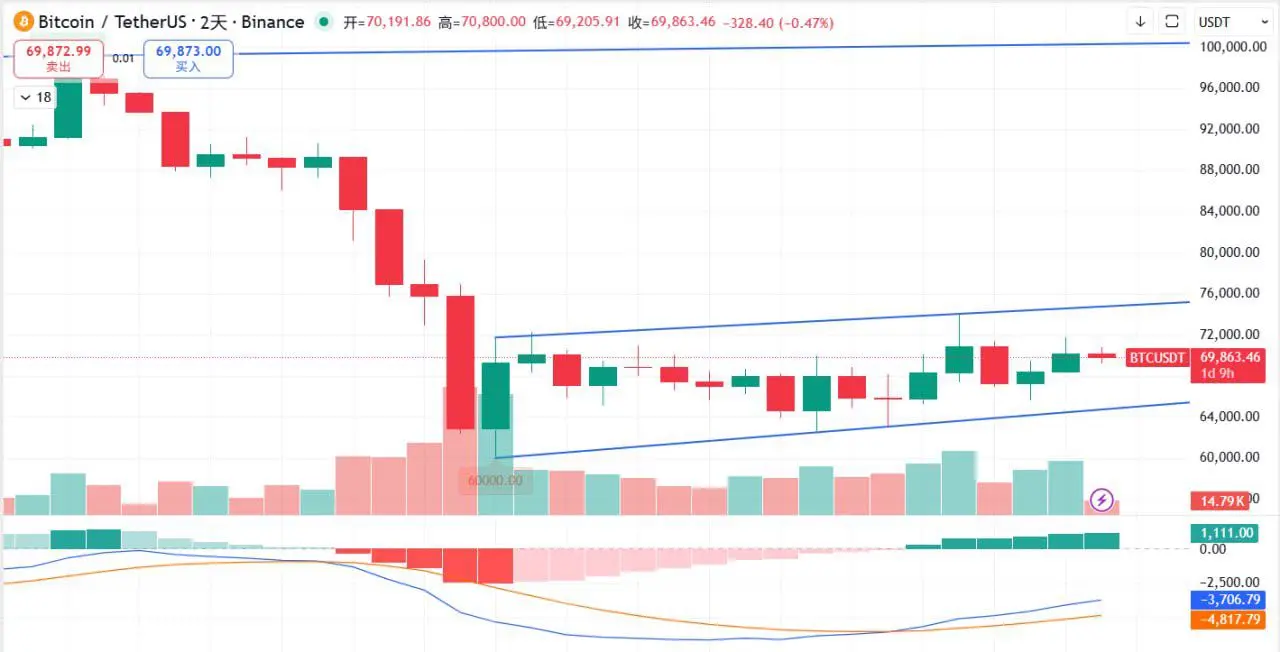
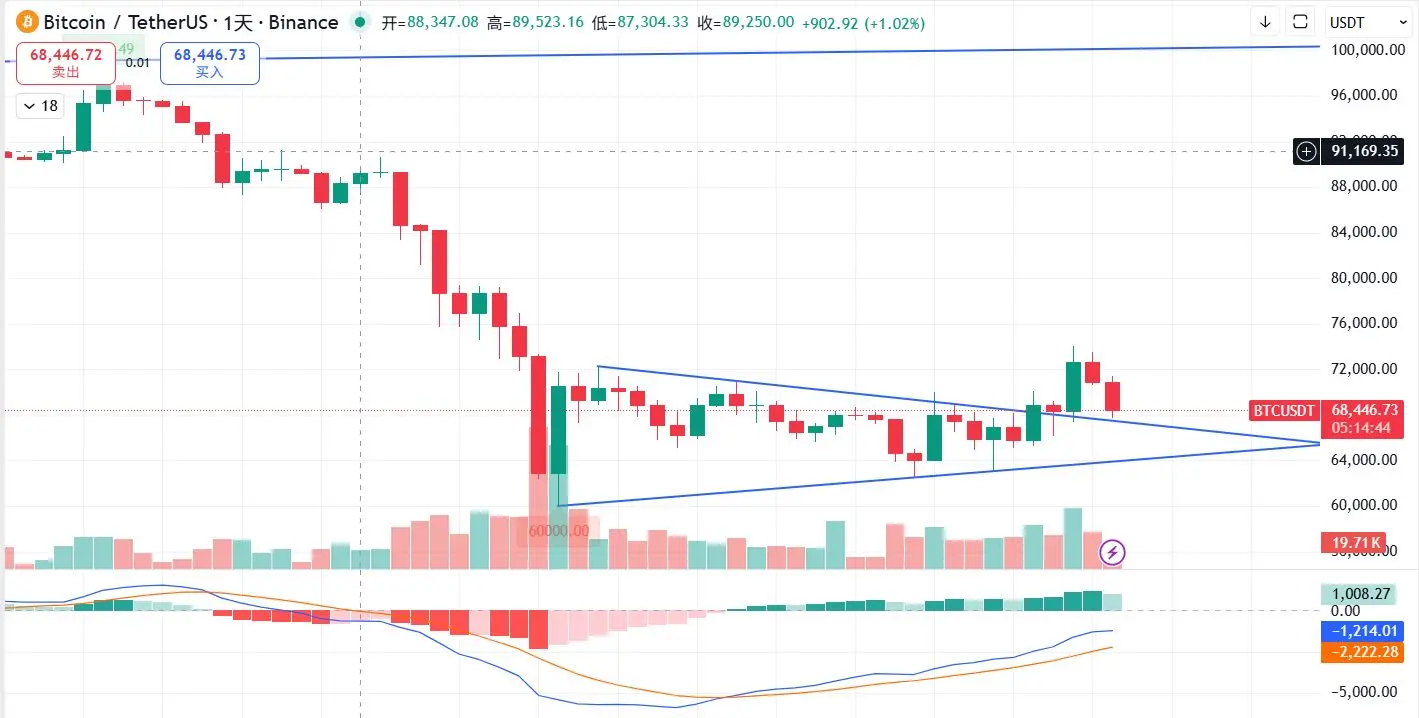
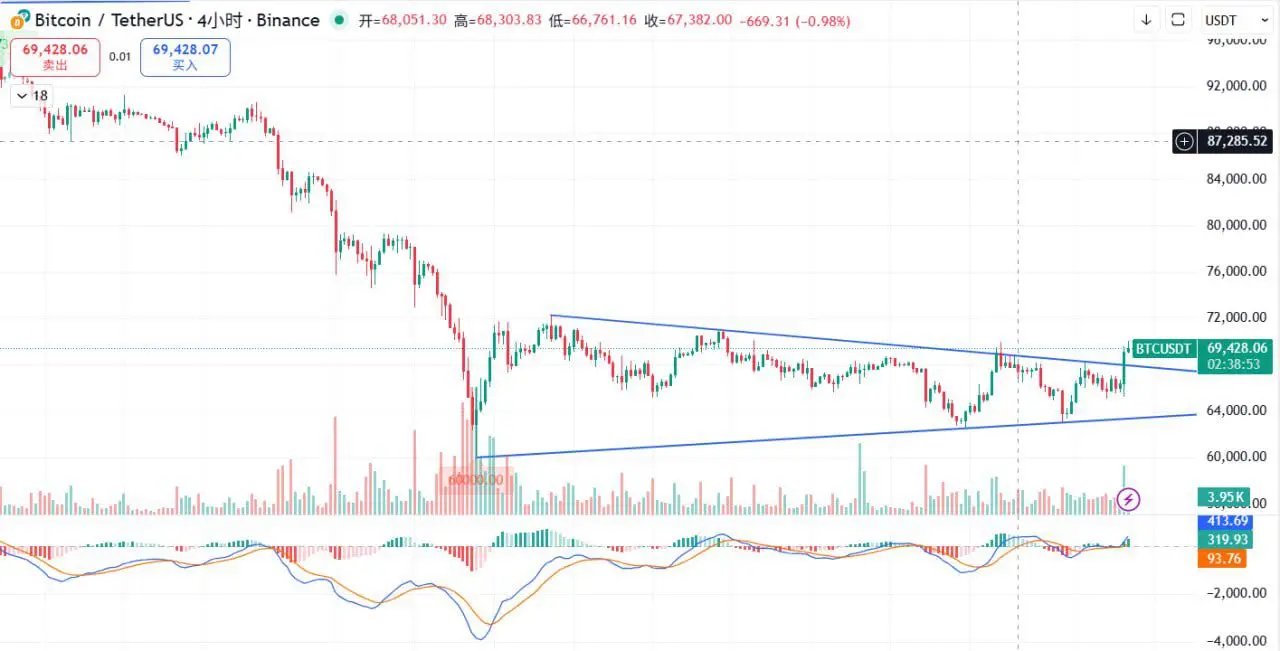
On the daily chart, it has closed below the lower edge of the descending flag pattern for three consecutive days, confirming a breakdown. We previously predicted that after this breakdown, there wouldn't be an immediate waterfall decline; instead, there would be oscillation and a rebound to the lower edge of the pattern, which has been fully validated in recent days. The rebound has already completed, and the daily price has not yet moved back into the channel!
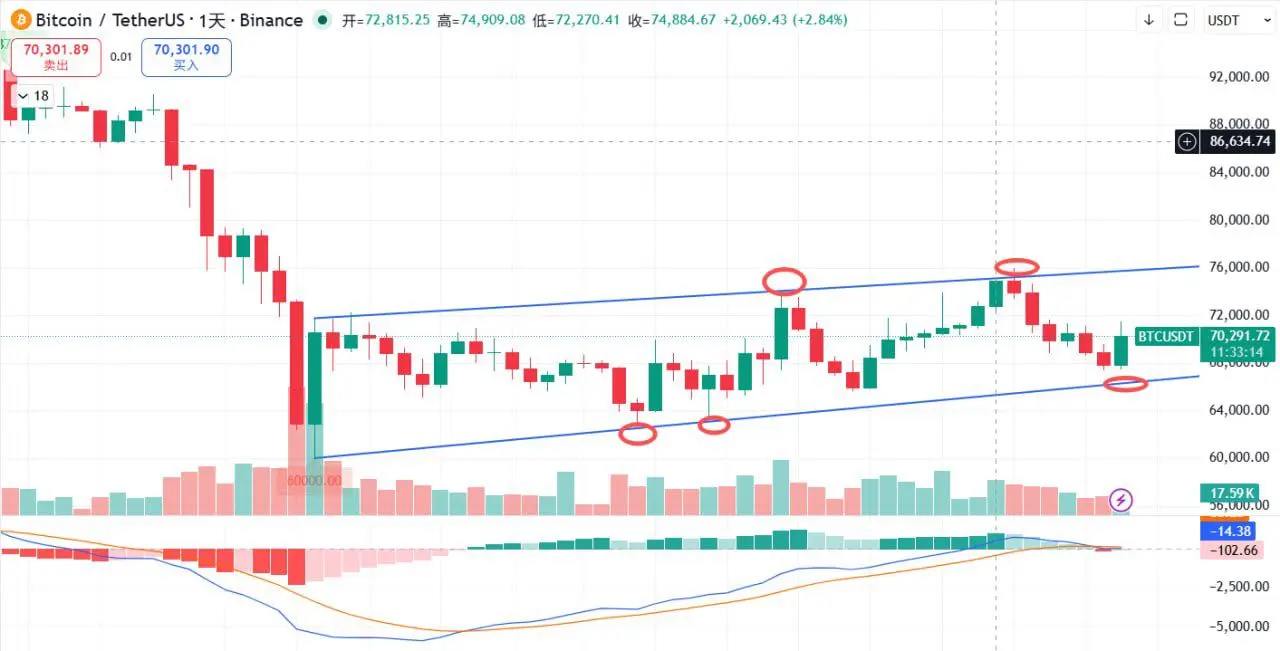
The only variable remains Old T's overly confident mouth—saying whatever he wants. Driven by news, Big Pancake has recently rallied back into the channel, but the overall trend remains unchanged. In my personal view, the daily close still struggles to stay above the channel, or it may be that after three days of upward pinning, the price continues to decline!
The first resistance level above is 68,600, with a major resistance at 72,000.
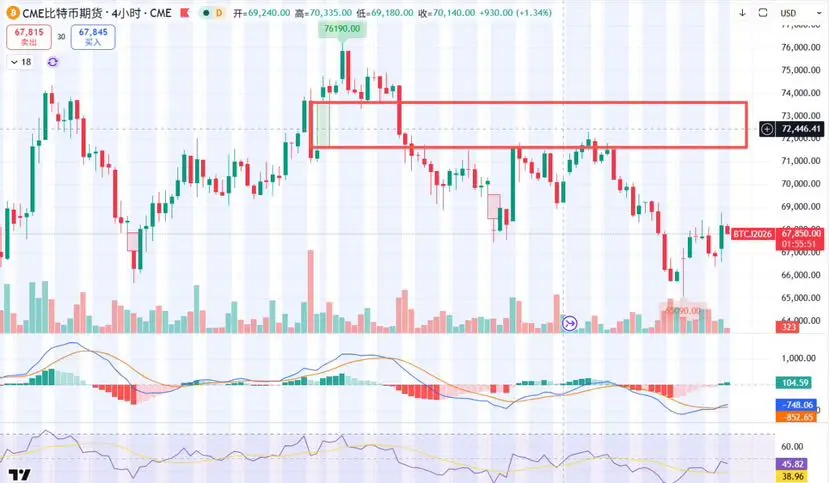
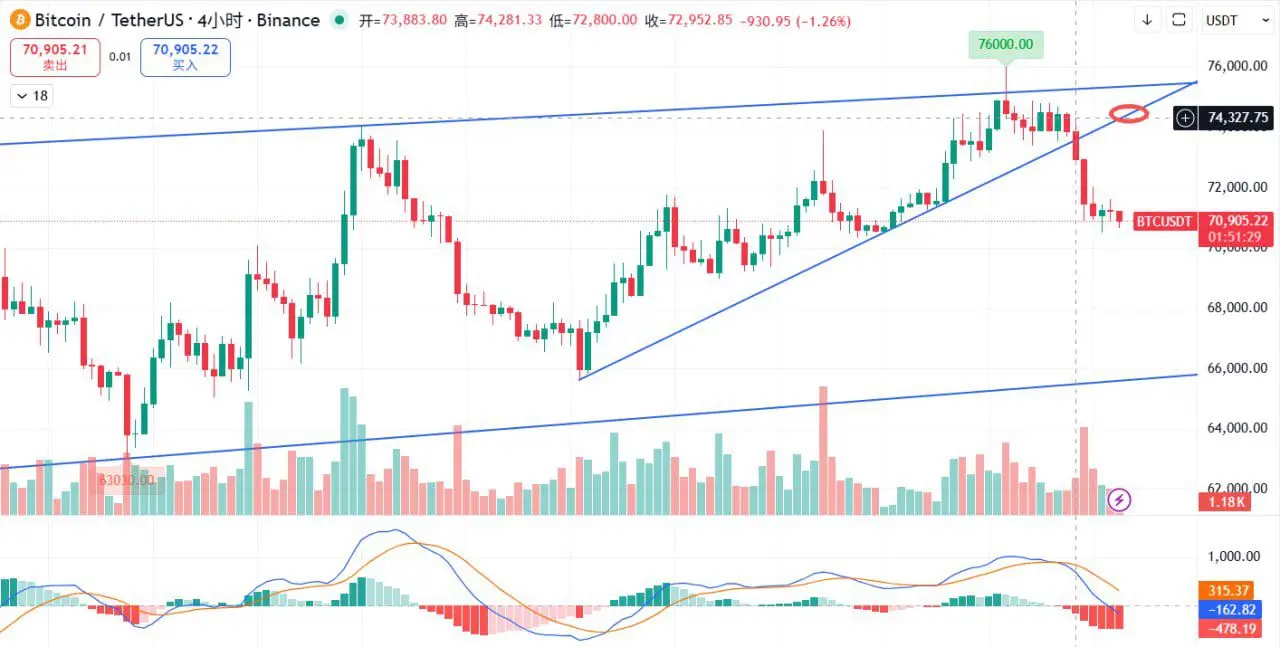
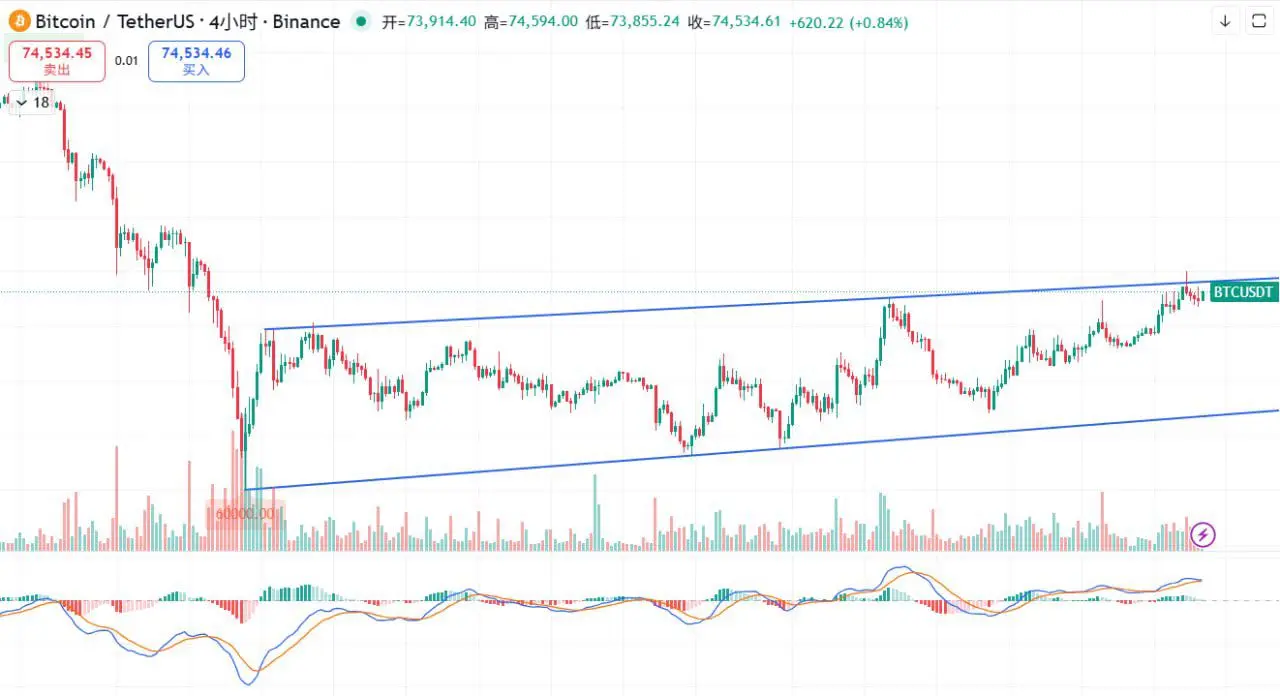
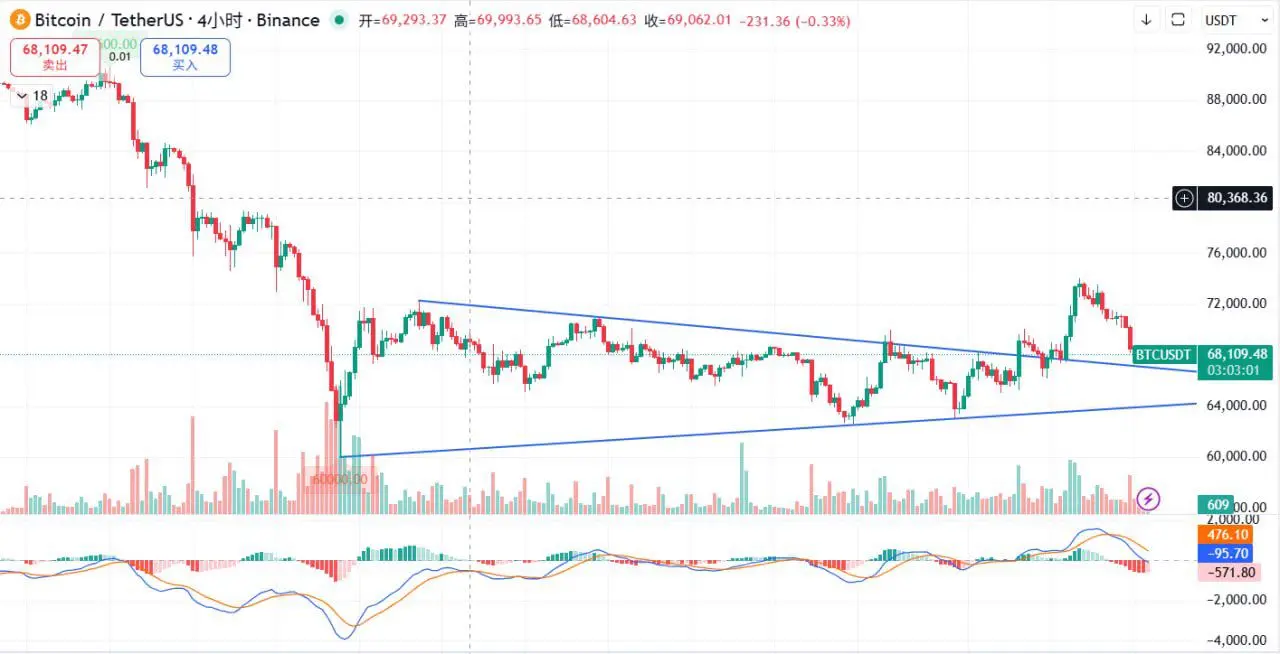
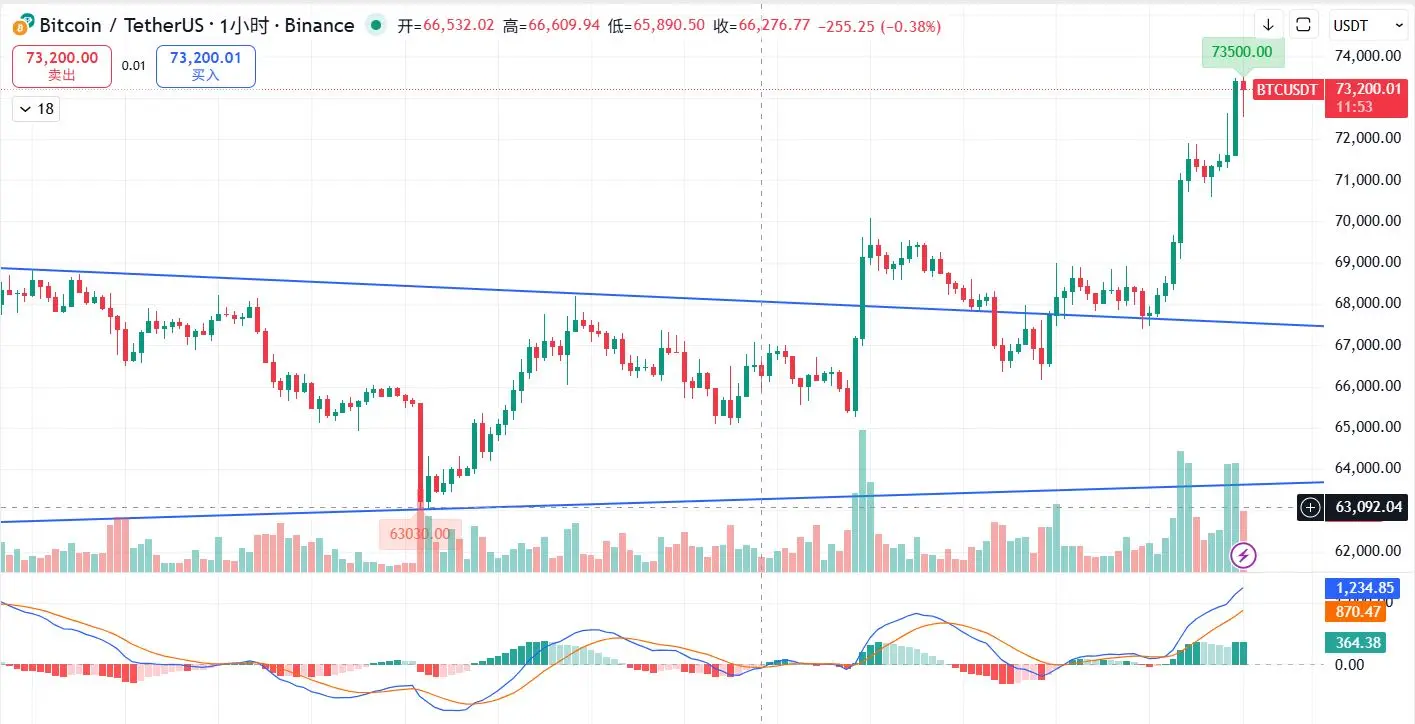
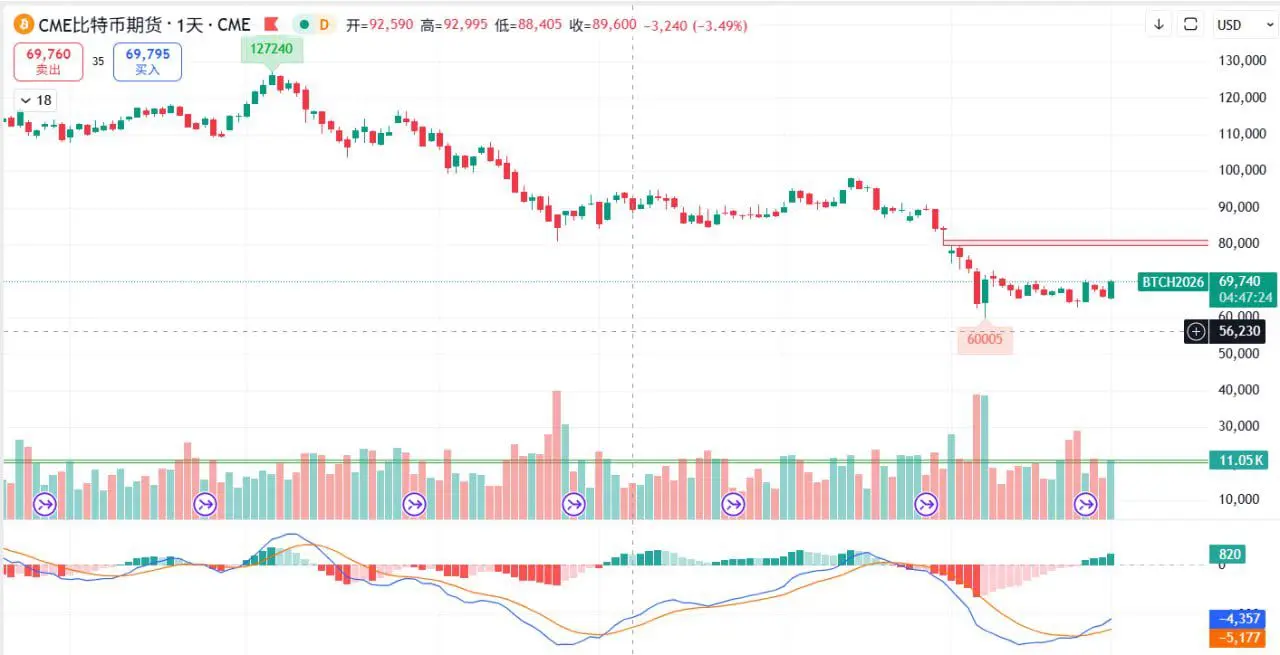
Let's also look at Big Pancake CME 4-hour chart. There is a gap present, roughly between 71,650 and 73,610 (CME values differ from exchange prices). The highest rebound on the 23rd was 71,860. The price entered this gap but did not fill it, indicating clear resistance. This rebound is unlikely to be much different; stopping at this gap is a high-probability event!
Currently, do not blindly chase the rally. Focus on shorting at high levels or observing. The immediate support below remains at 64,000, and the major support is still waiting for a break below 60,000, with an entry opportunity around 58,000 after that!
#特朗普再挺比特币 $BTC #ETH走势分析 $ETH
Big Pancake's weekly chart continues to close in the red, with two bullish candles already erasing the previous large bullish candle, indicating a clear bearish trend.
On the daily chart, it has closed below the lower edge of the descending flag pattern for three consecutive days, confirming a breakdown. We previously predicted that after this breakdown, there wouldn't be an immediate waterfall decline; instead, there would be oscillation and a rebound to the lower edge of the pattern, which has been fully validated in recent days. The rebound has already completed, and the daily price has not yet moved back into the channel!
The only variable remains Old T's overly confident mouth—saying whatever he wants. Driven by news, Big Pancake has recently rallied back into the channel, but the overall trend remains unchanged. In my personal view, the daily close still struggles to stay above the channel, or it may be that after three days of upward pinning, the price continues to decline!
The first resistance level above is 68,600, with a major resistance at 72,000.
Let's also look at Big Pancake CME 4-hour chart. There is a gap present, roughly between 71,650 and 73,610 (CME values differ from exchange prices). The highest rebound on the 23rd was 71,860. The price entered this gap but did not fill it, indicating clear resistance. This rebound is unlikely to be much different; stopping at this gap is a high-probability event!
Currently, do not blindly chase the rally. Focus on shorting at high levels or observing. The immediate support below remains at 64,000, and the major support is still waiting for a break below 60,000, with an entry opportunity around 58,000 after that!
#特朗普再挺比特币 $BTC #ETH走势分析 $ETH