Bitcoin Hits $70K as Analysts Identify Repeatable Friday Night Trading Pattern in Iran Conflict
 Bitcoin surged to a two-week high near $70,000 on March 2, 2026, recovering from weekend lows of $63,100 as markets digested the escalating U.S.-Israel military conflict with Iran now entering its fourth day.
The rebound coincided with broader equity market stabilization, with the Nasdaq Composite recovering from opening losses to climb 0.39 percent, while gold rose 1.3 percent to $5,300 per ounce and silver declined 7 percent to $88. Market analysts have identified a recurring pattern in President Donald Trump’s geopolitical and economic actions, with six major events since mid-2025 occurring on Friday nights after market close, creating a predictable 60-hour trading window from Friday close to Monday open that has produced consistent cross-asset sequences.
Bitcoin Price Action and Market Dynamics
Bitcoin traded at approximately $68,938 as of March 2, representing a 4.4 percent increase over 24 hours, with some platforms briefly showing prices above $70,000 before settling lower. The initial reaction to U.S. and Israeli strikes on Iran saw Bitcoin fall to $63,100 early on March 1, followed by partial recovery throughout the day amid reports of Iranian Supreme Leader Ayatollah Ali Khamenei’s death.
Ethereum rose 3.2 percent to $2,032, while Solana and XRP increased 3.5 percent to $87 and 1.3 percent to $1.39, respectively. The moves occurred as President Trump confirmed from the White House that “large-scale combat operations” continue in Iran, stating that the U.S. military is destroying Iran’s missile capabilities on an hourly basis.
Stephen Coltman, head of macro at 21Shares, noted that markets are attempting to determine whether Iran’s remaining leadership will move quickly to strike a deal with the Trump administration or whether prolonged instability is more likely. Coltman emphasized that inflation expectations are rising in the U.S., potentially making scarce assets like Bitcoin more attractive compared to cash if deposit rates remain below expected inflation.
Friday Night Strike Pattern Identified by Analysts
Financial research firms have documented a consistent pattern in Trump’s geopolitical and economic actions, with six major events since mid-2025 occurring on Friday nights after equity market close and before futures liquidity fully develops. The documented events include strikes on Iranian nuclear sites on June 21, Caribbean drug boat targeting on September 1, a 100 percent tariff threat against China on October 10, Venezuelan airspace closure on November 29, military action in Nigeria on December 25, and the February 28 direct strikes on Iran.
Gracy Chen, CEO at Bitget, observed that Trump’s weekend timing strategy allows markets time to digest information before Wall Street opens, minimizing disorderly shocks. The pattern creates a 60-hour window from Friday close to Monday open that has produced consistent cross-asset sequences across all six events.
The 60-Hour Trading Window: Asset Behavior Patterns
Analysis of the six confirmed events reveals near-identical cross-asset sequences following each Friday night action. At Sunday evening futures open at 6 PM ET, Bitcoin has sold off 5 to 12 percent as it trades as a pure risk asset with equity correlation spiking above 0.8. Ethereum and altcoins have fallen 15 to 25 percent from pre-event levels in the first 48 hours as liquidity exits the most volatile assets first.
S&P 500 futures have gapped down 1.5 to 3 percent. Oil has spiked 5 to 10 percent depending on proximity to energy infrastructure, with Iran-related events producing the sharpest initial moves. The U.S. dollar has caught a strong safe-haven bid, and ten-year Treasury yields have dropped sharply as flight-to-quality demand floods the bond market.
By Monday morning, a partial reversal has begun, with markets pricing a short engagement based on Trump’s well-documented preference for deals over prolonged conflicts. Bitcoin has recovered 40 to 60 percent of its Sunday drawdown, oil has given back 30 to 50 percent of its initial spike, and equity futures have stabilized.
This Monday recovery has proven deceptive in prior cycles. In each previous event, the Monday stabilization has failed, with a second, more sustained leg in the original direction following within 48 to 72 hours as markets acknowledge the conflict will not resolve quickly.
Bond Market as Leading Indicator
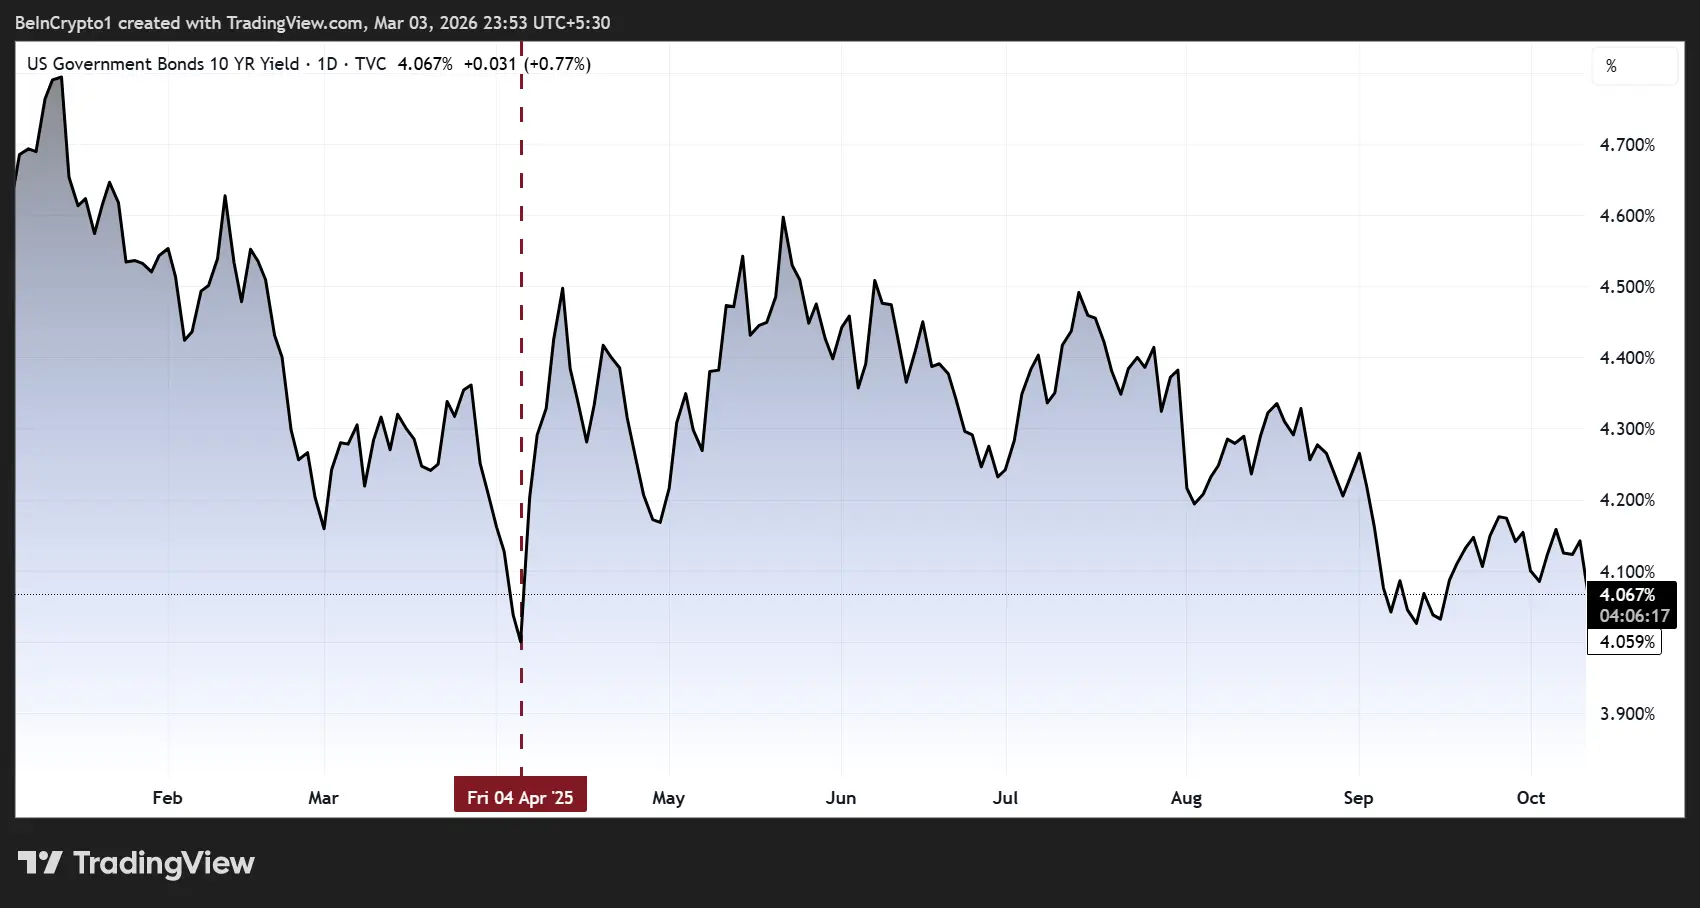
Analysis suggests that the bond market serves as a leading indicator of resolution probability. The April 9, 2025, tariff pause, the most significant de-escalation event of Trump’s second term, was triggered not by equity weakness but by surging ten-year Treasury yields signaling structural stress in fixed income that the administration could not ignore.
 (Source: Trading View)
This dynamic has repeated across multiple cycles. Equity weakness has been bought, and oil spikes have been dismissed as temporary. However, when bond market stress becomes acute, with the ten-year yield moving in ways that imply credit market dysfunction rather than simple flight-to-quality, the probability of de-escalation language has risen sharply.
Traders positioning around the Friday night pattern are therefore monitoring the bond market as a leading indicator of Trump’s next pivot, rather than equity prices or crypto sentiment.
Pattern Durability and Forward Considerations
The Friday night strike pattern has survived six confirmed events across military, tariff, corporate, and geopolitical contexts without breaking. Analysts attribute durability to the underlying logic being structural rather than tactical, reflecting Trump’s three core second-term policy objectives: lowering inflation, cutting gasoline prices, and positioning as a peace president in a midterm election year.
Each Friday night event creates short-term upward pressure on oil and inflation expectations. The Friday night timing may serve as a mechanism to contain that pressure, giving markets a weekend to absorb shock before consumer-facing data can register the move politically.
The pattern is expected to break only if Trump abandons the deal-making framework entirely in favor of genuinely prolonged conflict, or if the Friday night announcement loses its market-timing advantage as participants anticipate and front-run the window. Neither has occurred across 13 months of observation.
As of March 3, with Brent crude above $85 per barrel and the Dow Jones Industrial Average down approximately 1,100 points, markets are in the phase that has historically preceded Trump’s conditional de-escalation signals.
FAQ: Bitcoin and the Friday Night Strike Pattern
How has Bitcoin performed during the Iran conflict weekend?
Bitcoin initially fell to $63,100 on March 1 following news of U.S. and Israeli strikes on Iran, then recovered to test $70,000 by March 2 before settling near $68,938. The asset has traded with heightened volatility but remains within its established $65,000 to $70,000 range, demonstrating resilience amid geopolitical uncertainty.
What is the Friday night strike pattern identified by analysts?
Six major Trump administration geopolitical and economic actions since mid-2025 have occurred on Friday nights after market close. This creates a 60-hour window from Friday close to Monday open that has produced consistent cross-asset sequences: Sunday evening futures shock, Monday partial recovery, followed by a second sustained move in the original direction within 48 to 72 hours.
What role does the bond market play in predicting de-escalation?
Analysis suggests that the bond market serves as a leading indicator of resolution probability. When ten-year Treasury yields surge in ways implying credit market dysfunction rather than simple flight-to-quality, the probability of de-escalation language from the administration has historically risen sharply, as demonstrated by the April 9, 2025 tariff pause triggered by bond market stress.
Related Articles
Bitcoin, Ethereum, XRP Rally as ETF Inflows Hit $458M Amid Strait of Hormuz Crisis
Bitcoin: Real-Time Sentiment Gauge for Weekend Warmongering
Analyst: The implied volatility (IV) of major-term options and expiry options for Bitcoin has not increased.
U.S. Senator Cynthia Lummis, banks will be able to offer digital asset services like Bitcoin