Analyst Says Not Buying Kaspa (KAS) Here Is a “Disservice” – Here’s Why
Analyst Says Not Buying Kaspa (KAS) Here Is a “Disservice” – Here’s WhyTraders are talking more about Kaspa (KAS), but this time it’s not about excitement or noise.
One market watcher said skipping Kaspa at these prices would feel like doing his family a disservice. He’s aiming for $0.23 and pointed out that he was already buying when KRC20 first launched, even near the highs.
Now that the KAS price has cooled off and the project has continued to build, he says he feels even better about it. Right now, KAS is changing hands around $0.0298.
- Here’s What Kaspa Chart Is Showing
- Why the Analyst Is Confident
- What Needs to Happen Next For Kaspa
Here’s What Kaspa Chart Is Showing
Looking at the chart, Kaspa has been in a clear downtrend for months. The KAS price previously peaked much higher before steadily printing lower highs under a descending trendline.
That blue trendline on the chart shows consistent rejection from sellers over time. Every bounce has been capped beneath it.
However, something different is happening now. The KAS price has moved sideways near the $0.029–$0.03 region after a prolonged decline.
Instead of sharply breaking down, price is compressing near recent lows. That often signals exhaustion rather than panic selling. The steep flush lower has already happened. Now the market is trying to find balance.
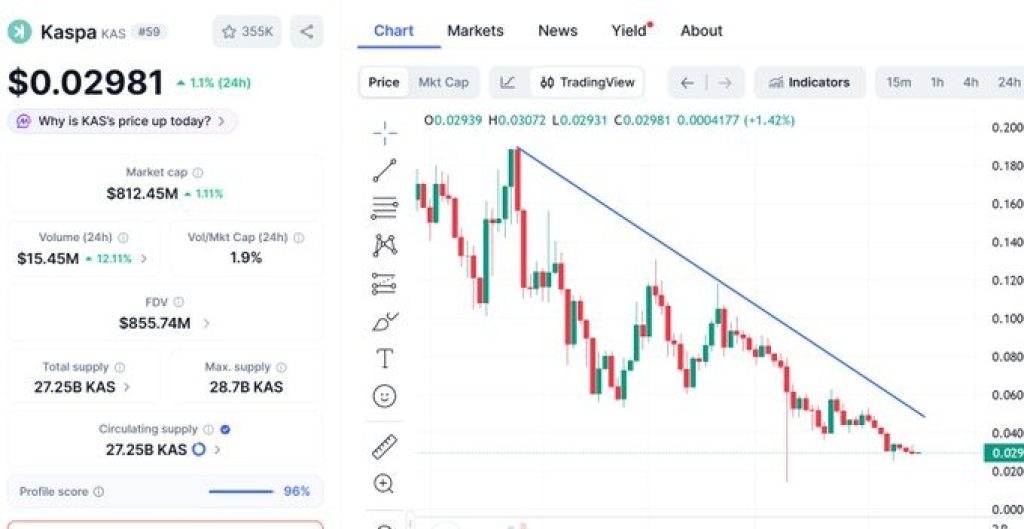
_Source: _****X/Finance Freeman
Why the Analyst Is Confident
The tweet highlights one key point: fundamentals versus price. The analyst spoke about everything about Kaspa as a project is stronger today than it was during previous highs. That’s a common long-term investor thesis, development improves while price pulls back.
The $0.23 target mentioned in the tweet likely refers to a short-to-mid-term technical move. From current levels, that would represent a meaningful bounce if momentum builds. Importantly, the tone isn’t about chasing strength. It’s about accumulation during weakness.
_****XRP Price Prediction: What Happens If Ripple’s $100B Payments Network Expands?**
What Needs to Happen Next For Kaspa
Right now, KAS is sitting under a long-term descending resistance line. For a stronger recovery, price would need to break above that trendline and hold above the $0.035–$0.04 area.
That would shift short-term structure and open the door toward the mid-$0.05 region. On the downside, if $0.029 fails, the next support area comes slightly below near $0.025.
At this stage, the chart shows stabilization, not a confirmed reversal. The analyst’s conviction is based on long-term belief in the project. The KAS chart shows compression after a prolonged drop. Whether that turns into a bounce or another leg lower will likely define the next few weeks.
For now, the Kaspa price is at a decision point, and that’s exactly where long-term buyers usually start paying attention.
Related Articles
ETF Launch Fails to Stem Tide As XRP Sinks to $1.81, Lowest Since April
Here’s Where Gold Price Could Head Next After the $300 Drop
Bitcoin Holds $66,000 as Market Braces for March Rebound
Dogecoin Price Compresses Near $0.10 as Open Interest Drops
NEAR Surges 14.5% — Will a Break Above $1.25 Ignite a Run Toward $3–$4?
Circle CRCL Stock Slips as Clarity Act Deadline Looms