Why did Bitcoin drop today? Increased uncertainty in US-Iran nuclear negotiations, and the $71,000 fake breakout exposed the essence of short squeeze.
Bitcoin surged from $64,000 to around $71,000 in the past 24 hours but was met with significant selling pressure and rejected, then began to decline back to approximately $67,000. This rally was primarily driven by about $500 million in forced short liquidations, with open interest (OI) decreasing sharply, indicating that the market is in a deleveraging phase. Meanwhile, the uncertainty surrounding the third round of US-Iran nuclear negotiations continues to escalate, with the US’s tough stance increasing market risk premiums.
Macro Perspective: US-Iran Nuclear Negotiations Heighten Safe-Haven Pressure
The third indirect US-Iran nuclear negotiations in Geneva, Switzerland, are described as " tense and serious." Iran has shown some flexibility regarding uranium enrichment issues, but significant disagreements remain on core topics.
The Wall Street Journal reports that the US expects to demand Iran dismantle major nuclear facilities at Fordow, Natanz, and Isfahan, and transfer the remaining enriched uranium to the US, insisting that the agreement must be “perpetually valid” and prohibit any form of uranium enrichment activities. Trump also set a “window” from March 1 to 6 for negotiations and warned that if no deal is reached, military action will be considered.
On the military front, the US Navy’s Fifth Fleet headquarters in Bahrain has been reduced to a “critical mission” force of fewer than 100 personnel. This move is interpreted by the market as a preemptive measure before potential military action, similar to the pattern before the June 2025 “Midnight Hammer” operation. The combination of these signals and the ongoing uncertainty in negotiations keeps the market highly alert to risk premiums in the Middle East, further suppressing upside momentum for risk assets.
Technical Analysis: Structural Interpretation of the $71,000 Fake Breakout
 (Source: Trading View)
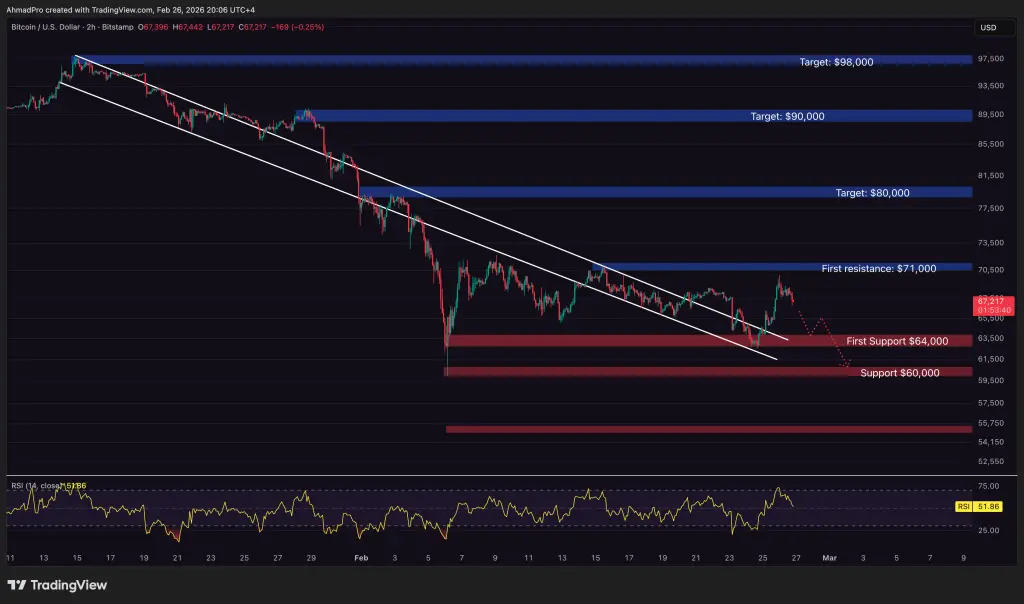
Bitcoin rapidly rose from $64,000 to $71,000, touching the top resistance of the descending channel on the technical chart. After reaching this level, sellers quickly intervened, and the price was sharply rejected, turning what seemed like a strong breakout into a classic false breakout pattern.
Current Key Technical Levels for Bitcoin
$71,000: Top resistance of the descending channel, confirmed as a supply zone with concentrated selling pressure
$65,000–$66,000: Short-term support level for bulls; whether it holds determines the short-term trend
$64,000: Critical support level; a test below this could open the downside space
$60,000: Next major support level after the break of $64,000
Open interest (OI) decreased significantly during the rally, indicating this move was mainly driven by forced short liquidations rather than active bullish buying. Until structural demand effectively recovers, each rebound will face the same selling pressure.
Frequently Asked Questions
Why did Bitcoin fall today?
Bitcoin’s decline today was driven by two main factors: technically, after surging to $71,000 yesterday, it was strongly rejected by selling pressure—this rebound was essentially a false breakout caused by forced short liquidations, lacking structural buying support; macro-wise, the uncertain outlook of the US-Iran third nuclear talks, combined with the US’s tough stance and potential military deployment signals, significantly increased market risk premiums.
Why is $71,000 an important resistance level for Bitcoin?
$71,000 corresponds to the top of Bitcoin’s current descending channel and is a major supply zone technically. When the price reaches this level, forced short covering ends, and active selling resumes, causing the breakout attempt to fail and form a clear false breakout pattern. Unless the price can break above and hold above $71,000, sellers remain dominant in the short term.
What does the decline in OI imply for Bitcoin’s downward trend?
A decrease in open interest (OI) indicates that market leverage is shrinking, reflecting deleveraging rather than new bullish accumulation. In an environment of declining OI, price increases are often driven by forced short liquidations and are typically short-lived. Sustained upward movement requires a substantial increase in spot trading volume to confirm a bullish revival.
Related Articles
Here’s Where Gold Price Could Head Next After the $300 Drop
Analyst Says Not Buying Kaspa (KAS) Here Is a “Disservice” – Here’s Why
Bitcoin Holds $66,000 as Market Braces for March Rebound
Dogecoin Price Compresses Near $0.10 as Open Interest Drops
NEAR Surges 14.5% — Will a Break Above $1.25 Ignite a Run Toward $3–$4?
Circle CRCL Stock Slips as Clarity Act Deadline Looms