Don't guess randomly when bottoming out Bitcoin! "This indicator" has accurately identified the bottom of previous bear markets.
In the cryptocurrency market, “bottom fishing” is an extremely tempting yet highly risky game. If you are also passionate about identifying market turning points, this on-chain indicator that has been validated through multiple bull and bear cycles may become your “North Star” for accurately pinpointing bottoms in a bear market.
This indicator is called “Bitcoin Profit and Loss Supply,” primarily used to measure the overall profit and loss status of coin holders in the market — how many bitcoins are still showing gains on paper, and how many are trapped in unrealized losses.
Historical data repeatedly proves that when the “profit supply” and “loss supply” of Bitcoin tend to balance or even intersect on the chart, it often signals that the bear market bottom has formed, indicating that the market has entered the final stages of “capitulation selling,” and the long-term investment window of opportunity is opening.
For bullish investors hoping for a market rebound, good news may be just around the corner. Data shows that the number of profit chips and loss chips is trending toward a “crossing” point.
According to Glassnode statistics, approximately 11 million bitcoins are currently in profit, meaning their holding costs are below the current market price; meanwhile, about 8.9 million bitcoins are in loss. The gap between the two is narrowing, and if this convergence trend continues, it could replay the bottoming scenarios seen in 2022 and 2018-19.
In Glassnode’s analysis chart, the blue line represents “Profit Supply,” while the red line indicates “Loss Supply.”
When Bitcoin’s spot price fluctuates around the overall cost basis of investors’ holdings, chips will flow between these two camps. By observing the rise and fall of these two lines, we can gain deep insights into the market’s holding structure and the stress test faced by investors.
Looking back at past cycles, the “crossover points” of these two lines have often precisely marked the bear market bottoms:
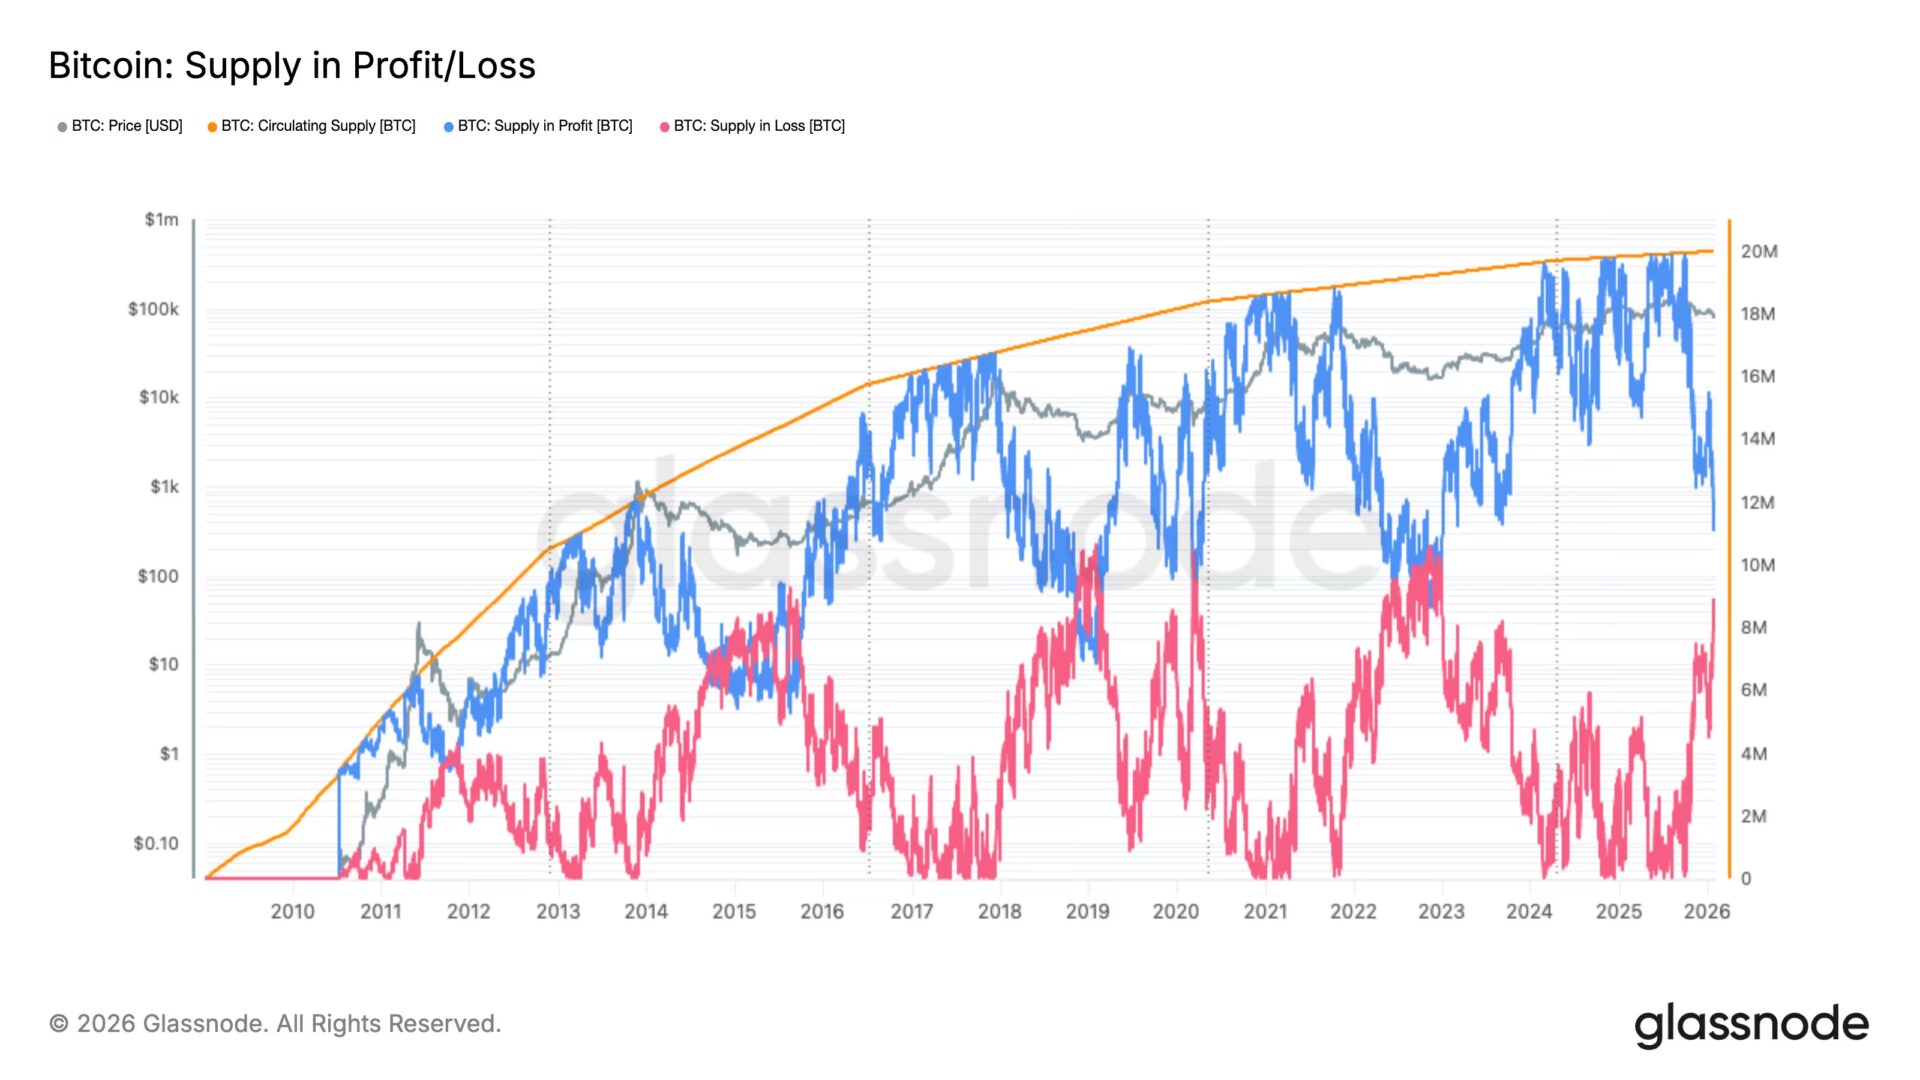
- November 2022: During the panic caused by the collapse of the FTX exchange, Bitcoin dropped to around $15,000, and the indicator showed a crossover, followed by a market bottom and rebound.
- March 2020: The COVID-19 pandemic triggered a global liquidity crisis, causing Bitcoin to briefly fall below $3,000, with the indicator also signaling strongly.
- January 2019: During a prolonged bear winter, Bitcoin fell to around $3,300, and the indicator once again confirmed the bottom.
- 2015: In early market cycles, Bitcoin also exhibited the same structure when trading above $200.
Related Articles
PEPE Slides Within Tight 24H Range — Will Momentum Hold as $0.053891 Caps Gains?
Solana Compresses Beneath $90 After Sharp Range Reclaim
Here’s Where Hedera (HBAR) Price is Headed In March
Bob Loukas Calls Bitcoin 'Horrendous' on Weekly Chart, Sets $49,000 Target - U.Today
ETH short-term increase of 1.52%: USDC large-scale burning and macro hedging sentiment resonate to boost buying interest