Ethereum MVRV drops into capitulation zone! Analysts fiercely debate: is it a bottom or a continued crash?
Ethereum MVRV Z-Score -0.42 enters capitulation zone, analyst opinions divided. Historically lowest in 2018 at -0.76, dropped 30% over two weeks to a low of 1,825. CryptoQuant states it’s signaling capitulation but with less intensity than in 2018/2022. CEX warns that liquidity restrictions during tax season could lead to further declines. Optimists say negative MVRV historically signals explosive recovery, making it the best panic buying opportunity.
MVRV -0.42 vs Historical Low -0.76 Gap
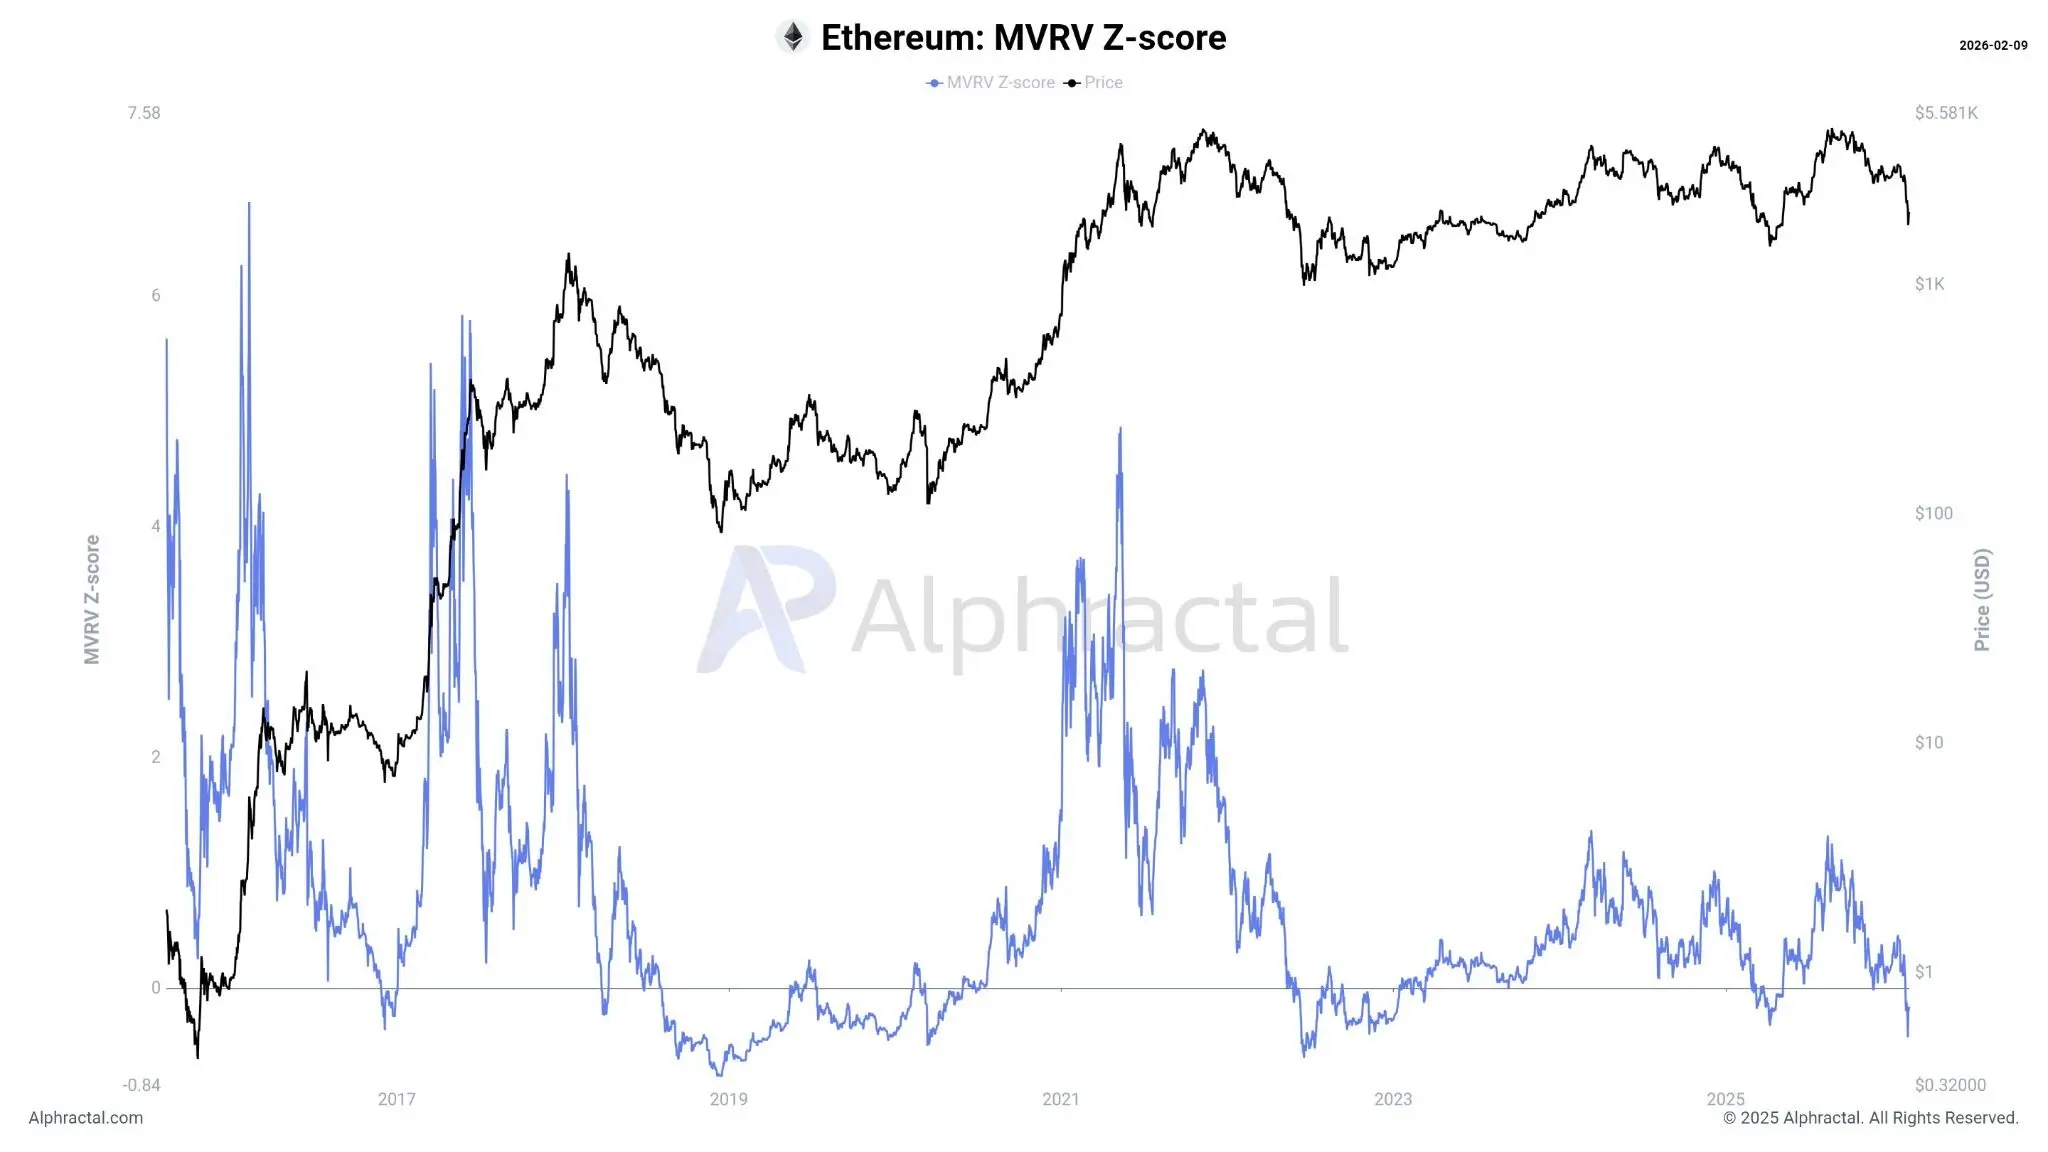
(Source: Alphractal)
The MVRV Z-Score is an indicator used to assess whether a crypto asset is overvalued or undervalued. It compares the market value of the asset to its realized value, which reflects the total value of Ethereum based on its last transaction price. This indicator was created to identify periods of market euphoria or collapse, when market value is far above or below actual value.
CryptoQuant analyst and Alphractal founder and CEO Joao Wedson says the score “indicates that Ethereum is indeed experiencing a clear capitulation process.” In technical analysis, “capitulation” refers to a phase where holders sell at any price out of extreme panic, often marking the formation of a bottom, as all willing sellers have sold and only steadfast holders remain.
However, the analyst notes that these data “cannot be compared to the strength seen at major bottoms in 2018 and 2022.” Wedson states the all-time low was -0.76 in December 2018, when ETH was about $80, down over 94% from $1,400 earlier that year. During the 2022 bear bottom, the MVRV Z-Score also dipped to around -0.65, with ETH at about $880.
The current -0.42, while entering capitulation territory, still has room to reach extreme lows. From -0.42 to -0.76, there’s about 44% “capitulation depth” remaining. If Ethereum follows a similar pattern to 2018, a 44% drop from the current $2,100 would target around $1,176. Although such an extreme scenario isn’t certain, it’s technically possible.
Ethereum MVRV Z-Score Historical Bottoms Comparison
December 2018: -0.76 (price about $80, all-time low)
March 2020: around -0.5 (price about $100, COVID panic)
November 2022: around -0.65 (price about $880, FTX bankruptcy)
February 2026: -0.42 (price $1,825–$2,100, current)
Analysts warn that further declines may occur before any substantial recovery. “The market is already under pressure, but based on historical experience, there’s still room for additional downside before a clear structural bottom forms,” he says. Ethereum’s price fell 30% over the past two weeks, hitting a low of $1,825 on Friday, then rebounding slightly to $2,100 on Monday.
Tax Season Liquidity Constraints and April Curse
CEX senior researcher Tim Sun told Cointelegraph that historically, Ethereum’s MVRV Z-Score “has proven to be a highly reliable indicator for tracking subsequent market changes, especially in identifying bottom regions across multiple cycles.” He added, “From on-chain activity, protocol evolution, and long-term ecosystem structure, Ethereum’s fundamentals have not shown any material deterioration. On the contrary, they continue to improve in several key dimensions.”
But he cautions that as long as the main drivers of the current decline persist, it’s premature to conclude that Ethereum has bottomed out. “Considering the upcoming tax season in April, which could impose liquidity restrictions, further price declines remain a significant risk.”
Tax season’s impact on crypto markets is often overlooked but critically important. US taxpayers must file their 2025 taxes by April 15, and if they have crypto gains, they owe capital gains tax. To raise cash, many investors sell crypto assets in March and April, often triggering corrections in the first quarter. Historically, April has seen notable tax-related sell-offs in 2018, 2021, and 2022. If 2026 repeats this pattern, Ethereum could face renewed selling pressure in March, even if currently in capitulation zone, potentially forcing another bottom test. Such “double bottom” or even “triple bottom” patterns are common in bear markets, with the real bottom often confirmed only after multiple tests.
Optimists: Best Panic Buy Opportunity in History
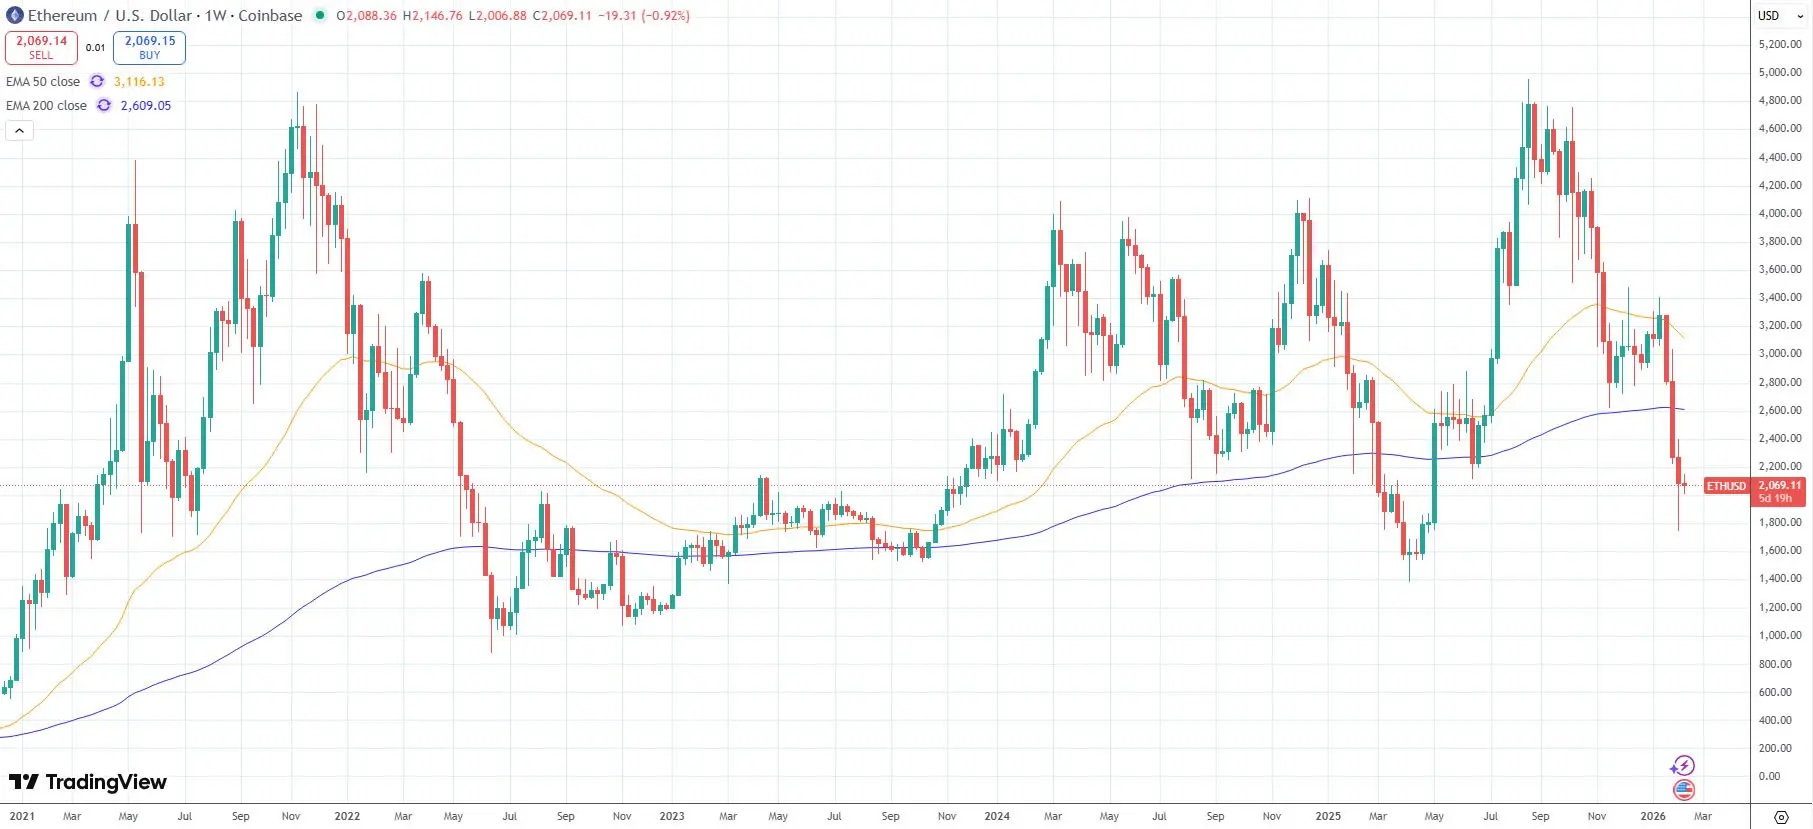
(Source: Trading View)
Other market commentators, like Michaël van de Poppe, founder of MN Fund, are more optimistic. He states, “I see this as a great opportunity to focus on ETH. The main reason is the huge gap between current valuation and ‘fair price,’” referring to the MVRV ratio. Ethereum’s current valuation is as low as during the March 2020 COVID crash, the June 2022 Terra/Luna collapse bottom, and the December 2018 bear bottom. “In all these cases, it was an excellent opportunity to buy that specific asset.”
Bitrue research head Andri Fauzan Adziima told Cointelegraph that negative MVRV zones “have repeatedly shown explosive recoveries in past cycles.” “Given Ethereum’s strong on-chain indicators, once weak hands fully exit, it feels like a prime long-term accumulation opportunity,” he says. “It’s a brutal capitulation now, but historically, it’s one of the best ‘panic buy’ moments for Ethereum.”
This optimistic view relies on mean reversion. When MVRV hits extreme negative levels, history shows it rarely stays there long, typically reverting to normal within weeks or months. This reversion often triggers significant price rebounds, rewarding bottom-fishers. Buying ETH at $80 in December 2018 and holding until the $4,800 high in 2021 yielded a 60x return. Similarly, buying at $100 in March 2020 and selling at the same 2021 high also produced multi-fold gains.
However, the challenge with this “panic buy” strategy is psychological and timing. When markets are extremely fearful, with daily new lows, most people instinctively want to sell rather than buy. Acting contrarily requires deep understanding of fundamentals, strong belief in historical patterns, and psychological resilience to endure short-term losses. Even if one is confident that the bottom is in, pinpointing the exact low is difficult. The bottom formation in 2018 took months, with prices oscillating between $80 and $160.
For ordinary investors, a more prudent approach might be to dollar-cost average in. If you believe Ethereum is undervalued long-term, you can buy in stages at current $2,100, or if it drops to $1,800, or even $1,500, rather than trying to buy all at once at a single price. This strategy doesn’t guarantee catching the absolute bottom but reduces the risk of misjudgment and smooths out the entry price.
Related Articles
Vitalik Buterin is concerned about "Big FOCIL" and encrypted memory pools to prevent centralization in the block construction process.
OTC Whale Sells 23,500 ETH to Repay Loans After Accumulating 163,405 ETH Since January
【Morning Market Brief】 Cryptocurrency market fluctuates... Bitcoin $68,929, Ethereum $2,041
Data: If ETH falls below $1,931, the total long liquidation strength on mainstream CEXs will reach $1.135 billion.