Ethena (ENA) Price is Down 93% From Its High – Here’s What’s Happening on the Chart

Ethena (ENA) has fallen hard. The ENA Price is down about 93% from its peak and now trades near $0.13. After a long slide, ENA is sitting at a part of the chart where traders usually slow down and reassess risk.
Top analyst Crypto Patel shared a chart showing the ENA price moving inside a long descending channel that has been in place since 2024. Price has worked lower in several legs and is now pressing against the lower edge of that structure.
What the Ethena Chart Shows
ENA remains inside a clear downward channel on the higher time frames. Each rally has stalled lower than the last, and each drop has pushed price closer to channel support. That pattern has stayed intact for more than a year.
Right now, the ENA price is testing a demand area near the bottom of the channel. This zone sits around $0.08 to $0.06, where buyers have stepped in before. Patel also points to a longer-term downside level near $0.07, which lines up with past structure on the chart.
As long as price stays above this demand area, the structure allows for a relief move back toward the middle of the channel. A clean break below it would weaken that setup and open the door to deeper losses.
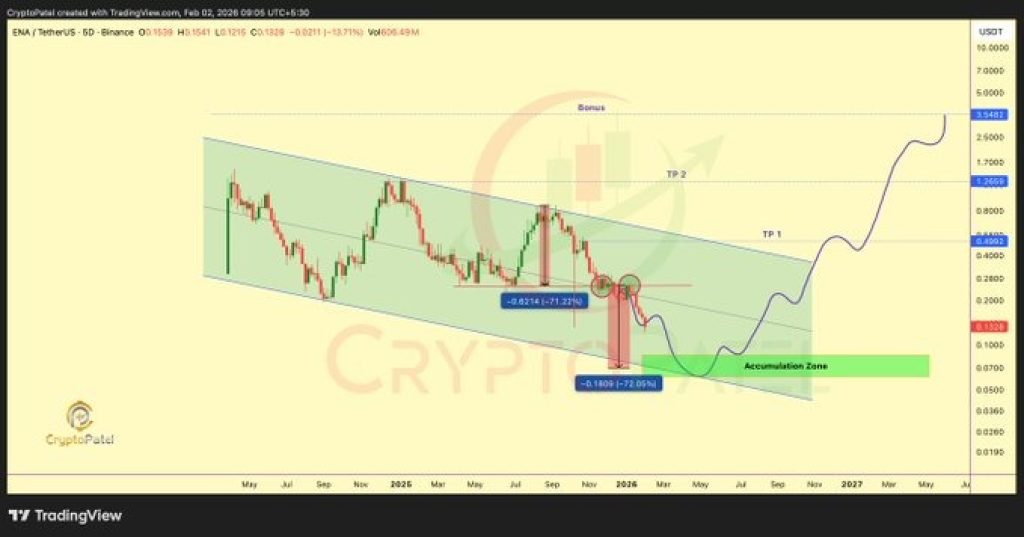
Source: X/CryptoPatel
Why Traders Are Watching This Area
The ENA price is well below the private sale level of $0.40, giving retail buyers a lower entry than early investors. That gap has drawn attention, especially after ENA’s long decline.
The Ethena chart shows signs of basing rather than acceleration lower. Selling pressure has slowed, and price action has tightened near support. This does not confirm a bottom, but it explains why traders are watching closely.
Patel shared upside reference levels at $0.50 and $1.26, with a higher target above $3 if the trend fully turns. These levels assume price can hold support and work its way back through the channel.
_****Cardano (ADA) ETFs Take a Step Forward After SEC Filing Updates**
Beyond the chart, Ethena’s ecosystem has continued to grow. USDe has become one of the largest stablecoins, with supply near $5.8 billion. The project also plans a fee switch that would route protocol revenue to stakers in 2026.
Ethena is also building its own blockchain and preparing an institutional product tied to USDe. These developments help explain why interest remains even after a deep drawdown.
Furthermore, ENA carries clear risks. Token unlocks will continue for years, adding supply pressure. The token remains far below its high, and its model has drawn comparisons to past failures in the sector. Price action also depends on funding conditions and broader market health. If risk appetite fades, the ENA price could revisit lower levels inside the demand zone.
Related Articles
BTC short-term decline of 0.81%: Futures long liquidation wave triggers passive selling and liquidity resonance, intensifying volatility
Breakout Pushes $0.09656 DOGE Above Converging Trendlines as Price Trades Between Key Levels
SOL Slides 11% to $78 After $90 Rejection — Is $76 Support Next?
Geopolitical Fears Drive Crypto Community Chatter to a New Peak
ETH short-term increase of 1.01%: ETF capital net inflow and ecological upgrade expectations resonate to drive a rebound
PEPE Slides Within Tight 24H Range — Will Momentum Hold as $0.053891 Caps Gains?