Technical analysis for January 15: BTC, ETH, XRP, BNB, SOL, DOGE, ADA, XMR, BCH, LINK
After an impressive breakout on Tuesday, Bitcoin (BTC) bulls are increasing efforts to extend the rally and solidify prices above the $97,000 level. Notably, $753.8 million flowed into Bitcoin ETF funds on the same day, according to data from Farside Investors, indicating that this surge is not temporary but backed by strong institutional buying.
Cryptocurrency market sentiment analysis platform Santiment stated in a post on X that if BTC begins to “test the $100,000 mark in the next few days,” a FOMO wave from retail investors is likely to emerge, further fueling the upward trend.
From a more optimistic perspective, analyst Midas believes that Bitcoin’s current price structure is repeating the 2020–2021 cycle. If this historical scenario repeats, BTC could potentially reach the $150,000 mark.
However, the market still holds cautious views. In the Q1/2026 Outlook report, global investment management firm VanEck suggests that Bitcoin’s familiar four-year cycle was broken in 2025, supporting a more cautious approach in the short term, about 3–6 months ahead. Nevertheless, some VanEck analysts remain positive, continuing to see strong potential in the current cycle.
So, what are the key price levels to watch for Bitcoin and major altcoins? Let’s analyze the charts of the top 10 cryptocurrencies to find out.
Technical Analysis of BTC
Bitcoin broke through the important resistance level of $94,789 on Tuesday, but the rally is currently stalling due to profit-taking pressure around $96,846.
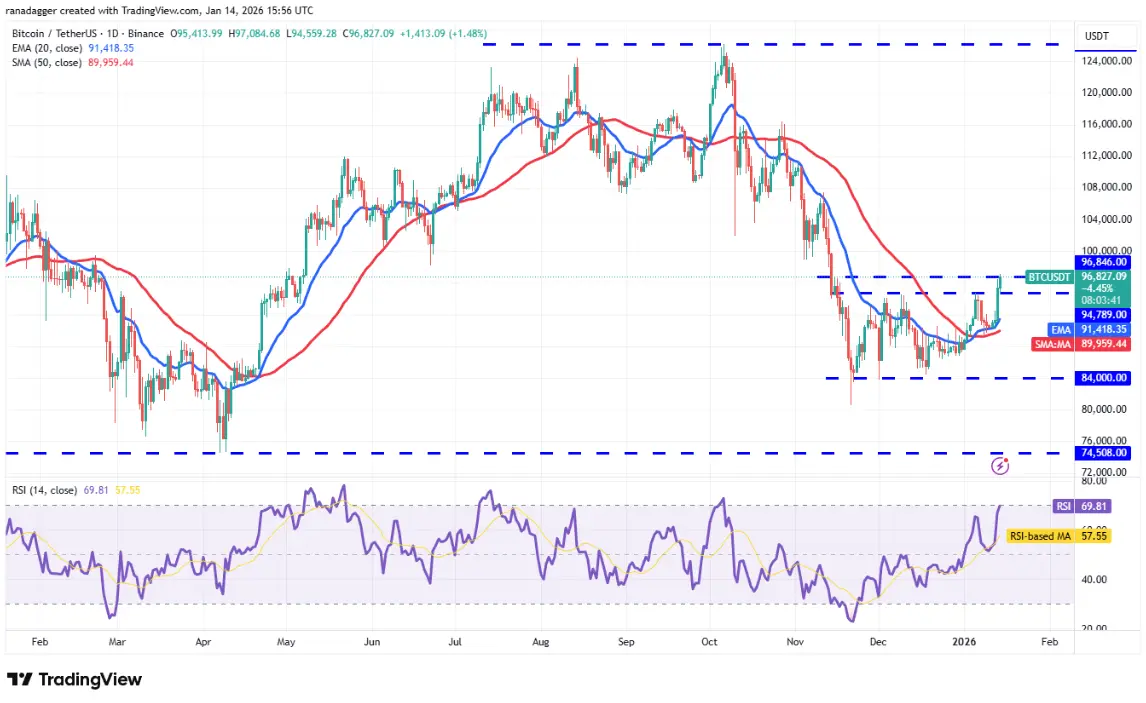 Daily BTC/USDT chart | Source: TradingViewThe 20-day exponential moving average (EMA) trending upward, combined with the RSI approaching overbought territory, indicates that the advantage still favors the bulls. If Bitcoin closes firmly above $96,848, the market could see a new acceleration toward the psychological $100,000 mark, aiming for a higher target zone around $107,500.
In a correction scenario, $94,789 acts as the nearest support zone, followed by the 20-day EMA. To reverse the current trend, the bears need to push the price below the 50-day simple moving average (SMA) at $89,959, which would significantly weaken the bullish momentum dominating the market.
Technical Analysis of ETH
Ether broke out of the symmetrical triangle resistance on Tuesday, indicating that bulls have overtaken bears.
 Daily ETH/USDT chart | Source: TradingViewBears will attempt to pull the price back inside the triangle, but if the bulls successfully defend this resistance, ETH/USDT could rise to $3,659 and then to $4,000.
Conversely, if the price slips back inside the triangle, ETH is likely to find support at the moving averages. If the price bounces from here, bulls will continue their efforts to resume the uptrend. However, bears will regain control if the price closes below the support level.
Technical Analysis of XRP
XRP bounced from the moving averages on Tuesday, showing strong buying demand at lower levels.
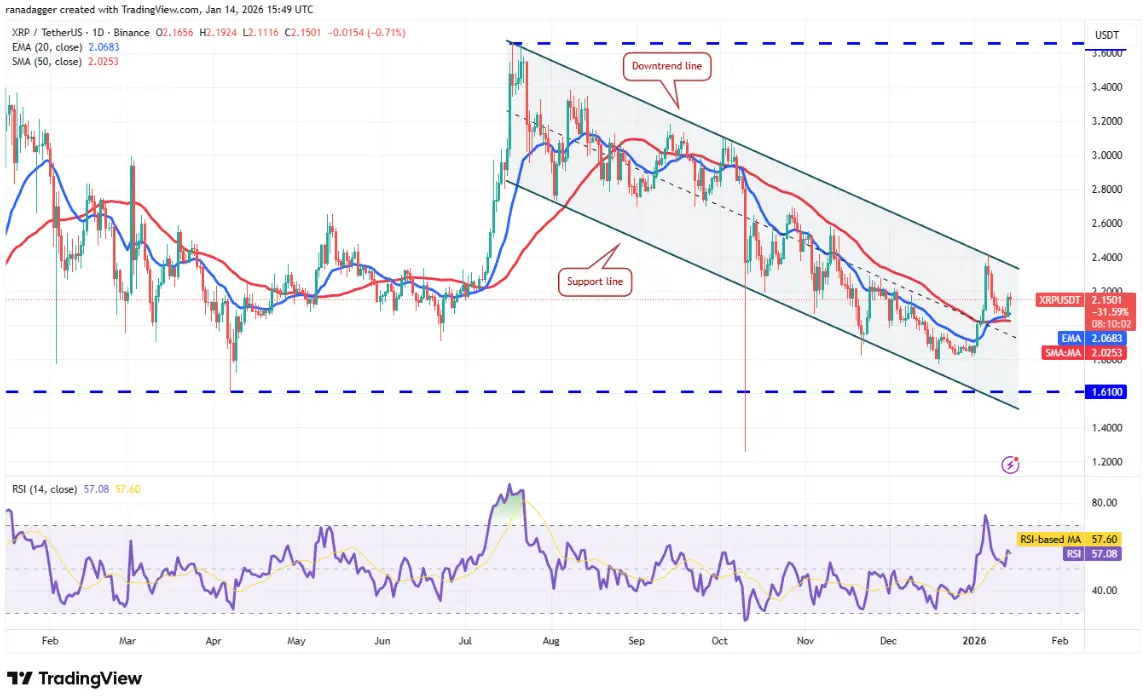 Daily XRP/USDT chart | Source: TradingViewThe 20-day EMA (2.06 USD) slopes upward along with RSI in positive territory, indicating that bulls are in control. This increases the likelihood of a breakout above the downtrend line, signaling a potential trend reversal. In that case, XRP/USDT could rise to $2.70.
This bullish scenario will be invalidated in the short term if XRP’s price reverses and breaks below the moving averages, suggesting the pair may continue to oscillate within the downtrend channel for a while longer.
Technical Analysis of BNB
BNB closed above $928 on Tuesday, completing an ascending triangle pattern.
 Daily BNB/USDT chart | Source: TradingViewBears will try to “trap” chasing investors by pushing BNB below the moving averages. If successful, BNB/USDT could decline to the upward trendline and continue down to the $790 zone.
Conversely, if the price rebounds from $928, it indicates that bulls have turned this level into support. In that case, BNB has a higher chance of reaching the target of the pattern at $1,066.
Technical Analysis of SOL
Solana hit $147 on Tuesday, a level where bears are expected to create strong resistance.
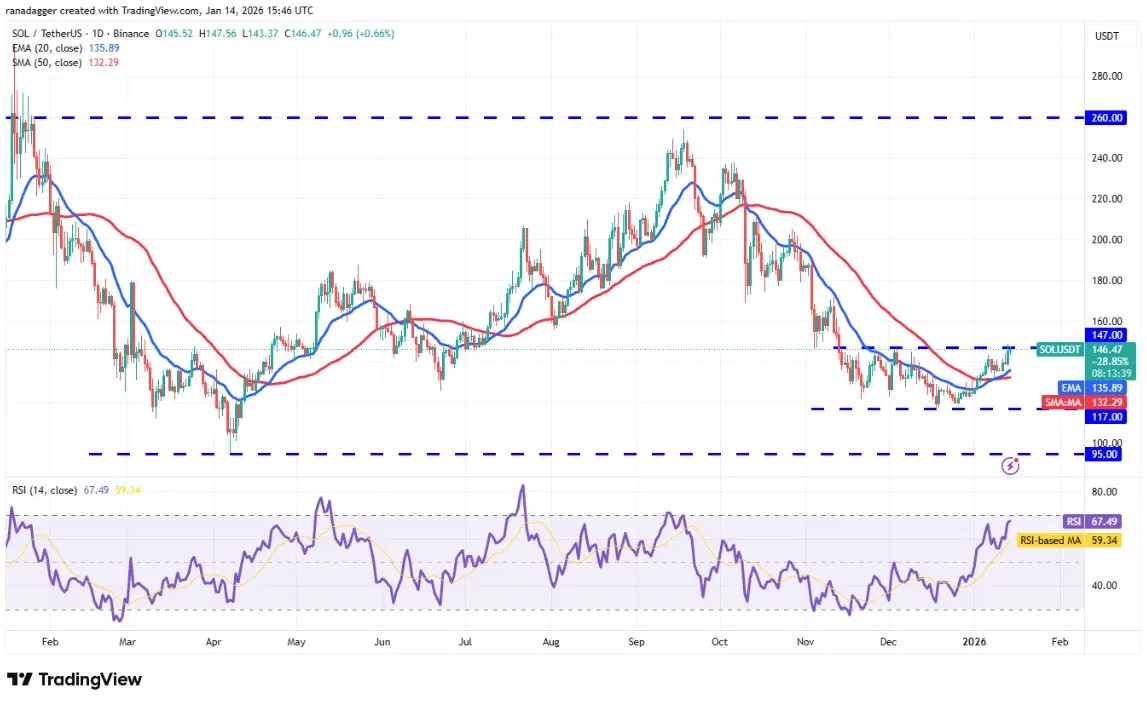 Daily SOL/USDT chart | Source: TradingViewThe 20-day EMA (135 USD) slopes upward along with RSI near overbought levels, indicating the main trend remains upward. If bulls break above $147, SOL/USDT could accelerate and reach $172.
On the downside, the moving averages serve as important support zones. If the price breaks below these levels, it suggests that bulls have lost their advantage, and Solana could continue to fluctuate within the $117–$147 range for a few more days.
Technical Analysis of DOGE
Dogecoin rebounded from the moving averages on Tuesday, showing that bulls are trying to regain control.
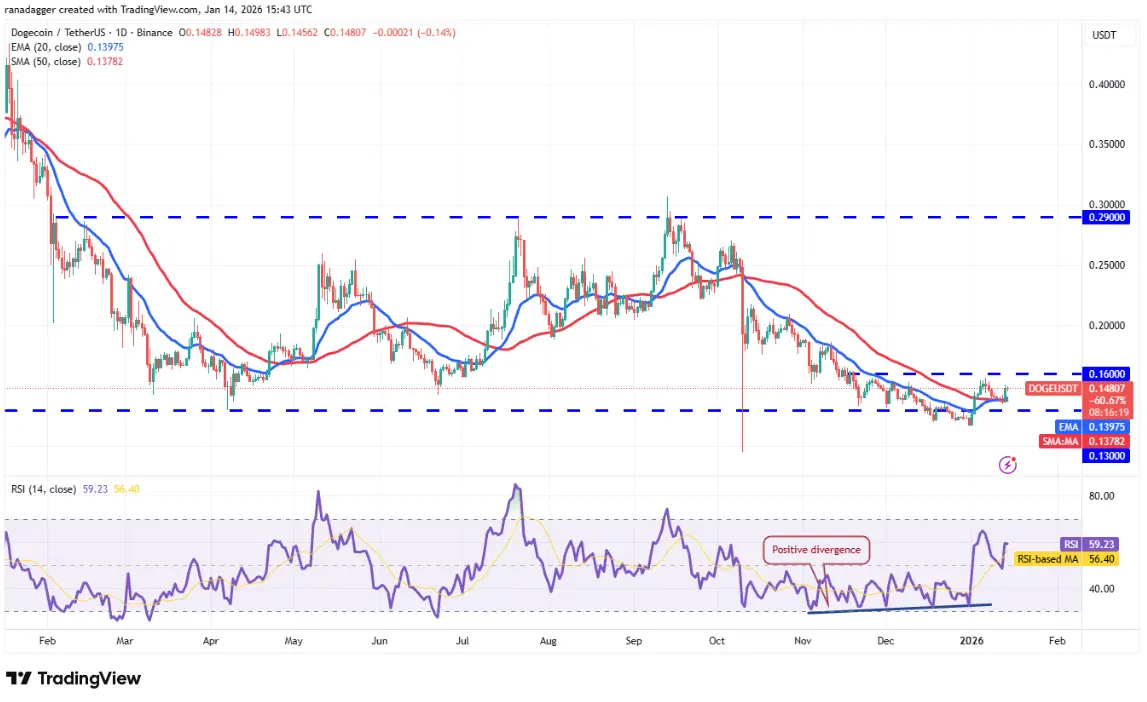 Daily DOGE/USDT chart | Source: TradingViewIf bulls push the price above the resistance of $0.16, DOGE/USDT will complete a bullish inverse head and shoulders pattern. This could send Dogecoin’s price toward the $0.20 target.
Conversely, if the price sharply reverses from $0.16, it indicates that bears are still selling on rallies, and the pair may continue to trade sideways within the $0.12–$0.16 range for some time.
Technical Analysis of ADA
Bulls successfully defended Cardano’s (0.39 USD) 20-day EMA, indicating positive market sentiment.
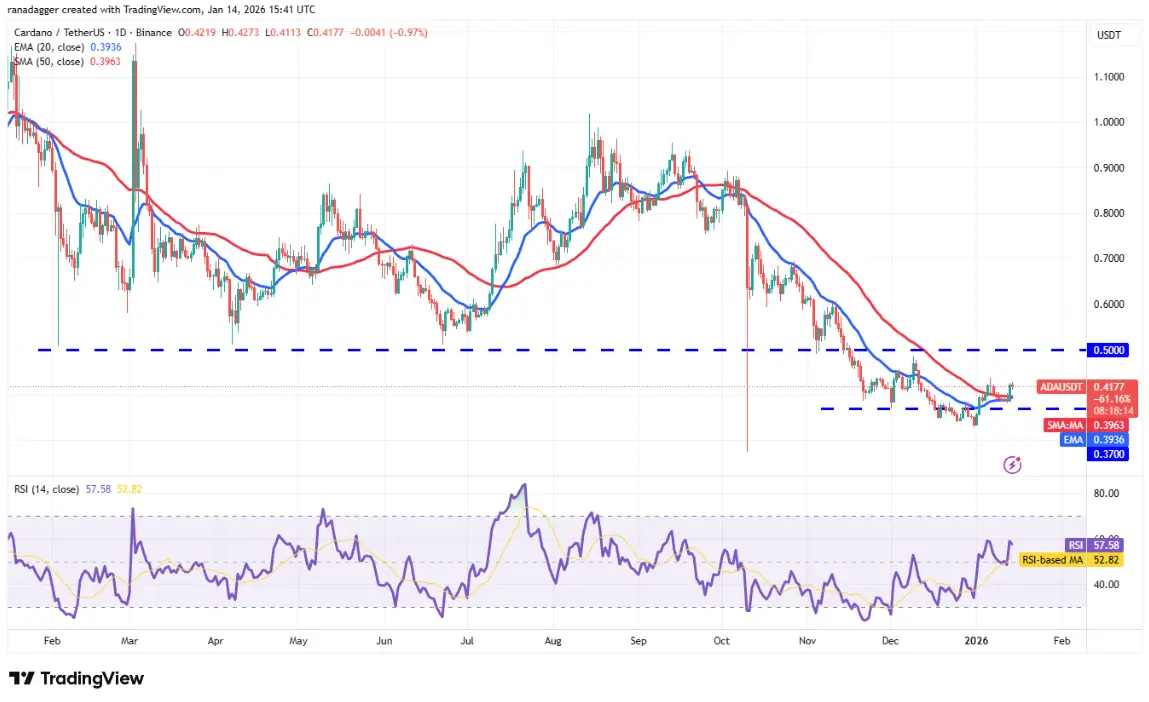 Daily ADA/USDT chart | Source: TradingViewA minor resistance is at $0.44, but if this level is crossed, ADA/USDT could rise to the previous breakout zone at $0.50. The recovery momentum is likely to face strong selling pressure around $0.50; however, if bulls dominate, Cardano could continue climbing to $0.60. Such a move would signal a potential short-term trend reversal.
On the other hand, bears will need to quickly push the price below the moving averages to maintain their advantage. If successful, the pair could slide back to around $0.33.
Technical Analysis of XMR
Monero (XMR) surged after bouncing from the 20-day EMA (510 USD) on Saturday, showing strong buying pressure from bulls.
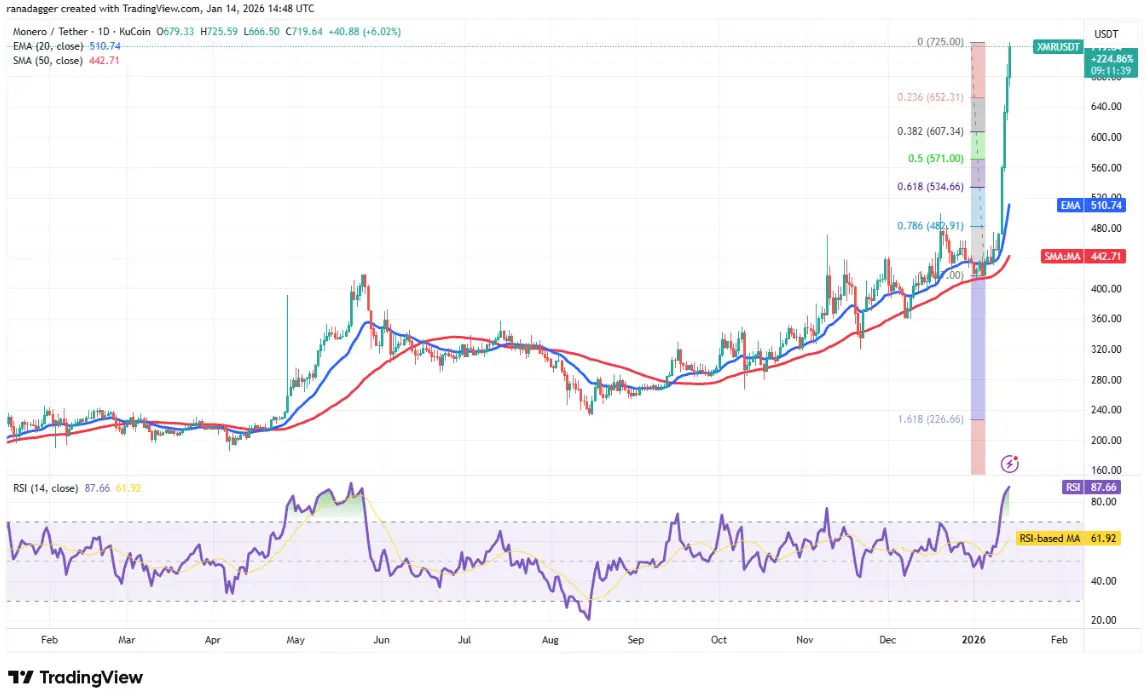 Daily XMR/USDT chart | Source: TradingViewThe sharp rally pushed RSI above 87, indicating that XMR/USDT is in an overbought state in the short term. This could lead to sideways movement or a correction in the coming days.
Any correction is expected to find support at the 38.2% Fibonacci retracement level around $607. A shallow correction would increase the likelihood of the uptrend continuing, with Monero’s price breaking out strongly toward $915. The bullish momentum is forecasted to weaken if the price closes below the 50% Fibonacci retracement at $571.
Technical Analysis of BCH
Bitcoin Cash (BCH) is trying to find support at the moving averages, but bears are continuously exerting pressure.
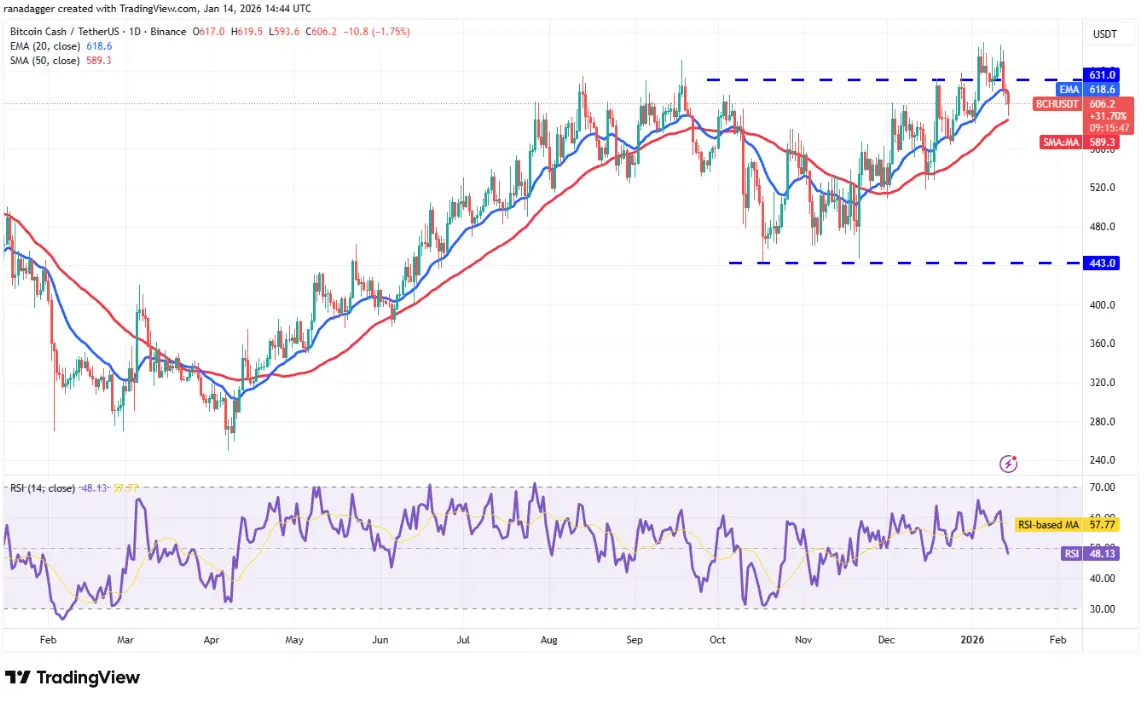 Daily BCH/USDT chart | Source: TradingViewBreaking below and closing under the 50-day SMA (589 USD) indicates the market has rejected the breakout above $631. This could trap chasing investors, pushing BCH/USDT down to $563 and then to $518.
On the upside, bulls will attempt to resume the uptrend by pushing Bitcoin Cash above $670. Success could see the pair surge to $720, where bears are expected to appear.
Technical Analysis of LINK
Chainlink (LINK) rebounded strongly from the moving averages on Tuesday, indicating bulls are trying to form a higher low.
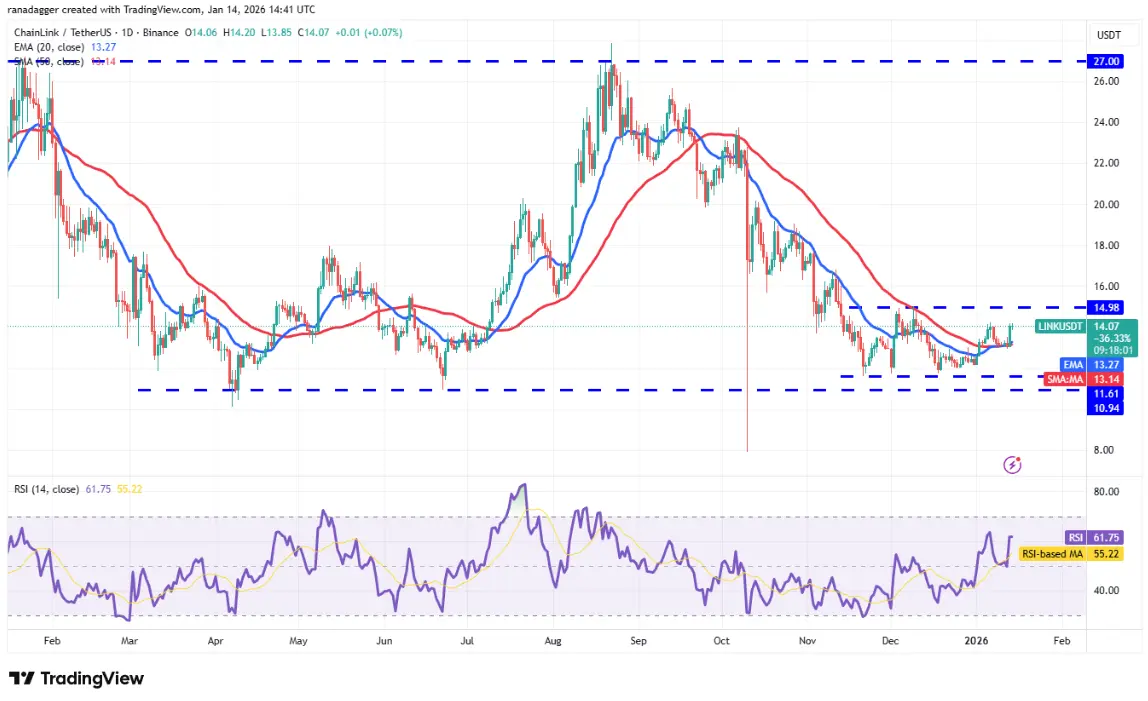 Daily LINK/USDT chart | Source: TradingViewBulls will look to strengthen their position by pushing LINK above the resistance zone of $14.98. If successful, LINK/USDT could rise to $17.66, bringing the broader trading range from $10.94 to $27 back into focus.
However, bears are unlikely to stay idle. They will try to block the recovery at $14.98 and push the price below the moving averages, which could keep the pair trapped within the $11.61–$14.98 range for some more time.
Related Articles
Solana Price Faces Pressure as Global Tensions Rise: Sell Signal Adds to Market Anxiety - BTC Hunts
Bitcoin Records Historic Q1 Crash Amid Growing Geopolitical Pressure
CoinShares: Digital asset investment products saw approximately $1 billion in net inflows last week
Gate Research Institute: Bitcoin, Crude Oil, and Gold Trends and Investment Opportunities Amid US-Iran Conflict
Strategy Raises STRC Dividend to 11.5% as MSTR Logs Eighth Straight Monthly Decline