Buffett recession indicator soars 224%, reaching a new high! Stock market bubble surpasses the 2000 dot-com bubble
Buffett Indicator soars to 224%, hitting a new high, with stock market capitalization exceeding GDP by double. The ratio peaked before the 2000 dot-com bubble and the 2008 crisis, followed by sharp declines. With the real economy showing signs of slowing growth and weakening labor markets, history suggests that adjustments often occur through asset price declines rather than economic expansion to absorb high valuations.
Warning of a Bubble from the Buffett Recession Indicator
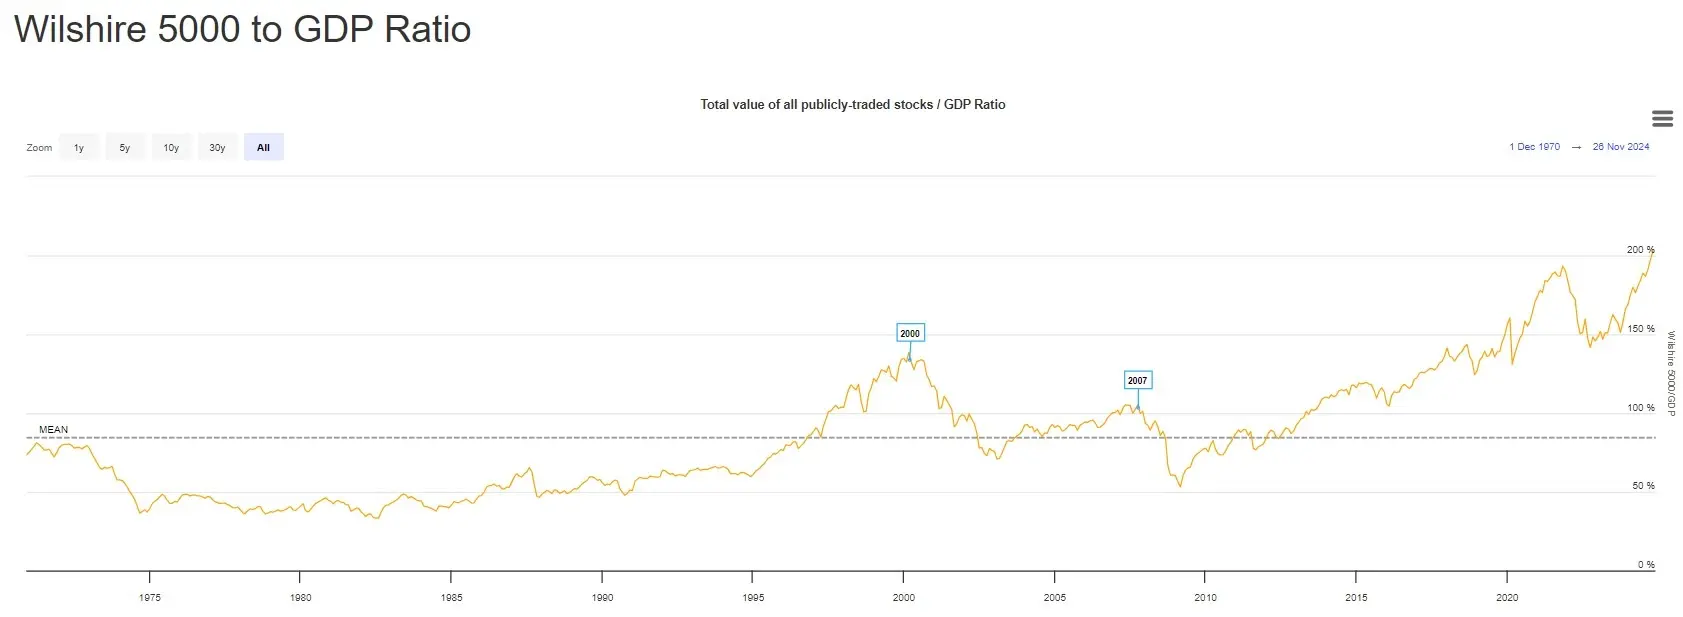
(Source: Barchart)
The Buffett Recession Indicator has surged to approximately 224%, reaching a record high. This means that the total market capitalization of the U.S. stock market now exceeds twice the size of the U.S. economy. Such an extreme divergence often precedes periods of significant market stress. Notably, during most of the 1970s and 1980s, this ratio remained well below its historical average until it rapidly climbed during the tech boom of the late 1990s.
The ratio peaked around 2000, just before the burst of the dot-com bubble, and then plummeted sharply with the market correction. A similar but slightly lower surge occurred before the 2007 global financial crisis, followed by a clear decline. These historical lessons show that when the Buffett Indicator reaches extreme highs, a market crash is often imminent.
In 2000, the Buffett Indicator was about 180%, and the Nasdaq plunged over 75% in the following two years. Before the 2008 financial crisis, it was around 140%, and the S&P 500 was halved within a year. The current level of 224% far exceeds these two bubbles, implying that if a crash occurs, the decline could be even more severe.
Since 2010, the indicator has continued to rise, reflecting years of ultra-loose monetary policy, expanding corporate valuations, and strong investor risk appetite. However, the recent upward move is particularly steep and large in scale. The ratio has surpassed previous peaks, including those before the 2000 and 2008 downturns, indicating valuations have entered an unprecedented “unknown territory.”
Three Historical Warnings from the Buffett Recession Indicator
2000 Dot-com Bubble: Indicator reaches 180%, Nasdaq crashes over 75% in two years
2008 Financial Crisis: Indicator reaches 140%, S&P 500 halves within a year
Current 2026: Indicator hits 224%, far exceeding previous bubbles, indicating greater risk
Buffett himself detailed the logic of this indicator in a 2001 article in Fortune magazine. He pointed out that long-term stock market returns cannot sustainably outperform economic growth because corporate profits ultimately derive from GDP. When market cap exceeds GDP by a large margin, it signals overly optimistic expectations for future earnings growth. Once these unrealistic expectations are disproved by reality, valuation bubbles tend to burst rapidly.
A Deadly Combination of Slowing Real Economy and Valuation Bubbles
What makes the current signal especially concerning is that the surge in this ratio occurs amid signs of slowing growth in parts of the real economy. When market capitalization continues to expand faster than GDP over an extended period, it often indicates that stock prices are overly optimistic about future prospects. Historically, such adjustments tend to occur through asset price declines rather than rapid economic expansion to deflate high valuations.
As this warning appears, many economists are raising concerns about rising recession risks. Some analysts (including Henrik Zeberg) point out that market vulnerability to a sustained correction is increasing, citing indicators such as slowing labor market trends and weakening momentum in certain economic sectors. Although the U.S. unemployment rate remains low, it has risen from historic lows. Initial jobless claims are trending upward, and job openings are declining—signs of labor market cooling.
Manufacturing PMI data also show weakness. The ISM Manufacturing Index has been below the 50 expansion-contraction threshold for several months, indicating contraction. Consumer confidence indices fluctuate but trend downward overall. Retail sales growth is slowing, and the housing market has stagnated due to high interest rates. These microeconomic deteriorations contrast sharply with the continued rise in the stock market, confirming the disconnect highlighted by the Buffett Indicator.
Even more concerning is that current high valuations are based on expectations of low interest rates. Market pricing reflects expectations that the Federal Reserve will cut rates by 2026, but if inflation rebounds or economic resilience exceeds expectations, the Fed may keep rates high longer. Such a scenario would hit valuations doubly: slowing earnings growth plus rising discount rates could trigger a sharp market decline.
Additionally, the AI investment boom is a key driver of the current valuation bubble. Tech giants’ massive capital expenditures in AI have driven up stock prices, but the returns on these investments remain uncertain. If AI commercialization progresses less than expected, markets may reassess these valuations, leading to a tech stock crash and broader market fallout.
Three Investor Strategies for 2026
In light of the record high in the Buffett Recession Indicator, how should investors respond? The first strategy is to reduce equity exposure and increase cash and bonds. When stock valuations are extremely high, the “option value” of cash rises significantly—it gives you the ability to buy at lower prices after a market crash. Buffett himself often holds large cash positions when markets are overvalued, waiting for opportunities.
The second strategy is to shift toward defensive assets. If a correction occurs, sectors like consumer staples, utilities, and healthcare tend to decline less than cyclical sectors like technology and finance. Additionally, alternative assets such as gold and Bitcoin may provide hedges during a market downturn. After the 2008 crisis, gold surged from $800 to $1,900, and Bitcoin became an important safe haven in subsequent years.
The third strategy is to maintain positions but raise quality standards. In a high-valuation environment, avoid speculative growth stocks with uncertain profits, and instead focus on value stocks with stable cash flows, high dividend yields, and healthy balance sheets. These companies tend to be more resilient during market declines, and their dividends can offset some capital losses.
Related Articles
BlackRock Loads Up $767M in Bitcoin — Institutions Step In Big
ETH drops 1.12% in 15 minutes: On-chain whale rebalancing and liquidity contraction drive short-term pressure
JPMorgan: Crypto Market Legislation Expected to Pass by Mid-Year! 8 Major Bullish Factors to Ignite the Second Half of the Year
Ethereum Price News: ETH Exchange Reserves Hit Three-Year Low, Bulls Target $2,150
Bitcoin Bottoming Signal? VanEck CEO: Halving Cycle and Geopolitics jointly Drive BTC Rebound