JasmyCoin Price Pauses After Rally, But the JASMY Chart Still Favors Another Move Higher

CaptainAltcoin
JASMY-6,53%
SUI-8,94%

The JasmCoin (JASMY) price had a great week, rising by 44.57% and reaching a two-month high of $0.0101 due to some futures market speculation and whale accumulation, according to Bankless Times.  However, traders’ profit-taking caused a small decline on the last day.

The JASMY price is catching its breath after its strong rally, and honestly, this cooldown looks more like healthy consolidation than weakness.

While exchange supply is at a record low of 7.99M JASMY, there has been net selling over buying by 45M units in key trading sessions.

Rather than breaking down, the JASMY price has slipped into a tight consolidation – a healthy cooldown that’s holding firm without giving up any important ground. Right now, JASMY is sitting nicely above support, which means its overall bullish setup is still in place.

What the JASMY Chart Is Showing

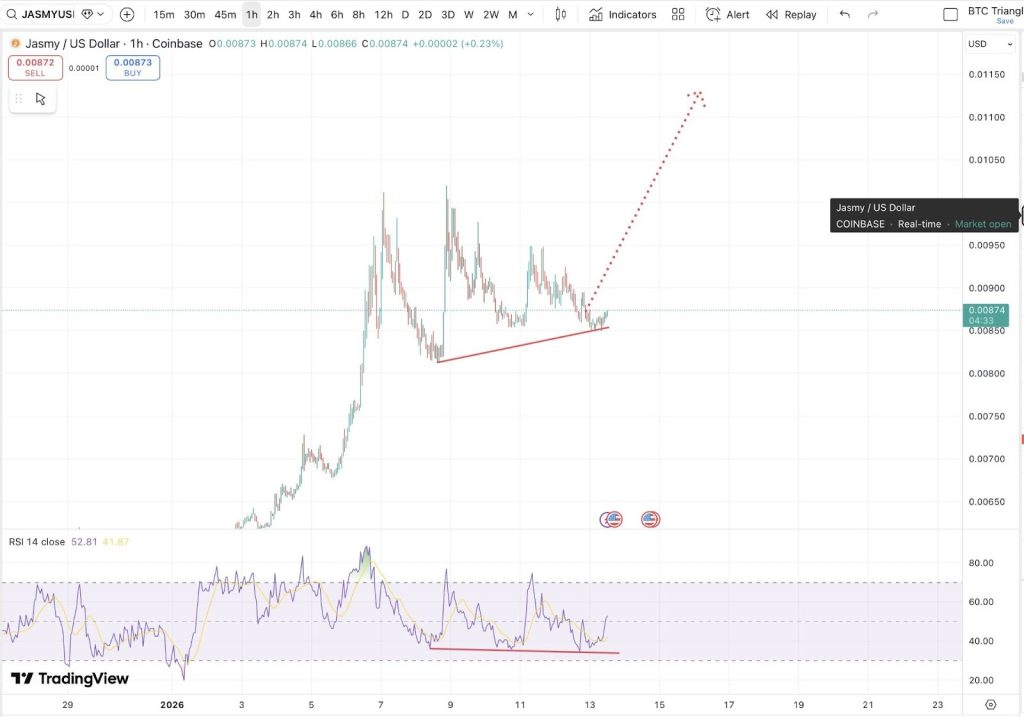
Looking at the chart, the dips have been pretty mild, with higher lows stacking up along that rising trendline. That kind of price action usually indicates that buyers are coming in early and are not waiting for deeper dips.

The consolidation looks orderly, and this more often than not is a signal of accumulation rather than distribution. An interesting clue is showing up in the RSI – analyst Matthew Dixon points out on X that the JASMY price is still holding its RSI support after the latest push higher.

Even as the price moves sideways, the RSI reflects a hidden bullish divergence – a setup that in many cases presages underlying strength and the potential for continuation once consolidation has ended.

_  Source: X/Matthew Dixon_

What comes next for JASMY

As far as JasmyCoin is concerned, there appears to be somewhat of a mixed sentiment surrounding this token.

On the positive side, the bulls are looking at accumulation patterns as well as the robotic aspect associated with this cryptocurrency as positives. On the negative side, the bears are looking at derivative weakness as well as fatigue on the charts as negatives.

The level to keep an eye on is the support area at $0.0085-$0.0090. If the JASMY price manages to hold this area, it could place more emphasis on the breakout play. However, if it falls below, we could see the orderly unwinds come into play.”

The important question for now is whether JASMY can keep this structure going. While price is holding above its rising support and RSI is supported, the setup favors another push higher rather than a deeper retracement.

While short-term chop is still possible, the current chart suggests that this pause could be simply the market resetting for the next leg up.

_****SUI Price Is Back at a Familiar Level That Fueled Rallies: Here’s What Must Happen First**

Disclaimer: The information on this page may come from third parties and does not represent the views or opinions of Gate. The content displayed on this page is for reference only and does not constitute any financial, investment, or legal advice. Gate does not guarantee the accuracy or completeness of the information and shall not be liable for any losses arising from the use of this information. Virtual asset investments carry high risks and are subject to significant price volatility. You may lose all of your invested principal. Please fully understand the relevant risks and make prudent decisions based on your own financial situation and risk tolerance. For details, please refer to Disclaimer.

Related Articles

XRP stabilizes above $1.4, FXRP mints over 3 million tokens in a single day, DeFi and ETF funds accelerate simultaneously

XRP's recent price remains steady in the $1.32-$1.48 range, with the market watching to see if it can break through $1.5. As on-chain activity increases, FXRP minting has risen significantly, and DeFi participation has grown. Capital inflows have strengthened, and positive signs are emerging in spot ETFs, with technical indicators showing bullish momentum is building.

GateNews10m ago

Reports of Israel launching a "preemptive" military attack on Iran! Bitcoin suddenly drops below $65,000, and market panic sentiment soars.

Reports suggest that Israel has launched a "preemptive" military attack on Iran, leading to a deterioration of the Middle East situation. Bitcoin quickly dropped below $65,000, and the crypto market's panic intensified. The confrontation between the United States and Iran has entered a tense phase, with nuclear negotiations between both sides showing no progress. Israel is strengthening its military readiness.

動區BlockTempo14m ago

Gold hits monthly high, silver surges! Crypto and US stocks weaken, safe-haven funds flow back into precious metals

Precious metals prices are rebounding, with gold rising over 1% to nearly $5,250, and silver increasing by more than 6%. Geopolitical tensions between the US and Iran are boosting safe-haven demand. In contrast, Bitcoin and US stocks are experiencing volatility and consolidation, with the S&P 500 down 0.8%. Capital allocation is leaning toward defensive assets, and the trend in precious metals will be influenced by risk appetite and global developments.

GateNews15m ago

Is Bitcoin Seriously Undervalued but Hidden Risks? MVRV Sends Rare Signal, $60,000 Could Be a Critical Test Level

Bitcoin has recently experienced intense volatility, with the price dropping from $66,600 to $62,500 and then rebounding to $70,000, but it has currently fallen back to $66,000. Analysis indicates that selling pressure is not accidental but a continuation of cyclical adjustments, with bears holding the advantage. Although the MVRV Z-Score shows Bitcoin is undervalued, sentiment indicators have not bottomed out, and long-term holder data also indicate risks, potentially facing passive selling pressure.

GateNews15m ago

Bitcoin funding rates turn fully negative, analyst: short squeeze conditions are gradually taking shape

Bitcoin perpetual futures funding rates turn negative, indicating a bearish market dominance. Analysis suggests that if the macro environment improves, it could trigger a short squeeze and push prices higher. Retail trading is active, but whale movements point to the opposite market sentiment, requiring a comprehensive analysis of multiple indicators to assess market trends. Bitcoin is currently consolidating around $68,000, down 46% from its all-time high.

MarketWhisper21m ago

Ethereum price approaches $1,900 support, buy-sell ratio rebounds hinting at a potential key turning point for ETH

Ethereum's recent price has been fluctuating around $1,950, down about 4% in the past 24 hours, with a monthly decline of 35%. The derivatives market buy-sell ratio is gradually rising back to around 1, indicating an improvement in bullish activity. From a technical perspective, ETH remains bearish, with key support levels between $1,850 and $1,880. A break above $2,000 could trigger a rebound. The buy-sell ratio and trading volume will be important indicators for assessing price trends.

GateNews57m ago
Comment
0/400
No comments
Trade Crypto Anywhere Anytime
qrCode
Scan to download Gate App
Community
  • 简体中文
  • English
  • Tiếng Việt
  • 繁體中文
  • Español
  • Русский
  • Français (Afrique)
  • Português (Portugal)
  • Bahasa Indonesia
  • 日本語
  • بالعربية
  • Українська
  • Português (Brasil)