
Key Highlights:
-
Polygon ($POL) climbed over 6% following the launch of Polygon Labs’ Open Money Stack, despite broader market volatility.
-
Open Money Stack aims to enable instant, borderless on-chain payments, positioning Polygon as a core infrastructure layer for global finance.
-
On the weekly chart, POL is forming a Power of 3 structure, often seen near market cycle lows.
-
Price recently dipped below $0.15 before stabilizing, aligning with the manipulation phase of the pattern.
-
A reclaim of $0.15 and the 50-week moving average could open the door for a broader upside expansion.
Polygon’s native token $POL has stepped into the spotlight amid broader market volatility, posting over 6% gains in the past 24 hours despite downside pressure across major cryptocurrencies. The move comes following a major announcement from Polygon Labs, sparking renewed interest in the ecosystem.
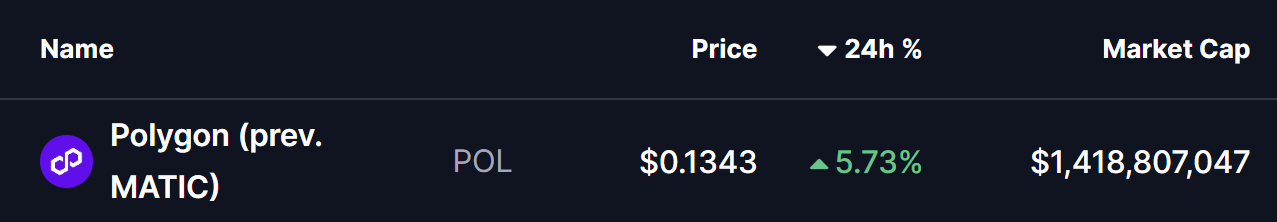
Source: Coinmarketcap
Beyond the short-term reaction, the higher-timeframe chart is beginning to reveal a larger technical structure that could be setting the stage for a potential rebound — provided key levels are reclaimed in the coming weeks.
Polygon Labs Announced Open Money Stack
Polygon Labs has officially introduced the Open Money Stack, a modular and vertically integrated platform designed to enable seamless, instant, and borderless on-chain money movement using stablecoins.
Built on Polygon’s experience facilitating over $2 trillion in on-chain value transfers, the Open Money Stack aims to act as the missing infrastructure layer connecting traditional fiat systems with blockchain rails. The framework brings together core components such as liquidity orchestration, compliance tooling, on- and off-ramps, wallet infrastructure, and on-chain yield mechanisms — all designed to remain chain-neutral and interoperable.
Source: polygon.technology
As Polygon founder Sandeep Nailwal and CEO Marc Boiron stated, “We freed information first with the internet. Money is next.” The initiative seeks to make global payments faster, cheaper, and accessible worldwide, while keeping capital on-chain and productive by default.
The Open Money Stack is rolling out in phases, with early access currently available to design partners. Additional announcements related to payments, orchestration, and compliance are expected in the weeks ahead.
Weekly Chart Structure Signals a Possible Turning Point
From a technical perspective, the weekly chart suggests that POL may be developing a classic Power of 3 (PO3) structure — a pattern often associated with market cycle lows and trend transitions.
This structure typically unfolds across three stages: accumulation, manipulation, and expansion, with the most powerful move often emerging once the final phase begins.
Accumulation Phase
Earlier in the year, POL spent an extended period consolidating inside a defined range, capped by resistance near $0.2766 and supported around the $0.15 region. This sideways price action reflected long-term accumulation, with neither bulls nor bears gaining decisive control.
Manipulation Phase
During the recent market-wide downturn, POL broke sharply below the $0.15 accumulation support, sliding toward a local low near $0.107. This breakdown — highlighted by the red-shaded zone on the chart — fits well with the manipulation phase of the Power of 3 pattern, where stop losses are triggered, sentiment turns bearish, and weaker hands are flushed out.
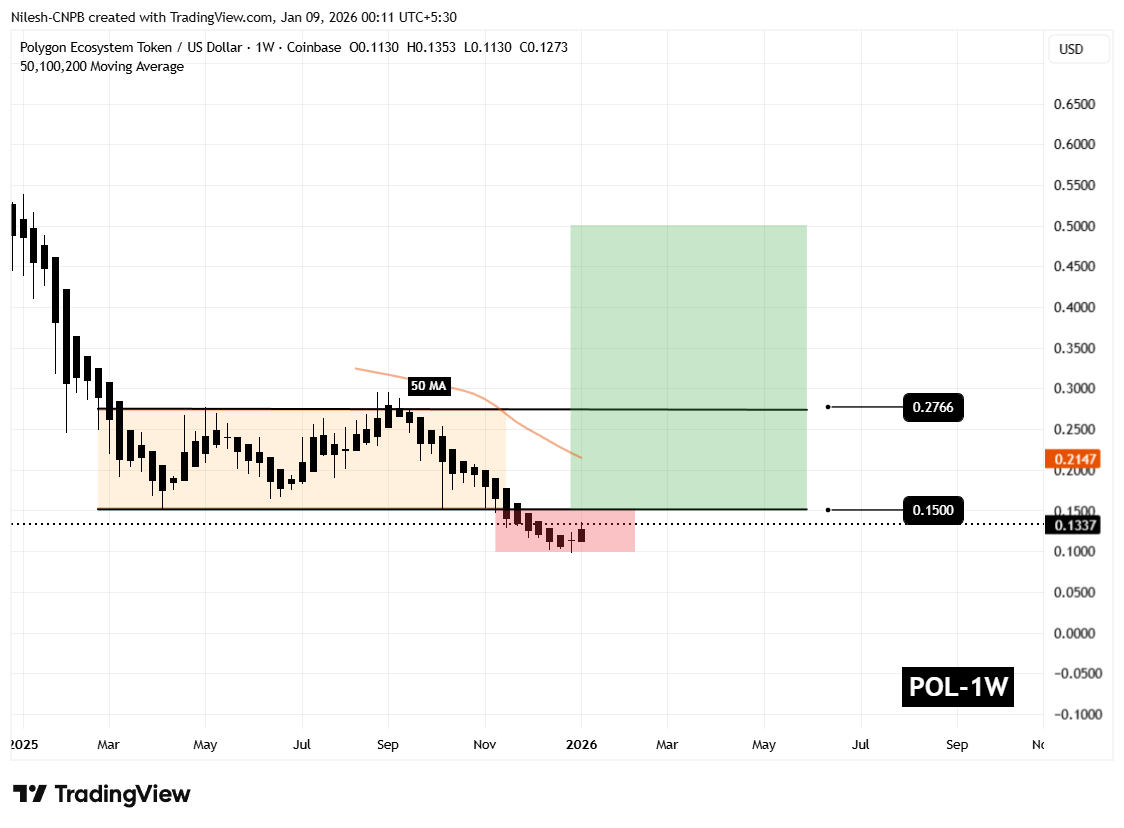
Polygon (POL) Weekly Chart/Coinsprobe (Source: Tradingview)
Notably, selling pressure has begun to cool near this zone, with POL now trading back around $0.13, suggesting early signs of stabilization.
What Comes Next for POL?
At present, POL remains in the lower portion of the structure, trading just below the key $0.15 level — the former accumulation support that now acts as a major decision zone.
For bullish momentum to gain credibility, POL needs to reclaim $0.15 and subsequently move back above the 50-week moving average near $0.2147. A sustained recovery above these levels would signal a transition into the expansion phase of the Power of 3 setup, where upside momentum typically accelerates.
If price successfully pushes through the $0.2566 resistance, the longer-term chart projection opens the door toward the $0.48–$0.50 region over the coming months — an area that aligns with prior structural resistance.
That said, the setup remains conditional. As long as POL trades below $0.15, downside risks cannot be fully ruled out, and volatility may persist. Holding current lows and reclaiming key resistance zones will be critical for bulls to validate a broader trend reversal.
For now, POL sits at an important crossroads — one where fundamentals are strengthening, and the technical structure is quietly preparing for its next decisive move.
Frequently Asked Questions (FAQ)
What is driving the recent price movement in Polygon (POL)?
Polygon’s recent price strength follows the announcement of the Open Money Stack by Polygon Labs, which has improved market sentiment. This fundamental catalyst, combined with a constructive weekly Power of 3 technical structure, has increased bullish interest in POL.
What is the Power of 3 pattern seen on Polygon’s chart?
The Power of 3 (PO3) pattern consists of three phases: accumulation, manipulation, and expansion. On Polygon’s weekly chart, price action suggests it may be transitioning from accumulation into a potential expansion phase, often associated with trend reversals.
Is Polygon (POL) showing signs of a trend reversal?
Technically, Polygon is showing early signs of a possible trend reversal. The formation of higher lows and reclaim attempts above key structural levels suggest buyers are gradually regaining control, though confirmation depends on sustained follow-through.
Is Polygon (POL) a good investment right now?
Polygon’s technical and fundamental setup looks constructive, but cryptocurrency markets remain highly volatile. Investors should consider market conditions, risk tolerance, and conduct independent research before making investment decisions.
Does Polygon’s Open Money Stack impact long-term value?
The Open Money Stack strengthens Polygon’s ecosystem by improving infrastructure for payments and financial applications. Over time, this could support adoption and long-term value if execution and user growth continue.
Disclaimer: The views and analysis presented in this article are for informational purposes only and reflect the author’s perspective, not financial advice. Technical patterns and indicators discussed are subject to market volatility and may or may not yield the anticipated results. Investors are advised to exercise caution, conduct independent research, and make decisions aligned with their individual risk tolerance.
About Author: Nilesh Hembade is the Founder and Lead Author of Coinsprobe, with over 5 years of experience in the cryptocurrency and blockchain industry. Since launching Coinsprobe in 2023, he has been providing daily, research-driven insights through in-depth market analysis, on-chain data, and technical research.
Related Articles
ETH short-term upward movement of 0.99%: Driven by whale inflows and external capital transfers, a structural rebound
From 01:30 to 01:45 (UTC) on March 6, 2026, ETH achieved a return of +0.99% within 15 minutes, with a price range of 2065.42 to 2088.57 USDT, and an amplitude of 1.12%. The volatility during this window was significantly higher than the daily average, increasing short-term market attention. Liquidity was relatively low, and some large transactions drove the trading volume upward.
The main driver of this abnormal movement was the concentrated inflow of whale funds into decentralized exchanges and large transfers. On-chain monitoring detected multiple large ETH fund inflows into DeFi protocols and trading platforms, effectively pushing
GateNews17m ago
Bitcoin drops to $70,600, Ethereum holds at 2,055. Analysts: Bull market score is only 10; don't put too much faith in this rebound.
Bitcoin has recently continued to hit new lows, currently trading at $70,923, and CryptoQuant has warned that the recent rebound is only a short-term rally in a bear market, with a bull market score of only 10 points. The US stock market has declined across the board, and the crypto market is also under pressure. The future trend depends on whether spot demand turns positive. There are multiple scenarios in the market, including possible sideways consolidation or a drop to the $56,000-$60,000 support zone. Ethereum has shown relative strength in this wave of market movement, but if Bitcoin continues to decline, its support levels will need to be observed.
動區BlockTempo49m ago
Bitcoin Reclaims $70K As ETF Flows Stabilize and Selling Pressure Eases
Glassnode reports that Bitcoin's ETF flows are stabilizing after outflows, coinciding with a price rebound above $70,000. Healthy inflows into ETFs indicate a cautious optimism among institutions, but macro risks persist, necessitating continued monitoring of market trends.
BlockChainReporter1h ago
Culper Research announces short positions on ETH and related securities, claiming that Fusaka's upgraded token economic model has been damaged
Short-selling firm Culper Research announced that it is shorting Ethereum and related securities, believing that the Fusaka upgrade in 2025 will harm the ETH tokenomics model. The upgrade resulted in a larger-than-expected decrease in Gas fees, and on-chain data shows that the growth in active addresses and transaction volume is driven by low-value transactions. Culper believes Vitalik is aware of this and will continue to sell ETH, expecting ETH prices to decline further.
GateNews1h ago
Why did Bitcoin drop today? The US warns of a ground invasion in Iran, and Trump demands to lead the next Supreme Leader.
Bitcoin prices fluctuate due to escalating geopolitical tensions, dropping from $72,000 to $70,000 on March 6. Trump's tough rhetoric on the Iran situation, Iran's refusal to cease fire, and the U.S. military announcing increased strikes have heightened risk aversion. Market sentiment is divided, with some predicting Bitcoin will reach $80,000, but some analysts remain skeptical about a rebound. $72,000 is a key technical level; failure to break above it could lead to a drop toward $64,000.
MarketWhisper1h ago
Today, the Fear and Greed Index dropped to 18, indicating the market is in a "Extreme Fear" state.
Foresight News reports that, according to Alternative.me data, the cryptocurrency Fear and Greed Index dropped to 18 today (yesterday the index was 22, indicating "Extreme Fear"), indicating that the market is in a "Extreme Fear" state.
GateNews1h ago

