
**Date: **Mon, Jan 05, 2026 | 07:04 AM GMT
As 2026 kicks off, the broader cryptocurrency market is showing renewed stability. Ethereum (ETH) is up around 4% on the week, and improving sentiment is gradually spreading across major altcoins — including the AI-focused blockchain token Near Protocol (NEAR).
NEAR has already gained more than 10% on a weekly basis, but the more important development is unfolding beneath the surface. Recent price action points to a notable structural shift — one that could mark the early stages of a bullish continuation if key resistance levels are reclaimed.
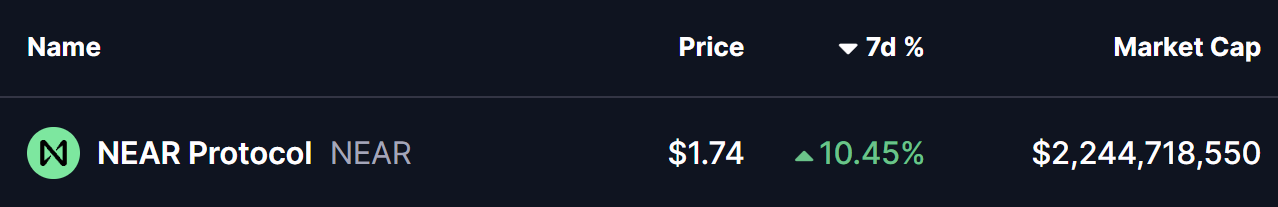
Source: Coinmarketcap
Rounding Bottom in Play
On the daily timeframe, NEAR appears to be forming a rounding bottom pattern, a classic bullish reversal structure that typically emerges after a prolonged corrective phase. This pattern reflects a gradual transition from distribution to accumulation, as selling pressure fades and buyers slowly regain control.
The setup began after NEAR faced a firm rejection near the $1.88 region late last month. That rejection triggered a sharp decline, dragging price down toward the $1.40 area. Importantly, sellers failed to push price meaningfully lower from there, and strong demand emerged at those levels. Over time, NEAR stabilized, volatility compressed, and price began to curl higher — completing the rounded base structure.
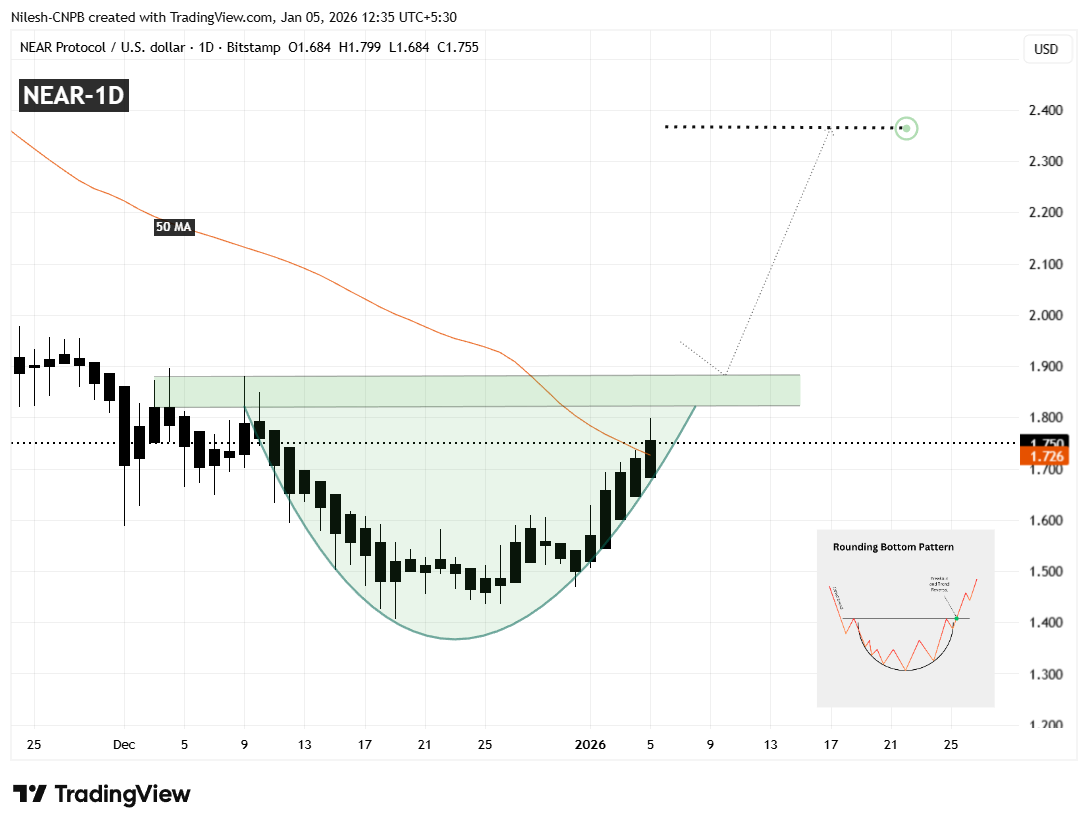
Near Protocol (NEAR) Daily Chart/Coinsprobe (Source: Tradingview)
After reclaiming the 50-day moving average near $1.726, NEAR has shown improving momentum. Currently, price is trading around the $1.75 level and pressing up against a well-defined resistance zone between $1.82 and $1.88. This area represents the neckline of the rounding bottom pattern and has capped upside attempts multiple times in the past, making it the most critical level to watch in the near term.
What’s Next for NEAR?
If NEAR continues to hold the 50-day moving average as support, a clean daily close above the $1.82–$1.88 resistance zone would confirm the bullish rounding bottom breakout. A successful breakout followed by a retest of this zone as support would significantly strengthen the bullish case and signal that a new upward leg is underway.
Based on the depth of the rounding structure, the projected upside target points toward the $2.36 region. Reaching that level would imply a potential upside of roughly 35% from current prices, aligning well with the measured move typically associated with this pattern.
That said, patience remains important. Before any confirmed breakout, NEAR could still experience short-term pullbacks — including a dip toward the rising base of the rounding structure, which has been acting as dynamic support during the recovery. Such pullbacks would not invalidate the bullish setup as long as price continues to hold above the higher-low structure.
Until a decisive breakout and follow-through occur, traders may want to remain cautious and avoid chasing price. The $1.82–$1.88 zone remains the line in the sand that will determine whether NEAR transitions into a sustained bullish phase or remains range-bound for longer.
Disclaimer: The views and analysis presented in this article are for informational purposes only and reflect the author’s perspective, not financial advice. Technical patterns and indicators discussed are subject to market volatility and may or may not yield the anticipated results. Investors are advised to exercise caution, conduct independent research, and make decisions aligned with their individual risk tolerance.
About Author: Nilesh Hembade is the Founder and Lead Author of Coinsprobe, with over 5 years of experience in the cryptocurrency and blockchain industry. Since launching Coinsprobe in 2023, he has been providing daily, research-driven insights through in-depth market analysis, on-chain data, and technical research.
Disclaimer: The information on this page may come from third parties and does not represent the views or opinions of Gate. The content displayed on this page is for reference only and does not constitute any financial, investment, or legal advice. Gate does not guarantee the accuracy or completeness of the information and shall not be liable for any losses arising from the use of this information. Virtual asset investments carry high risks and are subject to significant price volatility. You may lose all of your invested principal. Please fully understand the relevant risks and make prudent decisions based on your own financial situation and risk tolerance. For details, please refer to
Disclaimer.
Related Articles
Dogecoin, Pepe, and Shiba Inu Slide as Bitcoin Falls Below $70K
Bitcoin's drop below $70K triggers a selloff in meme coins like Dogecoin and Shiba Inu, causing increased market volatility. Despite a surge in Shiba Inu's burn activity, its price declines alongside Dogecoin, which struggles with weak momentum.
CryptoBreaking10m ago
Bitmine accelerated purchases last week with 60,976 ETH! Tom Lee: Ethereum is in the late stage of the "bear market," and the bottom could be seen as early as this week.
Ethereum reserve company Bitmine announced its holdings on March 9, accumulating 4.535 million ETH with total assets reaching $10.3 billion. Chairman Tom Lee stated that they have recently accelerated their purchase by 60,976 ETH and believe that Ethereum is currently in the late stage of a small bear market, with the bottom estimated between March 8 and 14. Bitmine has staked 3.04 million ETH, generating an annualized yield of $174 million, and plans to launch its own staking infrastructure, MAVAN.
動區BlockTempo30m ago
Ethereum Breakout Signals Short-Term Upside
The recent bullish sentiment in the crypto market is driven by Ethereum's breakout from a downward trendline, indicating potential price targets of $2,050 and $2,085. While the volatility remains, analysts are optimistic about Ethereum's long-term prospects contingent on market adoption.
Coinfomania40m ago
SXP Price Surges 11.59%: What This Could Mean for Traders
SXP has surged 11.59% amid a generally declining crypto market, reaching $0.0231. This increase reflects heightened investor interest, driven by market dynamics and trading activity, as traders eye key resistance and support levels.
Coinfomania50m ago
BitMine increased its holdings by 60,976 ETH last week. The Executive Chairman states that ETH may bottom out in mid-month.
BitMine announced that as of March 8, its total assets reached $10.3 billion, including 4,534,563 ETH and 195 BTC. Executive Chairman Tom Lee stated that amidst market uncertainty, ETH has shown resilience, and its price is expected to bottom out between March 8 and 14. Meanwhile, BitMine is accelerating its ETH accumulation, with staked ETH reaching 3,040,483.
GateNews55m ago
Oil prices rise to $119, reaching a new high since 2022, Bitcoin remains at $67,000, and the Federal Reserve has a 99% probability of maintaining interest rates in March.
On March 9th, WTI crude oil prices rose to $119 per barrel, reaching a new high since 2022. Due to threats from Iran, global crude oil supply losses approached 20 million barrels. Bitcoin remained at $67,000, with no signs of panic selling. The probability that the Federal Reserve will keep interest rates unchanged is approximately 99%.
GateNews1h ago