Monero (XMR) To Rally Higher? Key Bullish Breakout and Retest Hints at Potential Upside Move

**Date: **Fri, Jan 02, 2026 | 06:40 PM GMT
The broader cryptocurrency market has started the new year with modest strength, as both Bitcoin (BTC) and Ethereum (ETH) trade in the green with gains of over 2%. While several altcoins are regaining momentum, the privacy-focused token Monero (XMR) has remained relatively flat in comparison.
XMR is trading with mild gains, but more importantly, its daily chart structure suggests the recent pullback may be a healthy bullish retest rather than a sign of trend exhaustion.
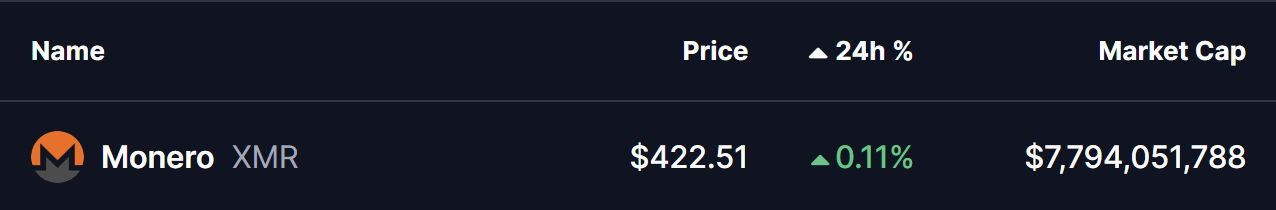
Source: Coinmarketcap
Retesting the Cup and Handle Breakout
On the daily timeframe, XMR had been consolidating within a well-defined Cup and Handle pattern — a classic bullish continuation formation that often precedes strong upside moves once the neckline is cleared.
Earlier, bulls decisively broke above the $412–$420 neckline resistance, triggering a sharp rally of nearly 20% from the breakout base to a local high around $498.30. This move confirmed the pattern’s validity and signaled a clear shift in market structure toward the upside.
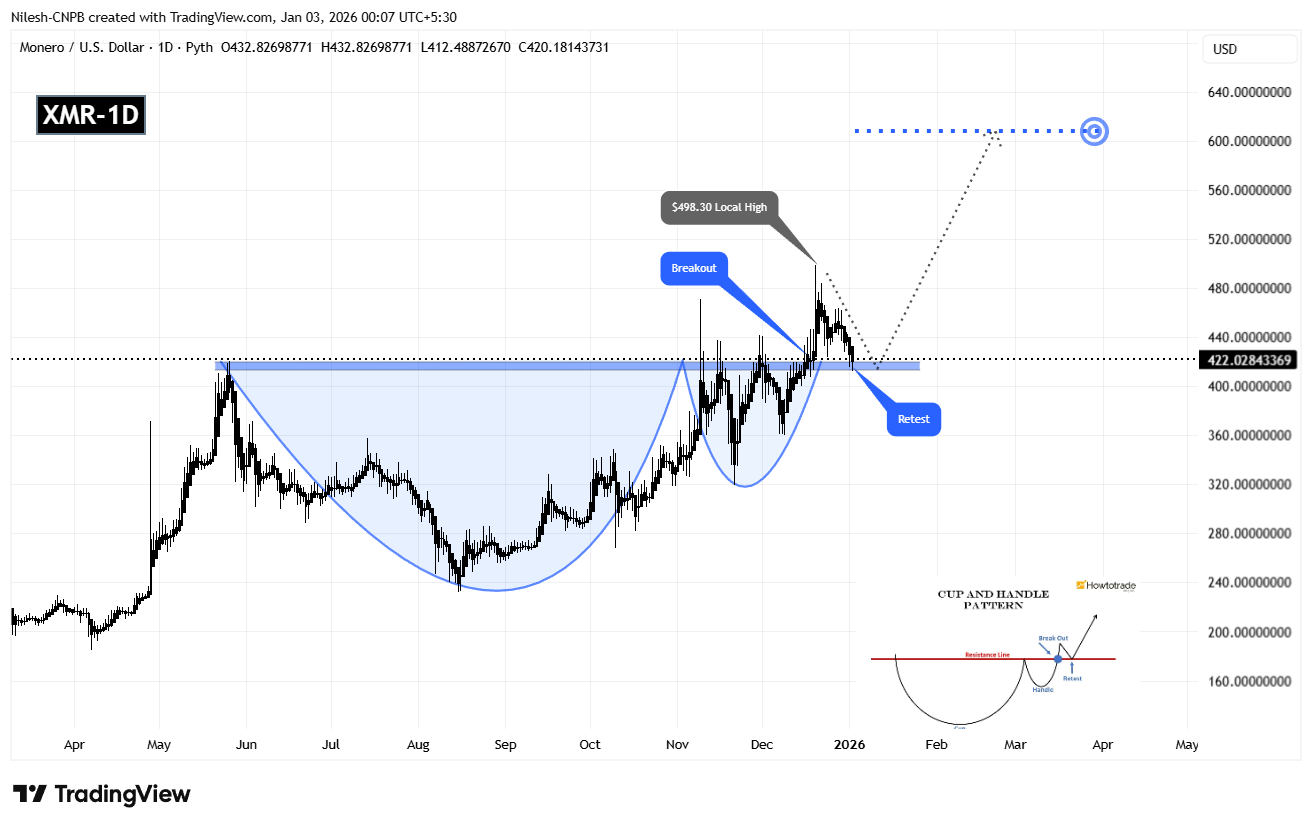
Monero (XMR) Daily Chart/Coinsprobe (Source: Tradingview)
Following that initial breakout surge, XMR entered a natural cooldown phase. The recent dip has brought price back toward the $412–$420 zone, where buyers have stepped in once again. This area now acts as a textbook resistance-turned-support level. Such retests are common after strong breakouts and often serve as a launchpad for the next impulsive move if demand holds firm.
What’s Next for XMR?
As long as buyers continue to defend the $412–$420 neckline zone, the broader bullish structure remains intact. A sustained push back above the recent swing high near $498 would likely signal renewed momentum and confirm continuation of the breakout.
Based on the depth of the cup formation, the technical upside projection points toward the $608 region. This would represent a potential upside of roughly 43% from current levels if momentum accelerates.
On the downside, a failure to hold the $412–$420 support range could temporarily weaken bullish momentum and delay the continuation scenario. However, the larger structure would still remain constructive as long as price stays well above the cup’s base.
For now, XMR appears to be in a crucial confirmation phase. How price reacts around this key support zone in the coming sessions will likely determine whether Monero transitions into a full-scale continuation rally or spends more time consolidating before its next move.
Disclaimer: The views and analysis presented in this article are for informational purposes only and reflect the author’s perspective, not financial advice. Technical patterns and indicators discussed are subject to market volatility and may or may not yield the anticipated results. Investors are advised to exercise caution, conduct independent research, and make decisions aligned with their individual risk tolerance.
About Author: Nilesh Hembade is the Founder and Lead Author of Coinsprobe, with over 5 years of experience in the cryptocurrency and blockchain industry. Since launching Coinsprobe in 2023, he has been providing daily, research-driven insights through in-depth market analysis, on-chain data, and technical research.
Related Articles
BTC short-term decline of 0.81%: Futures long liquidation wave triggers passive selling and liquidity resonance, intensifying volatility
Breakout Pushes $0.09656 DOGE Above Converging Trendlines as Price Trades Between Key Levels
SOL Slides 11% to $78 After $90 Rejection — Is $76 Support Next?
Geopolitical Fears Drive Crypto Community Chatter to a New Peak
ETH short-term increase of 1.01%: ETF capital net inflow and ecological upgrade expectations resonate to drive a rebound
PEPE Slides Within Tight 24H Range — Will Momentum Hold as $0.053891 Caps Gains?