Canton (CC) To Rise Higher? Key Breakout and Retest Hints At Potential Upside Move

Key Highlights: Canton (CC) Technical Setup
-
Bullish Chart Pattern: Canton (CC) has confirmed a textbook Cup-and-Handle breakout on the daily timeframe, a structure typically signaling the start of a massive uptrend.
-
Critical Support Zone: Price is currently undergoing a “healthy” retest of the $0.1390 neckline. This former resistance-turned-support aligns with a major institutional demand block.
-
Institutional Catalyst: The technical breakout follows news of JPMorgan and Lloyds Bank integrating the Canton Network for real-world asset (RWA) tokenization and settlement.
-
Market Resilience: Despite Bitcoin (BTC) slipping below $90,000, $CC is showing relative strength by holding its breakout structure, signaling strong dip-buying activity.
The broader cryptocurrency market is taking a breather after a strong start to the year. Bitcoin (BTC), which surged close to the $94,000 level earlier this week, has slipped back below $90,000, dragging overall market sentiment slightly lower. Ethereum (ETH) is also under pressure, down around 3% on the day.
However, while the majors altcoins retreat, Canton (CC) is quietly flashing a technically “constructive” setup. Backed by a wave of RWA (Real World Asset) tokenization news, the CC daily chart suggests a massive bullish move is brewing beneath the surface.
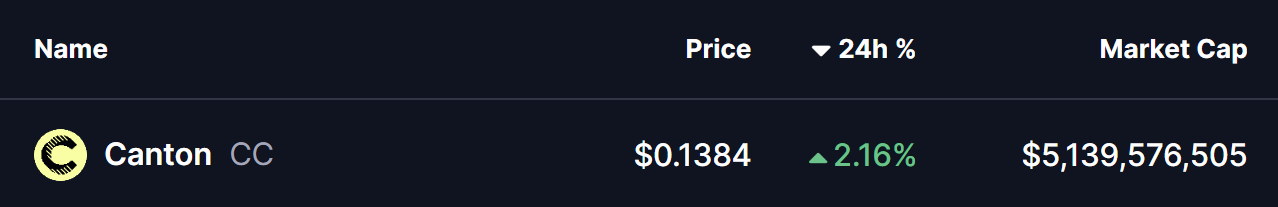
Source: Coinmarketcap
Fundamental Catalyst: The JPMorgan & Lloyds Bank Effect
Canton’s resilience isn’t accidental. On January 7, 2026, the network saw two massive institutional wins:
-
JPMorgan announced a phased 2026 rollout of JPM Coin natively on the Canton Network.
-
Lloyds Banking Group executed the UK’s first tokenized gilt transaction on the platform.
These milestones have transformed $CC from a speculative altcoin into a critical piece of global financial infrastructure, providing the fundamental “fuel” for the current chart breakout.

Source: @CantonFdn (X)
Cup-and-Handle Breakout Enters Retest Phase
On the daily timeframe, Canton had been consolidating within a textbook cup-and-handle formation, a bullish continuation structure that often precedes strong upside expansion once confirmed.
This pattern began forming in early November after CC faced rejection near the $0.1360 resistance zone. That rejection led to a prolonged decline, with price eventually bottoming around $0.0586. From that low, selling pressure gradually faded and buyers stepped in consistently, allowing price to carve out a smooth, rounded base over several weeks — a classic cup structure.
The consolidation resolved with a clean breakout above the neckline near $0.1390, propelling CC sharply higher toward a local peak at $0.1768. Following this impulsive move, price entered a controlled pullback — a normal and healthy behavior after a breakout — setting up a retest of the former resistance area.
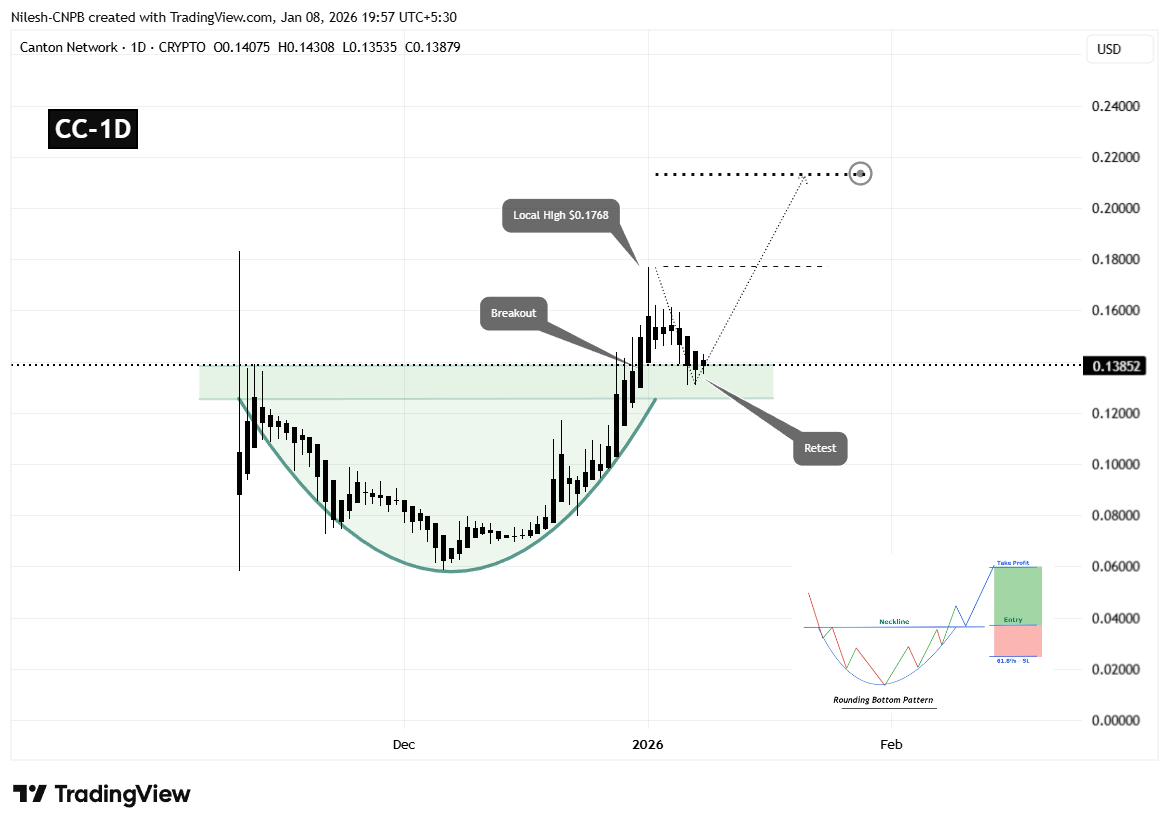
Canton (CC) Daily Chart/Coinsprobe (Source: Tradingview)
Currently, CC is trading back near the $0.1390 region, which now acts as a resistance-turned-support zone. This area also overlaps with the broader demand block highlighted on the chart, making it a technically important level for the next directional move.
What the Chart Suggests Next for CC
The ongoing retest phase remains constructive as long as buyers continue to defend the $0.1390–$0.1308 support zone. A strong reaction from this region would signal that market participants are using the pullback to accumulate rather than exit positions.
If support holds and bullish momentum resumes, the first upside objective would be a reclaim of the $0.1768 local high. A decisive move above this level would reinforce bullish control and confirm strength following the breakout-retest structure.
Based on the measured move projection of the broader rounding bottom and cup formation, a successful continuation could push CC toward the $0.2130 region. This target aligns with the projected extension shown on the chart and represents approximately 50%–55% upside from the breakout zone.
On the flip side, failure to hold above the $0.1308 support area would weaken the bullish setup and increase the risk of a deeper pullback, potentially turning the recent breakout into a failed move.
For now, the structure favors patience. As long as CC maintains support and avoids aggressive rejection from this retest zone, the broader technical outlook continues to lean bullish.
Why is Canton (CC) rising in 2026?
The rise is driven by institutional adoption. Major entities like the DTCC and JPMorgan are using Canton for tokenizing U.S. Treasuries and cross-border settlements.
Disclaimer: The views and analysis presented in this article are for informational purposes only and reflect the author’s perspective, not financial advice. Technical patterns and indicators discussed are subject to market volatility and may or may not yield the anticipated results. Investors are advised to exercise caution, conduct independent research, and make decisions aligned with their individual risk tolerance.
About Author: Nilesh Hembade is the Founder and Lead Author of Coinsprobe, with over 5 years of experience in the cryptocurrency and blockchain industry. Since launching Coinsprobe in 2023, he has been providing daily, research-driven insights through in-depth market analysis, on-chain data, and technical research.
Related Articles
BTC short-term decline of 0.81%: Futures long liquidation wave triggers passive selling and liquidity resonance, intensifying volatility
Breakout Pushes $0.09656 DOGE Above Converging Trendlines as Price Trades Between Key Levels
SOL Slides 11% to $78 After $90 Rejection — Is $76 Support Next?
Geopolitical Fears Drive Crypto Community Chatter to a New Peak
ETH short-term increase of 1.01%: ETF capital net inflow and ecological upgrade expectations resonate to drive a rebound
PEPE Slides Within Tight 24H Range — Will Momentum Hold as $0.053891 Caps Gains?