
ENA is starting to show a few signs of life, and the chart shared by Sjuul fits well with the idea of a “power of 3” setup. After several weeks of weakness, ENA could be on the cusp of shifting from a base-building phase to a more constructive phase.
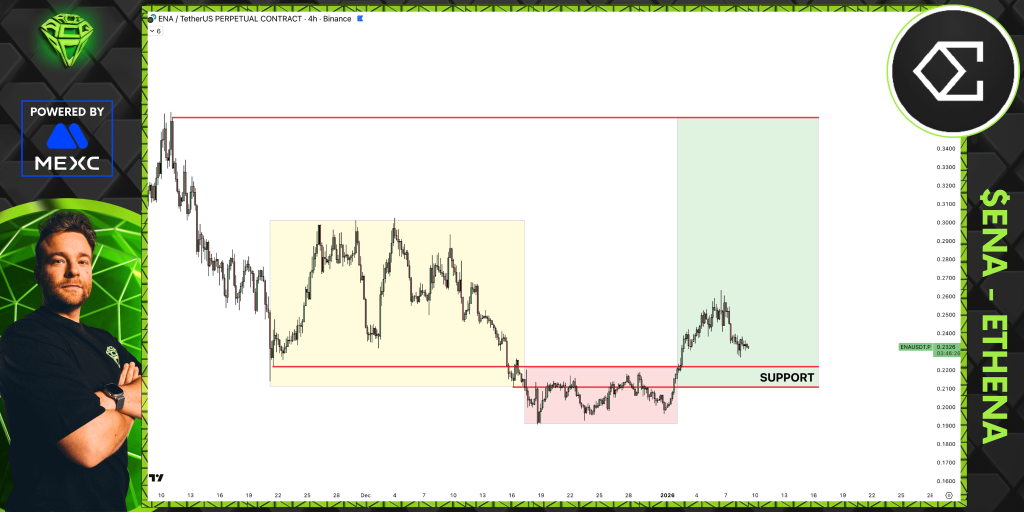
Right now, the ENA price is trading around $0.22, though the key question revolves around testing a critical support point.
- ENA Is Trying to Build a Base After a Long Slide
- This Support Level Is Doing the Heavy Lifting
- What’s Next for ENA?
ENA Is Trying to Build a Base After a Long Slide
Looking at the left side of the chart shared by Sjuul, the ENA price spent a long time drifting lower before settling into a messy, choppy range. That yellow zone highlights a stretch where price moved sideways before eventually breaking down.
After that drop, ENA started forming a base in the lower range, with price repeatedly testing the same area and failing to push much lower. That kind of action often shows sellers are losing control.
Source: X/@AltCryptoGems
Then the structure shifted. The ENA price pushed back above support and made a sharp move higher into the green zone. Since that pop, price has pulled back, but the important thing is that it hasn’t given the move back entirely. That’s usually what bulls want to see if a recovery is going to stick.
Here Are $XRP Price Predictions for The End of 2026._**
This Support Level Is Doing the Heavy Lifting
The support zone in the low-$0.22 area is the level that matters most right now. It’s where resistance turned into support after the rebound, and it’s acting as the line in the sand. As long as ENA keeps holding above this level, the setup stays intact.
If that support fails, the chart starts to look a lot weaker. A break below it would likely send the
ENA price back toward $0.21 or even into the high-$0.19 range, where the earlier base formed. That would turn the recent move into a failed breakout.
What’s Next for ENA?
On the bullish side, the ENA price holds support and starts putting in higher lows. That would keep the expansion phase in play. The first area to watch is around $0.25 to $0.26, which lines up with the recent swing high.
If ENA can get back above that zone and hold it, the path opens toward the upper $0.20s, with the broader range resistance sitting much higher near $0.34.
If momentum doesn’t show up, a more neutral outcome is possible. In that case, ENA could stay stuck between the low-$0.22 support and resistance near $0.25, chopping sideways until the market makes up its mind.
So, where is the ENA price headed next? For this ENA price prediction, it really comes down to one thing. As long as support holds, ENA has a real shot at expanding higher. If it doesn’t, the chart likely slides back into consolidation.
Disclaimer: The information on this page may come from third parties and does not represent the views or opinions of Gate. The content displayed on this page is for reference only and does not constitute any financial, investment, or legal advice. Gate does not guarantee the accuracy or completeness of the information and shall not be liable for any losses arising from the use of this information. Virtual asset investments carry high risks and are subject to significant price volatility. You may lose all of your invested principal. Please fully understand the relevant risks and make prudent decisions based on your own financial situation and risk tolerance. For details, please refer to
Disclaimer.
Related Articles
BTC 15-minute increase of 1.06%: Macroeconomic liquidity expectations and institutional buying resonance driving the market
On March 3, 2026, from 12:00 to 12:15 (UTC), BTC experienced a significant surge, with a 15-minute return of +1.06%. The price ranged from 67,030.1 to 67,966.1 USDT, with an amplitude of 1.40%. This movement attracted widespread market attention, with active short-term trading and increased volatility indicating accelerated capital inflows into mainstream cryptocurrencies.
The main drivers of this movement were the optimistic macroeconomic policy expectations and the resonance of buy orders from leading institutions. As the Federal Reserve's interest rate meeting approaches, the market generally expects to maintain stable interest rates and to conclude quantitative tightening (QT) before May.
GateNews18m ago
ETH short-term increase of 1.04%: Spot buying driven and deflation expectations resonate to amplify the rally
March 3, 2026 12:00 to 12:15 (UTC), ETH prices rapidly rose within the range of 1960.84 to 1990.3 USDT, recording a 1.04% return with an amplitude of 1.50%. The candlestick data reflect significant market activity during this period, with trading volume and volatility both at high levels, attracting widespread market attention.
The main driver of this movement is active spot market buying, which pushed short-term prices higher. At the same time, leveraged funds in the futures market participated heavily, with open interest exceeding $25 billion, and approximately $96.85 million in long and short funds within the market.
GateNews18m ago
Bitmine scans another 50,000 ETH! Tom Lee Looks Forward to a Rebound in March
Bitmine Immersion Technologies (BMNR) announced that as of March 1, it holds 4.47 million ETH, valued at $8.8 billion, making it the publicly listed company with the largest holdings of Ethereum worldwide. Despite the market downturn, Bitmine continues to increase its ETH holdings and plans to launch its own "Made in USA Validator Network," which is expected to generate an annualized revenue of $249 million.
区块客26m ago
BTC Makes Green Daily Candle Despite Iran War
Bitcoin ($BTC) rose to $68,113, showing resilience amidst the U.S.-Iran conflict. It experienced a 1.9% increase and a market cap of $1.36T. With key resistance at $70K, March is critical for its future amid geopolitical tensions.
BlockChainReporter32m ago
Iranian conflict未抑制 buying interest! Bitcoin spot ETF inflows of $458 million in a single day
Amid military strikes by the United States and Israel against Iran, the US Bitcoin spot ETF attracted a net inflow of $458 million, pushing Bitcoin prices close to $70,000. Institutional investors believe that geopolitical risks are short-term shocks, with market leverage levels declining, and no systemic risk being triggered. The options market also shows a calm atmosphere, reflecting traders' preference for short-term hedging rather than long-term bearishness.
区块客37m ago
VanEck CEO Says Bitcoin Nears Bottom in 4-Year Cycle
_VanEck CEO Jan van Eck says Bitcoin nears bottom in 4-year cycle as 2026 price targets divide analysts._
Bitcoin may be approaching the end of its current bear market phase. VanEck CEO Jan van Eck said the price is forming a bottom. He expressed this view in an interview with CNBC on
LiveBTCNews50m ago