Altcoins Are Quiet – But the Next Shock May Be Closer Than It Looks

CaptainAltcoin
BTC6,75%
ETH5,55%
PEPE4,64%
SOL7,29%

Michaël van de Poppe called this an interesting chart, and that description fits perfectly. The altcoin market cap, excluding Bitcoin and Ethereum, is sitting right on a level that really matters.

The market isn’t crashing, and it isn’t collapsing either. We’re seeing a pause, and those pauses do tend to shape what comes next. The vital thing to note, however, is that the uptrend remains intact, provided this support holds.

Best Altcoins to Watch Right Now: PEPE, ETH, and More_**

  • What the Weekly Chart Is Telling Us
  • Why the Rejection at the 21-Week MA Is Normal
  • What Comes Next for Altcoins

What the Weekly Chart Is Telling Us

On the weekly chart shared by Michaël, the altcoin market cap had a strong run through 2024 and into early 2025. After that, momentum slowed and price pulled back into a well-defined support zone. That zone, marked as the “area to hold,” is where the market is currently hovering, around the $878B level.

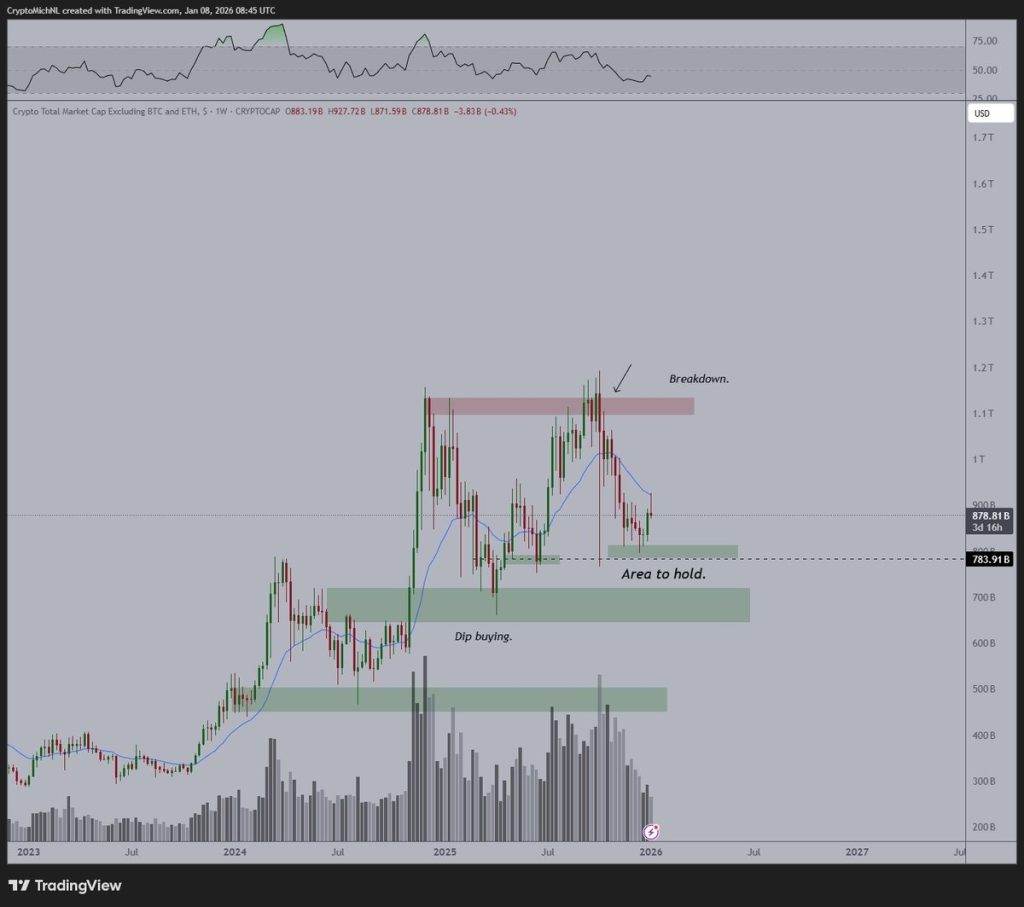
Source: X/@CryptoMitchNL

Just below that sits the more critical line near $784B. This is the level that really matters on a weekly close. As long as the market stays above it, the structure remains constructive. This kind of pullback is actually typical in an uptrend, where price pushes higher, pulls back to demand, and then looks for the next attempt higher.

Bitcoin, Solana, XRP, Other Altcoins Are Waking Up Again: 5 Reasons the Rally Is Not Over_**

Why the Rejection at the 21-Week MA Is Normal

The first bounce off support ran straight into the weekly 21 moving average. The price got rejected there and pulled back again, which might feel discouraging if you were expecting a fast continuation. But in reality, this is fairly normal behavior.

When markets fall below a key moving average, they often need time to build strength before they can reclaim it. That rejection also lines up with a previous supply zone, which explains why price stalled there. Nothing about this move looks random.

What Comes Next for Altcoins

If the $784B area continues to hold, the chart leaves room for more sideways action before another attempt higher.

The next major test would be a reclaim of the 21-week moving average and a move back toward the $1T area, which is where the earlier breakdown started.

If support does fail, the next meaningful demand zone sits lower, roughly between $650B and $700B. That zone acted as a dip-buying area before, so it is the next place where buyers would likely step in.

For now, the chart supports van de Poppe’s main takeaway. It is not a breakout yet, but as long as this support holds, the bigger trend for altcoins still points higher.

Top Analyst Goes All In on Kaspa (KAS): Reveals Why It Beats Most Altcoins_**

Disclaimer: The information on this page may come from third parties and does not represent the views or opinions of Gate. The content displayed on this page is for reference only and does not constitute any financial, investment, or legal advice. Gate does not guarantee the accuracy or completeness of the information and shall not be liable for any losses arising from the use of this information. Virtual asset investments carry high risks and are subject to significant price volatility. You may lose all of your invested principal. Please fully understand the relevant risks and make prudent decisions based on your own financial situation and risk tolerance. For details, please refer to Disclaimer.

Related Articles

Geopolitical Turmoil! Dalio Declares "Gold is the Only True God," but Its Safe-Haven Performance Trails Bitcoin

As geopolitical tensions in the Middle East escalate, Bridgewater founder Ray Dalio questions Bitcoin and reaffirms gold as the preferred safe haven. Nevertheless, gold prices fell accordingly, while Bitcoin only experienced a slight correction, indicating that the correlation between the two is weakening. Dalio doubts Bitcoin's transparency and future risks, but he still maintains a small allocation of Bitcoin for diversification.

区块客26m ago

WuBlockchain Space: Is the accusation that "Jane Street manipulates Bitcoin" just a conspiracy theory?

The WuBlockchain Space program analyzed allegations of Jane Street manipulating Bitcoin prices via ETFs and derivatives. Guests argued that claims of "crypto harvesting" are conspiratorial, with sell-offs reflecting normal market activities rather than intentional manipulation. Recent crypto price volatility is attributed to market structure, liquidity, and macroeconomic factors rather than fear, uncertainty, and doubt. Investors are advised to be cautious of speculative interpretations.

TapChiBitcoin1h ago

Don't cut losses before dawn! K33 Report: Bitcoin has entered the "extremely oversold zone," and selling now makes no sense

K33 Research Institute points out that Bitcoin has now entered an extremely oversold zone, with technical indicators showing bottom signals. Despite the pessimistic market sentiment, selling may not be wise, as institutional investors have reduced their holdings, and Bitcoin's stability has increased under geopolitical influences. The report believes the worst is over, and the current is a buying opportunity for rational investors.

動區BlockTempo1h ago

Gate Institute: Under wartime conditions, BTC's trend remains stable with a slight upward bias, and volatility stays high

Latest data shows that the implied volatility of BTC and ETH remains high, with BTC at the 91% percentile, indicating that the options market expects short-term volatility to stay elevated. Large transactions in BTC and ETH are also active, and the Gate platform has updated its options VIP fee structure, reducing trading costs, which is especially advantageous for beginners and growing users.

GateResearch1h ago

K33: Bitcoin enters an extreme weekly oversold zone, with selling pressure easing and a potential for a temporary rebound brewing

The K33 analysis report indicates that Bitcoin has entered an extremely oversold zone after experiencing selling pressure. Recently, selling pressure has eased, and the market shows signs of stability. Historical data shows that Bitcoin often rebounds after an extreme bearish cycle, although it takes time to form a bottom. However, overselling and supply recovery suggest a rebound opportunity. Nevertheless, the options market still exhibits a strong bearish sentiment.

GateNews1h ago
Comment
0/400
No comments
Trade Crypto Anywhere Anytime
qrCode
Scan to download Gate App
Community
  • 简体中文
  • English
  • Tiếng Việt
  • 繁體中文
  • Español
  • Русский
  • Français (Afrique)
  • Português (Portugal)
  • Bahasa Indonesia
  • 日本語
  • بالعربية
  • Українська
  • Português (Brasil)