Is Algorand (ALGO) Poised for a Breakout? Key Pattern Formation Suggests So!

**Date: **Tue, Jan 06, 2026 | 11:20 AM GMT
The broader cryptocurrency market continues to show renewed strength as 2026 gets underway. Bitcoin (BTC) is up around 6% on the week, while Ethereum (ETH) has posted gains of over 8%, helping improve overall sentiment across the market. This positive momentum is now spreading into major altcoins — including** Algorand (ALGO).**
ALGO has already delivered a strong 22% weekly gain, but the more important development is unfolding beneath the surface. Recent price action suggests a clear structural shift is taking place, one that could mark the early stages of a sustained bullish continuation if a critical resistance zone is decisively cleared.
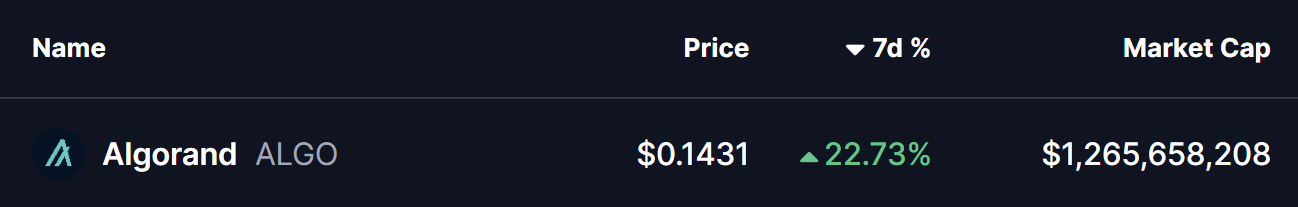
Source: Coinmarketcap
Right-Angled Descending Broadening Pattern in Play
On the 4-hour timeframe, ALGO had been trading inside a right-angled descending broadening formation — a bullish reversal structure defined by a flat overhead resistance and a rising lower boundary. For several weeks, price struggled to overcome the $0.1340–$0.1486 resistance band, with each rejection keeping ALGO locked in consolidation.
The recent rebound from the lower boundary of the structure marked a key turning point. Buyers stepped in aggressively, allowing ALGO to reclaim the 200-period moving average around $0.1225 — a level that had previously acted as dynamic resistance. This reclaim signaled improving momentum and a shift in short-term trend control.
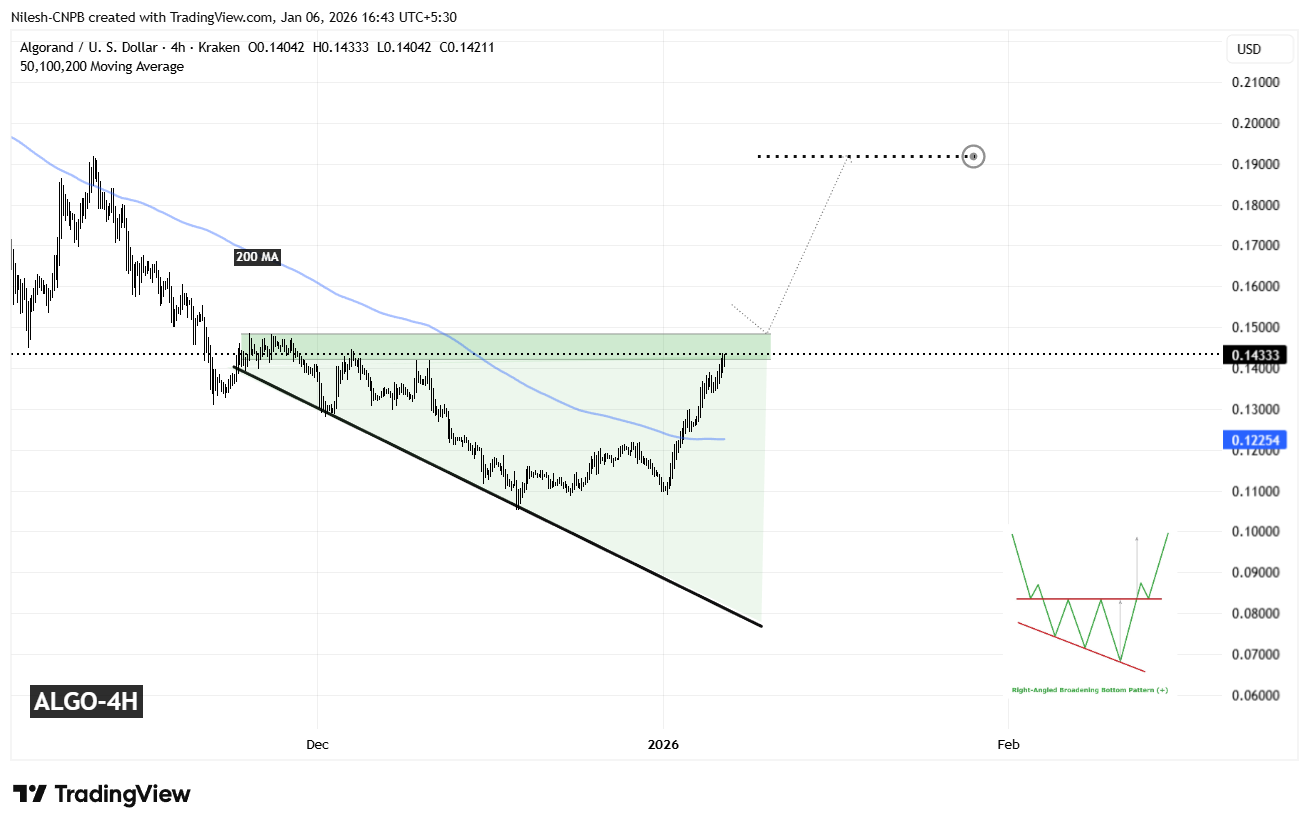
Algorand (ALGO) 4H Chart/Coinsprobe (Source: Tradingview)
Since then, ALGO has continued to push higher and is now pressing back into the same resistance zone that capped upside attempts in the past. This return to resistance places price at a critical inflection point where the broader trend direction could soon be decided.
What’s Next for ALGO?
A decisive close above the $0.1340–$0.1486 resistance zone would confirm a breakout from the descending broadening structure and validate the broader bullish reversal setup. Acceptance above this zone could attract fresh momentum participation and open the door to a stronger expansion phase.
Based on the depth of the formation and the projected measured move, the upside target points toward the $0.1920 region. Reaching that level would imply a potential upside of roughly 33% from current prices, aligning well with the typical behavior seen following successful breakouts from this pattern.
That said, patience remains important. Before any confirmed breakout, ALGO could still see short-term pullbacks — including a retest of the 200-period moving average, which has now turned into dynamic support. Such pullbacks would not invalidate the bullish setup as long as price continues to hold higher-low structures.
Until a clear breakout and follow-through occur, traders may want to remain cautious and avoid chasing price. The $0.1340–$0.1486 zone remains the key decision area that will determine whether Algorand transitions into a sustained bullish phase or continues consolidating as the new year unfolds.
Disclaimer: The views and analysis presented in this article are for informational purposes only and reflect the author’s perspective, not financial advice. Technical patterns and indicators discussed are subject to market volatility and may or may not yield the anticipated results. Investors are advised to exercise caution, conduct independent research, and make decisions aligned with their individual risk tolerance.
About Author: Nilesh Hembade is the Founder and Lead Author of Coinsprobe, with over 5 years of experience in the cryptocurrency and blockchain industry. Since launching Coinsprobe in 2023, he has been providing daily, research-driven insights through in-depth market analysis, on-chain data, and technical research.
Related Articles
BTC 15-minute increase of 0.83%: Short covering and on-chain large funds resonate to drive the move
ETF Frenzy for Capital Inflow, Strong Bearish Momentum in Futures: Bitcoin Surges Past $69,000, Can the Short-term Rebound Continue?
Goldman Sachs CEO Solomon Warns: US-Iran War Impact Could Trigger Several Weeks of Continuous Crypto Market Decline
Ethereum Price News: ETH Exchange Reserves Drop to Historic Lows, Vitalik Buterin Proposes "Shelter Technology" Concept
XRP Price News: Ripple Advances RLUSD Stablecoin Payment Strategy, Potential Impact on XRP Demand
BTC 15-minute increase of 0.77%: Institutional ETF funds strongly flow in, leading the short-term rebound