Solana (SOL) price heads towards higher levels thanks to accelerated ETF inflows
Solana (SOL) price continues to extend its upward momentum and surpasses the $137 mark at the time of writing on Tuesday, up more than 7% in the previous week. Institutional demand for SOL remains strong as spot ETF funds recorded a net inflow of over $16 million on Monday, marking the largest single-day inflow since mid-December. Meanwhile, positive on-chain indicators suggest bullish prospects, opening the possibility for SOL to continue rising.
Increasing Institutional Demand
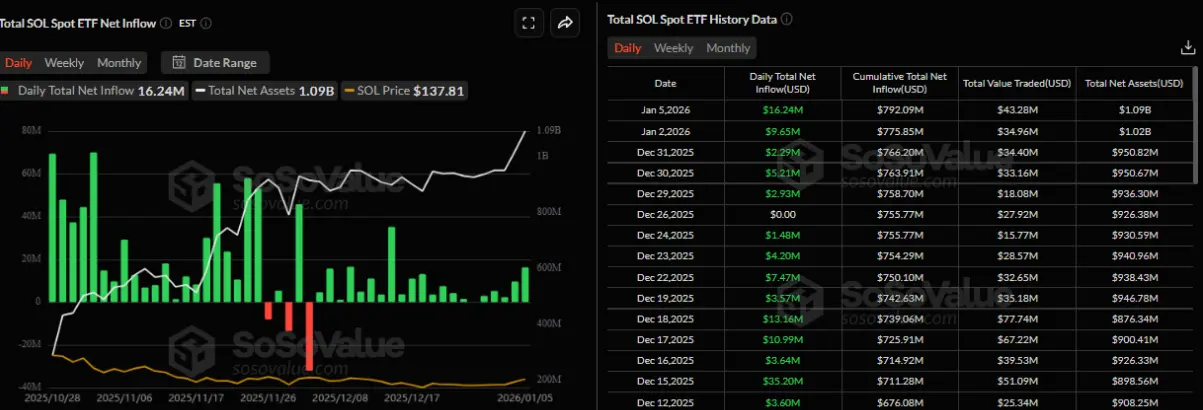
Since its official launch on October 28, Solana has been attracting increasing attention from institutional investors. According to data from SoSoValue, spot Solana ETF funds recorded a net capital inflow of $16.24 million on Monday — the highest single-session inflow since mid-December.
Notably, the total net asset value of these funds also surpassed $1 billion last week, clearly reflecting growing demand from institutional players. As cash flows continue to be maintained and expand, SOL’s price is expected to enter a new growth cycle.
 Source: SoSoValue## Solana On-Chain Data Shows Bullish Trend
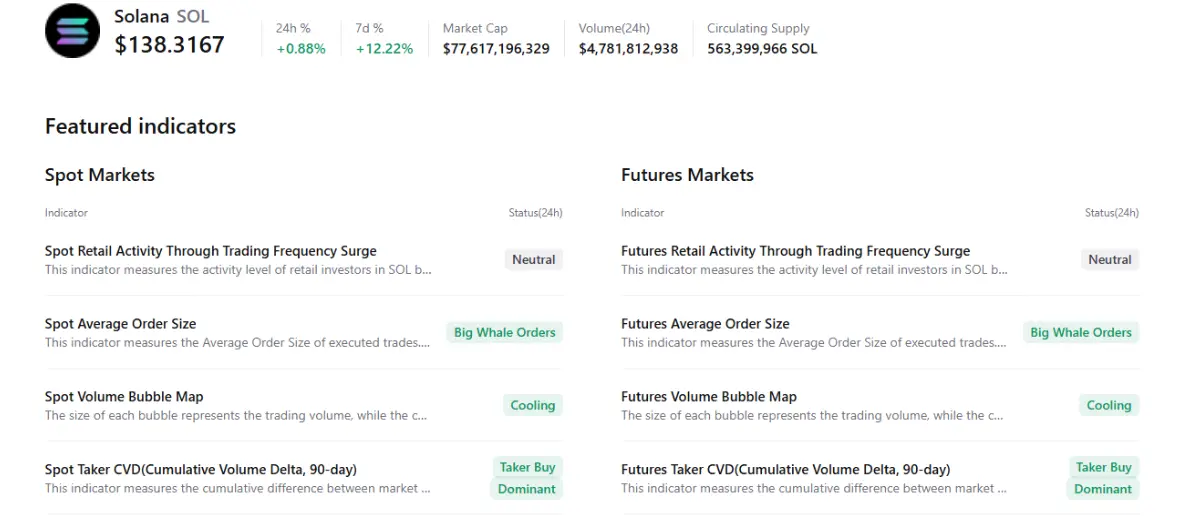
Aggregated data from CryptoQuant indicates a positive outlook as Solana’s spot and derivatives markets show large buy orders from whales, market conditions cool down, and buyers dominate. All these factors reflect improving trader sentiment, suggesting that the upward trend may continue in the coming days.
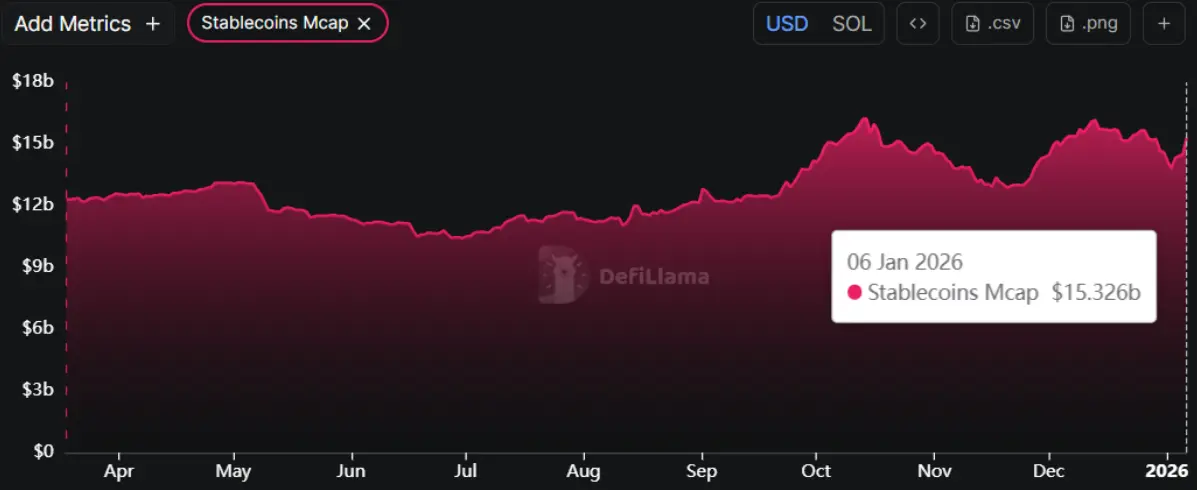
 Source: CryptoQuantAccording to DefiLlama, the total stablecoin supply on Solana has recovered since the beginning of January and now stands at $15.32 billion. Increased stablecoin activity and growth in value within the SOL ecosystem are positive signals, as they promote network usage and can attract more users.
 Source: DefiLlama## Solana Price Forecast: Bulls Target $150
The price of Solana made an impressive breakout when it moved above the upper trendline of the descending wedge pattern — formed by connecting the highs and lows since early October — on December 26. Since then, SOL has increased over 12% through Monday and closed firmly above the 50-day exponential moving average (EMA) at $163.45. On Tuesday, the coin continued trading above the $137 level, indicating that buying pressure remains dominant.
If the current upward momentum is maintained, SOL is likely to extend its rally toward the next resistance zone around $150.61, coinciding with the 100-day EMA.
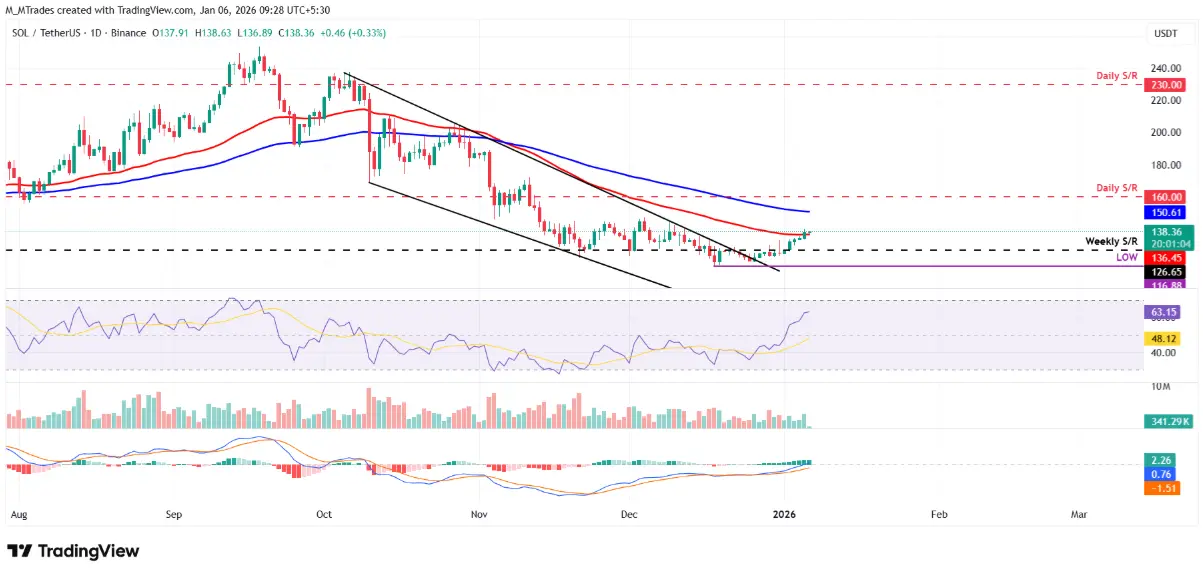 Daily SOL/USDT Chart | Source: TradingView Technical indicators also support a positive scenario. The Relative Strength Index (RSI) on the daily timeframe reaches 63, above the neutral 50 level, reflecting increasing bullish momentum. Meanwhile, the MACD shows a bullish crossover, and green histogram bars continue to expand above the neutral line, further strengthening the short-term bullish outlook.
Conversely, if profit-taking pressure emerges, SOL could correct back and test the key support zone around $126.65 on the weekly timeframe.
SN_Nour
Related Articles
Solana Compresses Beneath $90 After Sharp Range Reclaim
Claude AI Predicts the Price of XRP and Solana If the U.S.–Iran War Escalates Further
x402 Triopoly: Solana, Base, Polygon Lead Agent Payments
Bitcoin "Big Boss" retreats! After Jane Street was sued, the "10 o'clock dump" curse surprisingly lifted
Bitcoin ETF inflow strength rebounds: over $500 million poured in in a single day, hitting a 3-week high