Technical analysis for January 1, 2026: BTC, ETH, BNB, XRP, SOL, DOGE, ADA, BCH, LINK, HYPE
Bitcoin (BTC) is still fluctuating within a narrow range from 86,400 – 90,600 USD, reflecting a state of indecision and temporary balance between buying and selling forces in the market.
Since November, BTC’s performance has been less prominent compared to traditional investment channels such as gold or the S&P 500 index. However, according to on-chain data analysis platform Santiment, the cryptocurrency market is facing “an opportunity to catch up with growth momentum.” This assessment was shared by Santiment in a post on platform X.
Many experts also believe that Bitcoin could benefit significantly from the expected increase in global liquidity in 2026. BitMEX co-founder Arthur Hayes stated that the crypto market could break out strongly as USD liquidity recovers after hitting a bottom in November.
Additionally, another optimistic signal comes from the view that the traditional 4-year cycle of Bitcoin may have been broken. Analyst The ₿itcoin Therapist expects BTC to establish a new all-time high (ATH) as early as Q1/2026. Even more optimistic, Citigroup analysts have a baseline scenario for Bitcoin’s price at $143,000, while a strong growth scenario could push BTC up to $189,000 in 2026.
So, do Bitcoin and large-cap altcoins have enough momentum to break through the important resistance levels ahead? Let’s analyze the charts of the top 10 cryptocurrencies to find out the answer.
Technical Analysis of BTC
BTC is experiencing intense indecision between bulls and bears around the 20-day exponential moving average (EMA) at $88,439.
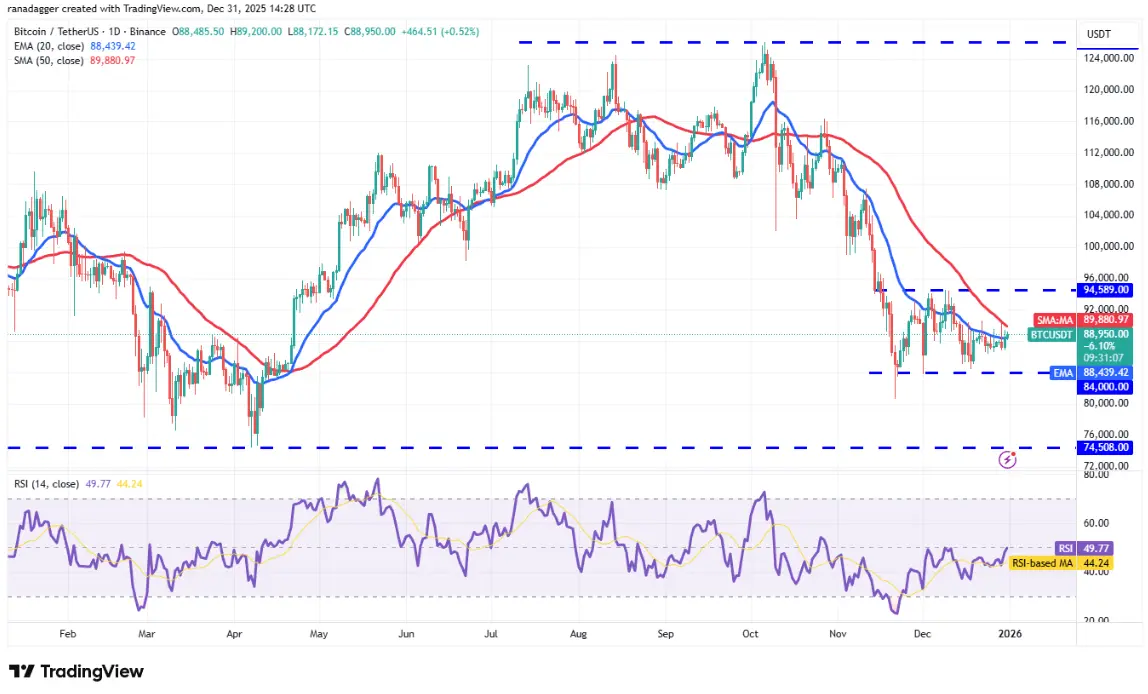 Daily BTC/USDT chart | Source: TradingView. Tight accumulation just below the 20-day EMA increases the likelihood of a breakout above the 50-day simple moving average (SMA) at $89,880. If that happens, the BTC/USDT pair could rise to the upper resistance zone at $94,589.
This is a key level to watch, as a breakout above it indicates the correction phase may have ended. Then, Bitcoin’s price could rise to $100,000 and subsequently to $107,500.
Conversely, if the price sharply reverses downward from the moving averages, it indicates that the bears still control the market. In that case, the risk of falling below the support zone at $84,000 will increase. The next downside target is $80,600, then $74,508.
Technical Analysis of ETH
Ether (ETH) bulls are trying to initiate a recovery by pushing the price above the 50-day SMA at $3,019.
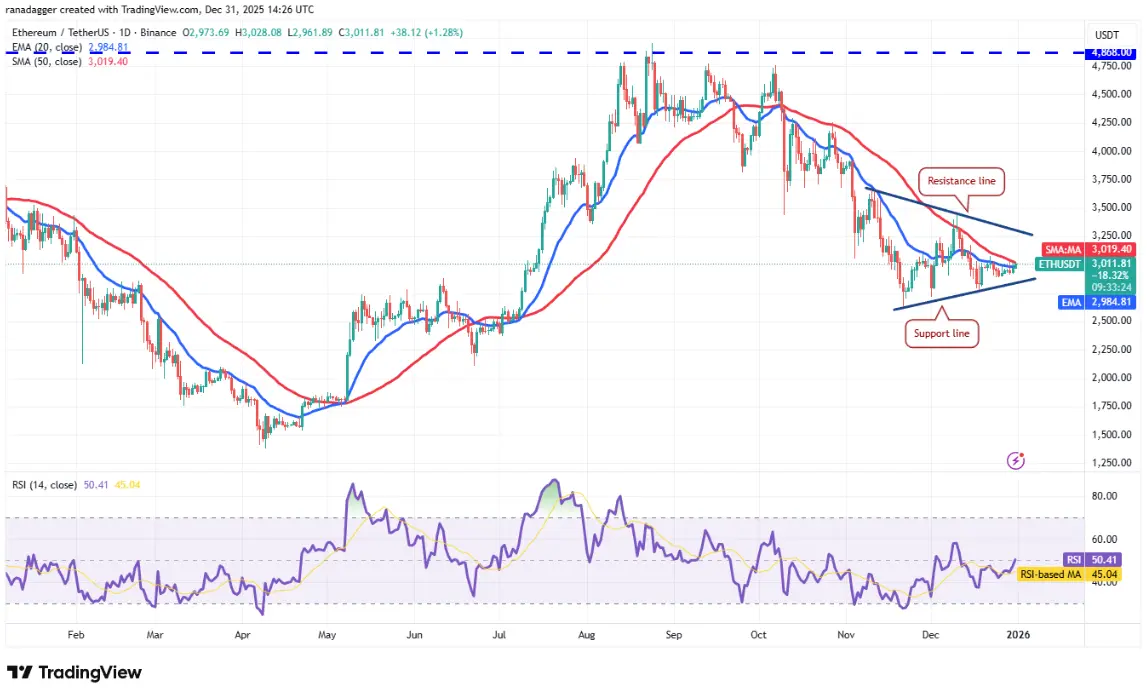 Daily ETH/USDT chart | Source: TradingView. Closing above the 50-day SMA will open the door for a rally toward the resistance line of the symmetrical triangle pattern. Buyers need to push ETH above this resistance to show that the downtrend may have ended. Then, the ETH/USDT pair could target $4,000.
On the downside, $1.61 is an important support level to watch. A close below this level will signal the next leg of the downtrend, and XRP could plunge to the October 10 low at $1.25.
Technical Analysis of BNB
Bulls are trying to push BNB above the 50-day SMA at $876, indicating demand still exists at higher levels.
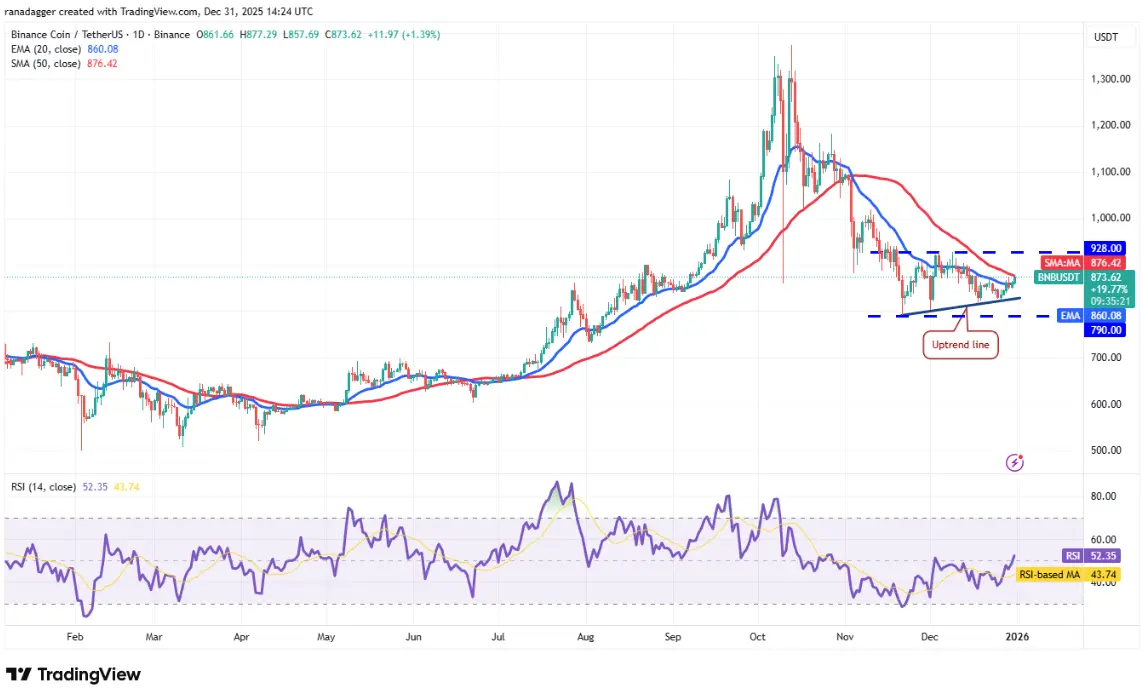 Daily BNB/USDT chart | Source: TradingView. Closing above the 50-day SMA will open opportunities to rise toward the strong resistance at $928. Bears are expected to defend this level vigorously, as a close above it will complete the ascending triangle pattern. Then, the BNB/USDT pair could target the pattern’s objective at $1,066.
Conversely, if BNB price sharply reverses from $928, it indicates that bears remain active at higher levels. The pair could then continue to fluctuate within the $928 to $928 range for a few more days.
Technical Analysis of XRP
Buyers are attempting to start a recovery for XRP by pushing the price above the 20-day EMA at $1.91.
![]$790 https://img-cdn.gateio.im/webp-social/moments-7579642cb1fed07b3342f76794619c1f.webp(Daily XRP/USDT chart | Source: TradingView. If successful, XRP/USDT could rise to the 50-day SMA at $2.04, then to the descending trendline. Bears are expected to defend this trendline vigorously, as a close above it would signal a potential trend reversal. Then, the price could rise to $2.70.
On the downside, $1.61 is a critical support level to monitor. A close below this level will indicate the next leg of the downtrend, and XRP could plunge to the October 10 bottom at $1.25.
Technical Analysis of SOL
Solana )SOL( has been closely following the 20-day EMA in recent days, indicating that bulls are still exerting pressure.
![])https://img-cdn.gateio.im/webp-social/moments-528afa1525c0d979d874ceda0c30ab93.webp$126 Daily SOL/USDT chart | Source: TradingView. If the price closes above the 20-day EMA, the SOL/USDT pair could rise toward the upper resistance zone at $147. There is a minor resistance at the 50-day SMA ($132), but it is likely to be surpassed.
Conversely, if Solana’s price reverses downward from the moving averages, it indicates bears still control the market. Then, the risk of decline will increase, ultimately reaching the important support zone at $95.
Technical Analysis of DOGE
Buyers are struggling to push Dogecoin (DOGE) above the breakout level at $0.13, indicating a lack of demand at higher prices.
![]$108 https://img-cdn.gateio.im/webp-social/moments-c4496a71a702ba49b79c973c237c1bff.webp(Daily DOGE/USDT chart | Source: TradingView. Bears will attempt to drag DOGE below $0.12. If successful, the downtrend could continue, and DOGE/USDT could fall to the October 10 low at $0.10.
Buyers need to quickly push the price above the moving averages to prevent further decline. Then, the pair could rise to $0.19, indicating that the market has rejected the breakdown below the support zone at $0.13.
Related Articles
Analyst: This round of Bitcoin price increase is driven by position resets and reduced supply elasticity
Analysis: Bitcoin bullish sentiment heats up, with $80,000 potentially becoming the next target for this rebound.
Data: 296.74 BTC transferred from an anonymous address to Wintermute, worth approximately 10.78 million USD
Ex-OpenAI Researcher Hedge Fund Bets Big on BTC Miners in SEC Filing