Date: Sun, Dec 21 2025 | 08:56 AM GMT
The broader cryptocurrency market has remained under pressure over the past several weeks, following the sharp sell-off that began on October 10. That corrective phase dragged Ethereum (ETH) down by nearly 23% over the last 60 days and weighed heavily on overall market sentiment. While many altcoins have struggled to stabilize, Quant (QNT) has shown relative resilience, posting only a modest decline and holding above a historically important support zone.
From a technical perspective, the daily chart suggests that QNT may be approaching a critical decision point, with price action forming a recognizable structure that could influence its next directional move.
Source: Coinmarketcap
Head and Shoulders Pattern Takes Shape
On the daily timeframe, QNT appears to be carving out a head and shoulders formation, a well-known pattern that often signals a potential trend shift once the neckline is tested. Earlier in the structure, QNT formed the left shoulder before rallying sharply to its head near the $100 region. From there, price reversed lower and slid back toward the neckline, located around the $70 support zone.
This $70 area has proven to be a strong demand zone in the past, repeatedly attracting buyers and preventing deeper declines. The recent move into this region was met with a noticeable reaction, as reflected by the long lower wick on the chart. That rejection from support pushed price back toward the $78 level, suggesting that buyers are actively defending the neckline and potentially forming the right shoulder of the pattern.
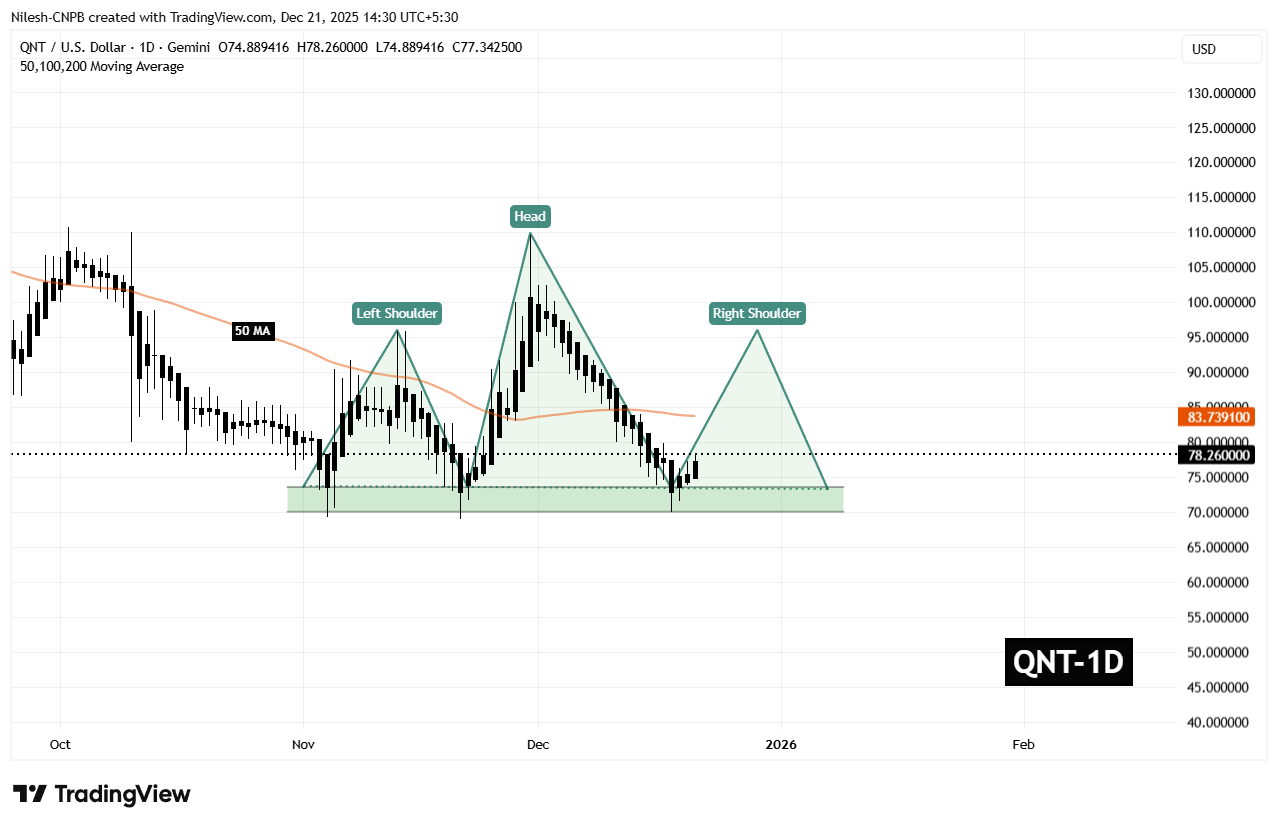
Quant (QNT) Daily Chart/Coinsprobe (Source: Tradingview)
The behavior around this zone is critical. A successful defense of the neckline often opens the door for a relief rally, especially if broader market conditions stabilize.
What’s Next for QNT?
For bullish momentum to build, QNT needs to reclaim the 50-day moving average, currently sitting near $83.73. This level now acts as a key short-term resistance, and a daily close above it would signal a shift in momentum back in favor of buyers.
If that recovery unfolds, the chart points toward a potential move into the $95.90 region. Such a move would represent a rebound of roughly 22% from current levels and align with the typical reaction seen during the right-shoulder phase of this pattern. A rally of this nature would not only ease recent selling pressure but also place QNT back into a more neutral technical posture.
That said, the setup remains delicate. If the $70 neckline support fails to hold on a sustained basis, the head and shoulders structure would remain bearish, opening the door to further downside and extending the corrective phase. For now, all eyes remain on how price behaves around this key support and whether buyers can regain control above the moving average.
Disclaimer: The views and analysis presented in this article are for informational purposes only and reflect the author’s perspective, not financial advice. Technical patterns and indicators discussed are subject to market volatility and may or may not yield the anticipated results. Investors are advised to exercise caution, conduct independent research, and make decisions aligned with their individual risk tolerance.
Disclaimer: The information on this page may come from third parties and does not represent the views or opinions of Gate. The content displayed on this page is for reference only and does not constitute any financial, investment, or legal advice. Gate does not guarantee the accuracy or completeness of the information and shall not be liable for any losses arising from the use of this information. Virtual asset investments carry high risks and are subject to significant price volatility. You may lose all of your invested principal. Please fully understand the relevant risks and make prudent decisions based on your own financial situation and risk tolerance. For details, please refer to
Disclaimer.
Related Articles
Solana price consolidates for nearly four weeks, ETF capital inflows spark market attention
Solana (SOL) price fluctuates between $84 and $85, with strong institutional investor confidence, attracting over $900 million in ETF inflows. Retail investors are more cautious, with open interest in futures contracts down over 6%. Technical analysis shows the price below key moving averages, indicating potential volatility. On-chain user growth is significant; if it breaks above $88, it will challenge the $99 resistance level. Market resilience is strengthening, but attention should be paid to the support level at $77.
GateNews3m ago
Bitcoin and Ethereum ETFs have seen over $9 billion outflow in four months! Institutional funds are withdrawing, shaking confidence in the crypto market?
Recently, over $9 billion has flowed out of U.S. spot Bitcoin and Ethereum ETFs, setting a record. The withdrawal of institutional investors indicates increasing market caution, while the prices of Bitcoin and Ethereum have experienced significant pullbacks. This trend shows that ETF capital flows are an important indicator of institutional sentiment. To achieve a price rebound, stable capital inflows are still needed.
GateNews6m ago
Bitcoin "dead" search volume soars! BTC remains in the $62,000 range after dropping 50%, data reveals the real signal
As Bitcoin prices have fallen from the 2025 all-time high to the range of approximately 62,000 to 70,000, market sentiment has become more pessimistic, and related searches have increased. However, on-chain data, network activity, and institutional participation still show resilience. Market analysis indicates that the volatility is mainly influenced by macro liquidity tightening, with institutions believing that the market structure remains stable and investors continue to focus on the impact of geopolitical events on Bitcoin prices.
GateNews8m ago
The stock market soars, while crypto heats up slowly? Koreans' all-in bets have never cooled down
Written by: Zen, PANews
When it comes to crazy investing, Koreans are serious. The Korean stock market's historic surge that began in the first half of last year once again proves this point.
As of the end of February 2026, the Korea Composite Stock Price Index (KOSPI) has risen nearly 50% this year, making it the top-performing stock market globally.
On February 25, the KOSPI broke through 6,000 points for the first time during trading; the next day, it closed above 6,300 points for the first time, recording gains on 10 of the past 11 trading days and continuously hitting new highs. On February 28, Samsung Electronics' market capitalization surpassed the $1 trillion mark, becoming the first Korean company to join the "trillion-dollar club."
As the founder of the on-chain data analysis platform CryptoQuant said: "We Koreans love to gamble..."
TechubNews14m ago
Cardano (ADA) Price Key Level Revealed: $0.27 Tug-of-War, Upgrades and Capital Flow May Determine March Trend
Cardano (ADA) is currently maintaining a consolidation range, with the price approaching $0.27, and market sentiment leaning bullish. Recent open interest and trading volume have declined, but there has been no panic selling. Technical analysis shows a key support level at $0.2676. If the resistance zone is broken, the target could rise to $0.30. In terms of ecosystem development, cross-chain trading and the launch of the stablecoin USDCx have brought in capital inflows. Several upgrades are scheduled for March, attracting market attention.
GateNews16m ago
Ethereum (ETH) has declined for six consecutive months, setting a recent record. Can the key support level of $1900 hold?
Ethereum (ETH) has been declining for six consecutive months recently, with prices affected by multiple market pressures such as whale fund dispersion, derivatives market sell-offs, and macroeconomic uncertainties. On the technical side, ETH is in a recovery phase, with a key resistance at $2,000 and support at $1,880. Vitalik Buterin stated that AI tools are expected to accelerate Ethereum development and enhance security. Some institutions remain optimistic about ETH's long-term price prospects, with Standard Chartered predicting it could reach $7,500, while VanEck is bullish and expects it to hit $10,000.
GateNews20m ago