
RIVER has had one of the more compelling stories in crypto over the past week. After the recent airdrop and ecosystem announcements, the token attracted strong buying interest. that pushed it well above previous consolidation levels.
Now, as the initial hype settles, The chart is showing something that technical traders love to see: structure. Sjuul from AltCryptoGems indicated the move on X, noting that the RIVER price is still pushing higher after that textbook move. His assessment is simple but meaningful: it is a bullish chart
- The RIVER 12-Hour Chart Reveals Clean Structure
- Current Price Action and Key Levels
- What Comes Next for RIVER
The RIVER 12-Hour Chart Reveals Clean Structure
Looking at the 12-hour chart, the setup is clear. The RIVER price had been trading in a range between approximately $16.00 and $20.00 for several weeks, building a base after the initial launch volatility. The breakout from this range came with the recent airdrop news, pushing the RIVER price above $20.00 for the first time.
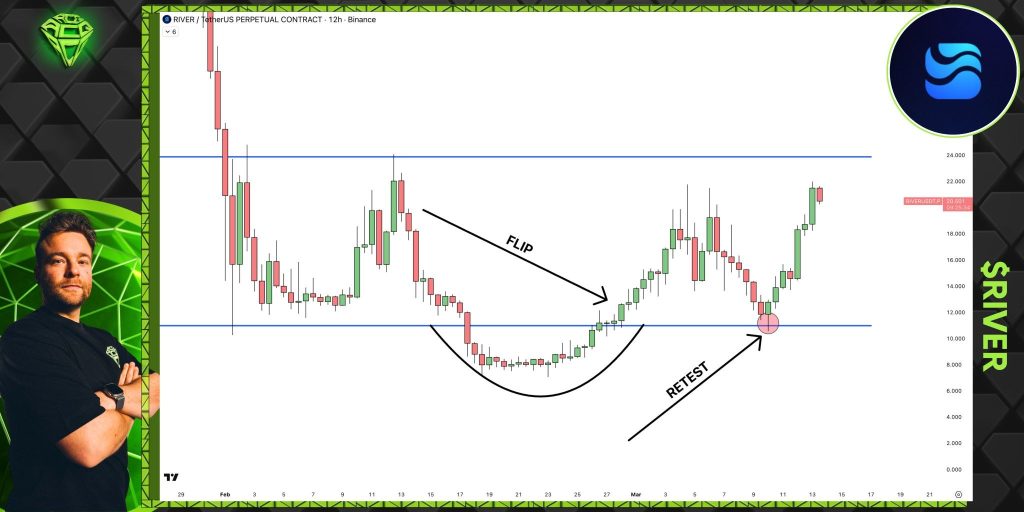
Source: X/@altcryptogems
What matters now is what happened next. Instead of reversing back into the range, the RIVER price held above the breakout level and began consolidating in a new, higher range. This is the textbook behavior that Sjuul references.
The chart labels a clear FLIP level where former resistance near $20.00 has now become support. Below this, a zone labeled RETEST appears, which shows where the price retraced to retest the breakout before proceeding with its uptrend. This shows that buyers are ready to buy the asset.
Current Price Action and Key Levels
The RIVER price currently trades at a level around $20.50, a level slightly above the turned support level. This price move took the token to a new high of around $24.00, a move that indicates the buyers’ commitment to taking River to new heights.
However, the current pullback from the new price high has been minor, and River currently trades significantly above the breakout level. The token currently faces resistance at the fresh price high of around $24.00. If the price breaks through this level, it could target the level of around $26.00 to $28.00.
On the other hand, the turned support level of around $20.00 currently acts as the token’’s initial support level. If the River price fails to stay above the level of $20.00, it could target the level of around $18.50, the former range high.
RIVER needs to stay significantly above the level of $20.00 for the bullish scenario to remain valid. If the price fails to stay above the level of $20.00, the breakout could be a false breakout.
Read Also: The Math Behind XRP Price Hitting $1,000+: Analyst Breaks Down the Numbers
**What Comes Next for RIVER **
The RIVER price now sits at a decision point. The trend still appears to favor the higher end as long as the level of $20.00 acts as support. If the price does rise, the next level to target would likely be around the level of $24.00, and then a breach of that level could lead to the level of $26.00 or more.
On the other hand, a breach of the level of $20.00 could jeopardize the current scenario, potentially taking the price back to the level of $18.50. For now, Sjuul’s assessment holds. The RIVER price is pushing higher after a textbook move, and the bullish structure remains intact.
Aviso: As informações nesta página podem ser provenientes de terceiros e não representam as opiniões ou pontos de vista da Gate. O conteúdo exibido nesta página é apenas para referência e não constitui aconselhamento financeiro, de investimento ou jurídico. A Gate não garante a exatidão ou integridade das informações e não será responsável por quaisquer perdas decorrentes do uso dessas informações. Os investimentos em ativos virtuais apresentam altos riscos e estão sujeitos a uma volatilidade de preços significativa. Você pode perder todo o capital investido. Por favor, compreenda completamente os riscos envolvidos e tome decisões prudentes com base em sua própria situação financeira e tolerância ao risco. Para mais detalhes, consulte o
Aviso Legal.
Related Articles
DWF Labs: A era tradicional de altcoins chega ao fim, capital institucional muda para BTC, ETH e RWA
Andrei Grachev da DWF Labs apontou que a tradicional "temporada altcoin" está desaparecendo gradualmente devido às mudanças estruturais do mercado de criptomoedas, com fundos institucionais preferindo Bitcoin e Ethereum, o que resulta em riscos mais elevados e saída de capital para altcoins. Nos últimos 13 meses, o valor de mercado das altcoins caiu mais de 209 mil milhões de dólares.
GateNews42m atrás
Bitcoin teve uma subida de 8,55% esta semana, potencialmente criando o maior ganho semanal desde setembro de 2025
Gate News notícia, 15 de março, segundo dados da Coinglass, a taxa de retorno semanal do Bitcoin está atualmente em 8.55%, enquanto a taxa média histórica é de -1.03%. Apesar da intensificação contínua da guerra entre EUA e Irão, e do sentimento de aversão ao risco no mercado, o Bitcoin esta semana poderá registar o maior ganho semanal desde setembro de 2025. No mesmo período, o índice S&P 500 (índice de referência do mercado de ações dos EUA) caiu 1.60%, e o desempenho do BTC superou claramente as ações americanas.
GateNews49m atrás
IA Prevê Para Onde o Preço de ADA se Dirige a Seguir Após a Reviravolta Técnica da Cardano
Algo mudou recentemente no gráfico de 4 horas da Cardano. O preço de ADA subiu 1,61% nas últimas horas, fechando em $0,2649. Mais importante ainda, quebrou acima de duas médias móveis principais, e a ferramenta de IA utilizada por um analista bem conhecido da comunidade acabou de ficar positiva.
Vincent van Code, um software
CaptainAltcoin1h atrás
Atualização do Mercado Cripto – River e DeXe Lideram Ganhos Enquanto Memecoins Políticas Provocam Volatilidade
O mercado de criptografia tem continuado a sofrer mudanças rápidas e picos temporários em sectores específicos do que muitos outros mercados durante o seu período de consolidação mais recente. O gráfico "Gainers" na CoinMarketCap é frequentemente analisado para identificar tendências que se correlacionam com principais activos de criptografia como Bitcoin e
BlockChainReporter2h atrás
