MasterChuTheOldDemonMaster

vip
Age 0.4 Yıl
Peak Tier 6
No content yet
🚨【2000 Defense Battle Turns into a "Tiring Game," History Does Not Repeat!】
Quick Market Overview: On April 3rd, ETH was weakly oscillating around $2050 . The V-shaped reversal caused by the "whale bottom-fishing" in February did not occur, and the market has shifted into a "gradual decline + geopolitical disturbances" bottoming pattern.
🔥 Key Signal Analysis:
1. Smart Money Has Not Left but Is Hesitant: On-chain data shows exchange ETH balances hitting a record low (about 11%), whales are accumulating but not pushing prices up, liquidity is locked by geopolitical risks (US-Iran tensions).
2
ETH0,43%
View Original
post-image
post-image
MasterChuTheOldDemonMasterChuvip
【Decisive Battle at 2000! Whale Accumulation Signal Has Appeared, Is This the Last Bus?】
Quick Market Overview: After a bloodbath on February 5th, ETH found support at the critical level $2000 and rebounded near $2050 . This is not only a technical defense line but also the ultimate battleground for bulls and bears!
🔥 Key Signal Analysis:
1. Smart Money Moves: On-chain confirmation shows whales are heavily accumulating around the $2000 level. Big players are starting to buy the dip—are you following?
2. Strong Rebound Momentum: Ethereum’s Beta is high; rebounds tend to be more vigorous than Bitcoin’s, making this the moment to verify.
3. Technical Oversold Recovery: Daily indicators have risen from extreme oversold zones, indicating short-term rebound demand.
🎯 Two possible outcomes, must choose one:
• Bullish Scenario: Stabilize above $2000 and break through $2100 with increased volume, confirming a short-term bottom, targeting above $2200 . Strategy: Enter with a small position at current prices, try long positions, and set a strict stop-loss below $1950.
• Bearish Scenario: Rebound falters, and if it drops below $2000 again, a new downtrend begins, directly testing the $1800–$1900 abyss. Strategy: Stop-loss immediately if it drops, avoid catching the falling knife.
💎 Core Conclusion:
Currently, the rebound is just a technical correction; the real trend signal is whether it can hold above $2100. We are at a critical decision point—either break through and chase the rally or fall below and run fast. The market waits for no one—don’t wait to pat yourself on the back after the price has already gone up!
⚠️ Reminder: The market is ever-changing; the above analysis is for reference only. Investment involves risks—please make independent decisions and strictly control your positions. #ETH$ETH #当前行情抄底还是观望?
repost-content-media
  • Reward
  • 20
  • Repost
  • Share
Sakura_3434vip:
坚定HODL💎
View More
"The script of 'Fear in others, greed in me' has changed this time—the institutions are sweeping the market, retail investors are cutting losses 😅
------
📉 Regarding that '12 points'
This score is equivalent to the market's 'ICU heartbeat monitor'—
Everyone online is shouting 'This is really the end,' with panic reaching the extreme.
But historical experience shows: extremely low scores are often not the start of a collapse, but a signal of a phase bottom 🧭
------
🐋 About 'Smart Money'
What you see as 'coin prices falling' is retail investors cutting losses and exiting,
While 'institutions
GT-0,95%
ETH0,43%
BTC-0,09%
View Original
post-image
post-image
xxx40xxxvip
Fear Index at 12: Every Major Coin Is Red — But the Smart Money Is Buying
The screen does not lie. Bitcoin -1.61%. Ethereum -3.33%. Solana -5.84%. The Crypto Fear and Greed Index is locked at 12 out of 100 — deep inside Extreme Fear territory. And yet, institutions are quietly moving billions in the opposite direction.
That contradiction is exactly where the real story begins.
———
What the Top Coins Are Telling Us
Bitcoin ($66,985 | -1.61%) is compressing, not collapsing. The 24-hour range held between $65,712 and $68,643. MetaPlanet has cemented its position as the third-largest corporate BTC holder. Institutions are accumulating. Retail is selling. Two completely different games on the same board.
The BTC sentiment breakdown adds texture: 79 bullish voices against 61 bearish in the last 24 hours — but the majority of tracked participants have not yet committed to a side. The hesitation itself is a signal.
Ethereum ($2,058.62 | -3.33%) dropped while BlackRock-linked entities moved over $30 million in ETH through Coinbase Prime on the very same day. EthCC is live in Cannes with staking, AI, and RWA dominating the agenda. The price fell. The conviction did not.
One number deserves attention in the ETH sentiment data: 33 bearish authors vs. 26 bullish. Short-term pressure remains intact — but institutional accumulation at this level historically compresses the downside.
Solana ($78.99 | -5.84%) is taking the sharpest hit among large caps — the typical pattern when risk appetite contracts fast. BNB ($581.10, -5.17%), XRP ($1.305, -3.26%), ADA ($0.2398, -3.88%), DOGE ($0.09007, -2.74%), and LINK ($8.58, -4.32%) followed in sequence. Nearly everything in the top 20 closed red. The only exceptions were stablecoins.
———
Capital Does Not Disappear. It Rotates.
While the market bled, a handful of assets moved violently in the opposite direction:
| Coin | 24h Change (Updated) |
|------|----------------------|
| Cartesi (CTSI) | +85.82% |
| Neutron (NTRN) | +75.13% |
| FIDA | +37.32% |
CTSI stands out beyond the daily move: +80.22% over 7 days, +65.88% over 30 days. This is not a pure spike — it reflects structural momentum building beneath the surface.
On the other end, DRIFT fell -7.27% in the last 24 hours — but the deeper damage is visible in the weekly and monthly data: -27.23% over 7 days and -45.07% over 30 days, consistent with the aftermath of the Drift Protocol exploit. In DeFi, a trust event is always harder to recover from than a liquidity event.
———
The Signal Hidden in Stablecoins
USDC and USDe market caps are unchanged — and still growing. When stablecoin dominance expands during a broad selloff, the message is clear: capital is not exiting crypto. It is parking. Waiting. That idle liquidity represents the next wave of buying power, and it moves fast when sentiment shifts.
———
What a Fear Index of 12 Actually Means
Markets at this reading are emotional. Emotional markets misprice assets — in both directions. A score of 12 does not guarantee a recovery. But structurally, today's data shows:
• Institutions buying ETH while retail exits
• Bitcoin compressing inside a defined range
• Stablecoins growing, not leaving
• Selective altcoins posting 37–86% moves in the same session
This market is not broken. It is bifurcated.
The macro headwinds — inflation expectations, energy prices, geopolitical uncertainty — are real and not resolving this week. But the history of markets that recovered from Extreme Fear readings is consistent: the turn comes without warning, and it comes sharp.
Until then, Fear Index 12 means one thing with certainty: the market is mispricing something. The only question is which side of that mispricing you are standing on.
———
All data sourced live from gate.com — April 2, 2026, 19:23 UTC. For informational purposes only. Not financial advice.
$BTC $ETH $SOL
#CryptoMarketSeesVolatility #AreYouBullishOrBearishToday? #CryptoSurvivalGuide #CreatorLeaderboard #GateSquare
repost-content-media
  • Reward
  • 20
  • Repost
  • Share
AdEmKvip:
LFG 🔥
View More
🔔 Good Friday, the crypto market does not take a holiday! 🔔
Today is April 3, 2026, Good Friday.
✅ Traditional markets: U.S. stocks, European stocks, CME futures, and others are all closed. Major institutional fund channels are temporarily shut down.
✅ Crypto market updates: The crypto market operates year-round, 24/7!
• Including this platform, the global crypto markets, spot and contract trading services are all functioning normally.
• Blockchain networks and on-chain activities (such as DeFi, transfers) are unaffected by holidays.
⚠️ Impact notice: Due to the closure of traditional financ
View Original
post-image
  • Reward
  • 20
  • Repost
  • Share
Sakura_3434vip:
To The Moon 🌕
View More
April Pocket Money Plan! Come chat at Gate Square, grab red envelopes and goodies until you're overwhelmed!
Family members, don’t just lie flat in April! That super popular posting challenge at Gate Square is back! Start!
Honestly, after hanging out in the community for so long, I have to give a thumbs up to the atmosphere at Gate Square—fast news, lots of experts, fun chatting. It’s not an exaggeration to call it the “strongest vibe group” in the crypto circle, right? This April event is basically a gift for us. Whether you’re a veteran or a newbie just starting out, as long as you have hands
GT-0,95%
ETH0,43%
BTC-0,09%
View Original
post-image
  • Reward
  • 29
  • 1
  • Share
GateUser-68291371vip:
Vibe at 1000x 🤑
View More
The Final Negotiation in the Strait of Hormuz
The crisis in the Strait of Hormuz, as the core of US-Iran tensions, has severely disrupted global energy flows since February 2026. Iran has effectively closed the strait or imposed strict restrictions on passage. #AprilMarketOutlook Reports indicate that each ship is charged #四月行情预测 million in transit fees (, affecting approximately 20% of global oil trade. Recent developments over the past 24-48 hours show a mix of optimistic signals and deep contradictions regarding a ceasefire and negotiations to reopen the strait. However, inconsistencies i
View Original
User_anyvip
#AprilMarketOutlook
#四月行情预测
Final Negotiations in the Strait of Hormuz
The Strait of Hormuz crisis, at the heart of the US-Iran tension, has severely disrupted global energy flows since February 2026. Iran's de facto closure of the strait or heavy restrictions on passage (with some reports alleging a $2 million transit fee per ship) have affected approximately 20% of global oil trade. Developments in the last 24-48 hours reveal both optimistic signals and deep contradictions in negotiations for a ceasefire and the reopening of the strait. However, the inconsistencies in the statements of the parties indicate that any concrete agreement is still a long way off.
US President Donald Trump stated on March 31, 2026, that US military operations in Iran could end "within 2 to 3 weeks." Trump emphasized that the security of the strait was no longer the responsibility of the US, but should be undertaken by "the countries using the strait," criticizing allies (especially European countries and NATO) by telling them to "take your own oil." While the White House claims that “serious talks” are ongoing with Iran and that “great progress” has been made, it is alleged that Trump has had indirect contacts with Iranian Parliament Speaker Mohammad Bagher Ghalibaf.
On the other hand, the Iranian side is responding with a clear rejection. Tehran repeatedly emphasizes that it is not conducting any formal negotiations with the US. The Iranian Revolutionary Guard announced that it is turning back ships attempting to pass through the strait and will respond harshly. President Masoud Pezeshkian stated that they are “ready to end the war,” but that this is only possible with “concrete guarantees that will guarantee the security and interests of the Iranian people.” Pezeshkian also demanded guarantees against future attacks during a meeting with the President of the European Council. Iranian officials state that they have rejected the US’s 15-point proposal and will not compromise on their sovereign rights over the strait.
The latest situation in the negotiations can be summarized as follows:
- US side: Indirect messaging and claims of “progress”; Trump’s recent statement signals that operations may end soon.
- Iranian side: No official talks, just a message of “we are ready but we want guarantees.”
- Third parties: There are reports of Pakistan, China, and some European countries playing a mediating role, but no concrete progress has been publicly disclosed. - The situation of the Strait: It is still largely closed or heavily restricted; neither the US nor Iran has taken concrete steps towards a full opening.
Analysts interpret Trump's approach of "leaving the Strait to others" as a "post-war withdrawal" strategy, while warning that geopolitical risk will continue. Experts state that attempts to forcibly reopen it (including ground operations) could have very dangerous consequences and that diplomacy is the only realistic way. At this stage, with both sides maintaining their positions, the possibility of a permanent ceasefire or the liberalization of the Strait in April remains uncertain.
**This is in no way investment advice, market forecast, or endorsement.** Events can change rapidly; contradictory statements and uncertainties can lead to new developments at any moment. Approaching geopolitical issues cautiously and with distance, conducting your own independent research, and following official sources is always the most accurate approach. I recommend that you personally follow current developments.
repost-content-media
  • Reward
  • 47
  • 1
  • Share
Luna_Starvip:
Ape In 🚀
View More
[Incredible Plot! Ceasefire Signal = Golden Skyrocket?]
First, Trump "keeps it brief," then Iranian President "says we can talk," and the global markets immediately perform a magical scene: no more fighting, gold soars $156 in one day! 😱
I really can't understand this risk-avoidance logic:
• During war: prices fall! Fear of inflation and rate hikes.
• When ceasefire occurs: prices rise! Celebrating world peace?
So gold is the "peace dove," and once released, it becomes valuable? 🤔
I suggest Goldman Sachs and BMI analysts have a fight first—one says it can reach 5400, the other says an averag
View Original
post-image
post-image
post-image
Ryakpandavip
#创作者冲榜 Trump and the Iranian president signal a ceasefire! Gold prices surge by $156
On Tuesday, March 31, (, spot gold prices soared over 3%, marking the third consecutive day of gains. Both U.S. President Trump and Iranian President Ebrahim Raisi have issued signals of a ceasefire, which has driven gold prices higher. Additionally, the decline in the dollar and U.S. Treasury yields has supported gold prices.
Spot gold closed Tuesday up $156.15, a 3.46% increase, at $4,666.83 per ounce.
FXStreet analyst Christian Borjon Valencia pointed out that easing war concerns boosted demand, with gold prices surging 3% on Tuesday. Previously, Iranian President Ebrahim Raisi)Masoud Pezeshkian( hinted that the regime is ready to end the war.
Furthermore, falling U.S. Treasury yields and a softer dollar also provided strong support for gold prices.
Peter Grant, Vice President and Senior Precious Metals Strategist at Zaner Metals, said, “The current rally in gold is encouraging, as market optimism about easing Middle East tensions is growing. However, to establish a sustained upward trend, we need to see more robust gains.” Grant added, “In the long term, the fundamental trend for gold remains bullish, supported by key factors such as de-dollarization and central bank buying.”
The Wall Street Journal, citing government officials, reported that U.S. President Donald Trump) is willing to end military actions against Iran even if the Strait of Hormuz remains under blockade. Due to concerns that Middle East conflict could push oil prices higher and fuel inflation, markets are reassessing Federal Reserve rate outlooks, leading to an 11.8% plunge in March spot gold prices. While gold is typically used to hedge against uncertainty and inflation, rising interest rates increase the opportunity cost of holding gold. BMI maintains its forecast of an average gold price of $4,600 per ounce in 2026, while Goldman Sachs predicts gold could reach $5,400 per ounce by the end of 2026.
Trump and the Iranian president both signal a ceasefire. The Wall Street Journal reported Tuesday that U.S. officials revealed that President Trump told his aides he is willing to end U.S. military actions against Iran even if the Strait of Hormuz remains largely closed. This move could prolong Tehran’s firm control over the waterway and delay the complex process of reopening the strait to a later time. The report noted that recently, Trump and his aides assessed that forcibly opening this strategic passage would extend conflict beyond the four to six-week timeline he has set. The WSJ reported that Trump has decided that the U.S. should aim to weaken Iran’s navy and missile stockpiles gradually, ending current hostilities while applying diplomatic pressure on Iran to restore free trade. Officials said if this strategy fails, Washington will pressure European and Gulf allies to lead efforts to reopen the strait. They added that Trump could also opt for a military solution, but this is not his current priority.
Iranian President Ebrahim Raisi said on Tuesday local time that Iran has the “necessary willingness” to end the war, provided the other side meets Iran’s demands, especially guarantees of non-aggression. According to Iran’s Mehr News Agency, Raisi stated during a phone call with European Council President Charles Michel that a normalizing solution involves stopping U.S. and Israeli aggressive attacks. Raisi reiterated that Iran has never sought escalation or war at any stage and “has the necessary willingness to end this war.” FXStreet analyst Christian Borjon Valencia noted that speculation about a possible easing of tensions has prompted traders to buy gold, while falling U.S. Treasury yields further boosted gold prices. The yield on the 10-year U.S. Treasury fell 4 basis points to 4.31%, weakening the dollar; the dollar index(DXY) declined 0.58% to 99.91. When the dollar strengthens, gold priced in dollars becomes more expensive for investors holding other currencies.
Aside from geopolitical factors, U.S. data shows the labor market is weakening, as reflected in the Job Openings and Labor Turnover Survey(JOLTS). In February, job openings fell to 6.882 million, down from 7.24 million and below the market expectation of 6.92 million.
Gold trading analysis: Valencia said that gold has successfully broken above the key resistance at the 100-day simple moving average(SMA) of $4,617. The Relative Strength Index(RSI) indicates that as the indicator approaches neutral levels and trends upward, bullish momentum is strengthening.
Valencia stated that if gold breaks through the $4,700 per ounce level, the next resistance will be at $4,800, followed by the 20-day simple moving average at $4,820. Once it surpasses $4,900, attention will turn to the 50-day simple moving average at $4,952. He added that if gold fails to stay above $4,600, it could retest the March 26 intraday low of $4,351. If this low is broken, there will be little significant support below, and gold could head toward the 200-day simple moving average at $4,106.
repost-content-media
  • Reward
  • 55
  • Repost
  • Share
Luna_Starvip:
Ape In 🚀
View More
#PowellDovishRemarksReviveRateCutHopes
1/ What exactly happened?
Iran's Revolutionary Guard (IRGC) has officially begun charging tolls of up to $2 million per voyage on commercial ships and oil tankers passing through the Strait of Hormuz. The Strait of Hormuz is widely regarded as the world's most critical oil chokepoint. What started as informal and temporary "protection fees" collected by the IRGC has gradually evolved into a formal legislative act by the Iranian parliament. This move is significant—it indicates that Iran is taking full control of one of the world's most important maritim
BTC-0,07%
ETH0,49%
TRX-0,06%
View Original
HighAmbitionvip
#PowellDovishRemarksReviveRateCutHopes
1/ What Actually Happened?
Iran’s Revolutionary Guard Corps (IRGC) has officially begun charging commercial vessels and tankers up to $2 million per voyage to transit the Strait of Hormuz, which is widely recognized as the world’s most critical oil chokepoint. What started as an informal and ad-hoc collection of “protection fees” by the IRGC is now being formally codified into law by Iran’s parliament. This move is highly significant — it signals that Iran is asserting full control over one of the world’s most important maritime trade arteries and is creating a consistent revenue stream from international shipping.
2/ Why the Strait of Hormuz Is So Critical
The Strait of Hormuz is not just a narrow waterway; it is the lifeline of global energy markets. Approximately 20–21% of all global oil exports pass through this narrow channel, connecting the Persian Gulf to the Arabian Sea. Saudi Arabia, UAE, Kuwait, Iraq, and Qatar all rely on this route for their energy exports. Any disruption in Hormuz can instantly ripple across the global economy, triggering spikes in oil prices and raising fears of supply shortages. Alternative pipelines and ports exist, but they are already operating at full capacity, leaving little room for rerouting large volumes of oil. The world simply cannot bypass Hormuz at scale, which makes any formal toll or restriction there a matter of global economic consequence.
3/ The Fee Structure and Compliance
Under the new system, ships are being charged up to $2,000,000 per voyage. Iran is accepting payments in Chinese Yuan, Iranian Rial, or USDT on the Tron network, which is a landmark moment for the real-world adoption of stablecoins in high-stakes, geopolitical transactions. Ships are also required to provide detailed documentation, including crew lists, cargo manifests, and full voyage plans, which the IRGC reviews before granting passage. Enforcement remains selective for now, but the clear message is that Iran is laying the groundwork for state-backed toll collection that will persist over time.
4/ Immediate Impact on Shipping
The effects on shipping have been dramatic. Tanker traffic through the Strait of Hormuz has fallen by 70–80%, leaving hundreds of vessels waiting outside the strait. Insurance costs have surged, with Lloyd’s of London adjusting war-risk premiums accordingly. Alternative routes, including the Saudi East-West pipeline and UAE’s Fujairah terminal, are already at full capacity, which leaves no immediate buffer for diverted traffic. At least two vessels are confirmed to have paid the toll in Chinese Yuan, signaling early compliance and acceptance of the new regime.
5/ India’s Response
India managed to secure passage for four LPG vessels, but its stance remained firm:
“International law guarantees freedom of navigation. No state can legally levy fees on an international strait.”
Despite this strong position, India had to negotiate safe passage for the vessels, highlighting the complex interplay between international law and local enforcement in high-tension geopolitical areas.
6/ Iran’s “Hormuz Law”
Iranian lawmakers, including Mohammadreza Rezaei Kouchi, confirmed that the parliament is moving to formalize sovereignty and oversight over the Strait of Hormuz while simultaneously creating a massive revenue stream. The estimated annual revenue from this toll could exceed $100 billion, marking a transformative change from ad-hoc IRGC collection to a structured state-sanctioned system. This is a clear signal that Iran views control over Hormuz not only as a strategic leverage point but also as a significant economic asset
7/ Oil Market Implications
Brent Crude is hovering around $100–112 per barrel as the market reacts to the growing tensions. EY-Parthenon forecasts an average of $88 per barrel for Q2 2026, approximately $20 higher than pre-conflict levels. Wall Street’s Fear Index (VIX) surged to 31, reflecting heightened risk perception across markets. Analysts describe the situation as a “multidimensional disruption”, simultaneously affecting crude refining, LNG shipments, and global logistics. This is not a temporary spike; the disruption is structural until the geopolitical situation stabilizes.
8/ Crypto Market — Short-Term Bearish Pressures
High oil prices and geopolitical risk are weighing on crypto markets. Persistent inflation and delayed Fed rate cuts are reducing liquidity, leading investors to sell risk assets including crypto. Bitcoin currently trades around $67,348, down 24% over the past 90 days. Ethereum is at $2,053, down 31% over the same period. The Fear & Greed Index sits in the Extreme Fear zone, reflecting investor anxiety. Leveraged positions are being liquidated, and altcoins are experiencing sharper declines than BTC, which is typical during periods of heightened macroeconomic and geopolitical stress.
9/ Crypto Market — Long-Term Bullish Catalysts
Despite short-term headwinds, several structural drivers remain positive for crypto. Bitcoin is increasingly behaving like digital gold, maintaining relative strength versus altcoins during oil price spikes. Stablecoins, particularly USDT, have gained unprecedented real-world validation, as Iran is collecting transit fees in USDT on the Tron network. This demonstrates stablecoins’ potential as critical infrastructure for cross-border payments and geopolitical trade settlements. Furthermore, de-dollarization trends are accelerating, with Yuan and crypto becoming preferred over the US Dollar in strategic transactions. On-chain metrics indicate that long-term holders are accumulating rather than selling, suggesting smart money positioning for the next macro cycle.
10/ The Trump Factor
Trump recently announced that Iran allowed 10 tankers through the Strait of Hormuz as a “gift” to the US, which briefly eased oil prices. This indicates that backchannel diplomacy is at work. Full blockade or confrontation is not in Iran’s immediate interest, as the state prioritizes stable revenue from toll collection over outright conflict.
11/ Scenarios Going Forward
Looking ahead, three scenarios seem plausible. The base case, with simmering tensions and selective fee collection, has a 65% probability, likely keeping BTC in the $66k–$71k range and oil elevated, with crypto trading in a sideways grind. The bull case, where US-Iran diplomacy eases the crisis, has a 25% probability, which could trigger a risk-on rally with BTC climbing above $75k and altcoins rotating upward. Finally, the bear case, involving full escalation or a blockade of Hormuz, carries a 10% probability, potentially causing oil to spike parabolically and crypto to experience a sharp short-term decline before any relief rally emerges.
12/ Key Crypto Watchpoints
Investors should closely monitor live tanker AIS traffic data, Brent Crude price trends, and Fed rate cut signals, as these will directly influence crypto liquidity. Tracking USDT Tron network volume can provide insights into stablecoin adoption in geopolitical transactions. Additionally, Bitcoin dominance, currently around 58% and trending upward, indicates that altcoins remain weaker, which is important for positioning within the market.
13/ Final Word
Iran has effectively turned the world’s most critical oil chokepoint into a state-controlled toll booth, accepting payments in USDT and Yuan. Geopolitical upheaval is a stress test for crypto markets, yet Bitcoin remains resilient, stablecoins are being used in real global trade, and long-term investment theses remain intact. Short-term volatility is inevitable, but structural trends for crypto adoption and institutional integration continue unabated.
repost-content-media
  • Reward
  • 53
  • Repost
  • Share
Luna_Starvip:
Ape In 🚀
View More
ETFs Have Freed Cryptocurrency — Or Taken Over It?
Wall Street didn't knock on Bitcoin's door. It opened a door — not to let Bitcoin in, but to take control of it.
When Satoshi Nakamoto published the white paper in 2008, it was more than just a definition of currency. It was a declaration: "A peer-to-peer electronic cash system that requires no trusted third party." Sixteen years later, the world's largest asset manager, Blackstone, built an ETF based on this declaration — and put its own logo on it. The market calls it "mass adoption."
This article will explore what this decision really means
BTC-0,07%
ETH0,49%
SOL-0,03%
View Original
post-image
post-image
xxx40xxxvip
Have ETFs Freed Crypto — or Taken It Over?
Wall Street didn’t break Bitcoin’s door. It opened its own — not to let Bitcoin in, but to gain control.
When Satoshi Nakamoto published the whitepaper in 2008, it wasn’t just a currency definition. It was a manifesto: “an electronic payment system without relying on trusted third parties.” Sixteen years later, the world’s largest asset manager, BlackRock, built an ETF on top of that manifesto — stamped with its own logo. And the market called it “mass adoption.”
This article asks what that decision really means.
———
The Numbers Are Dazzling — But What Do They Really Say?
January 2024. After years of resistance, the SEC approved spot Bitcoin ETFs. The market celebrated. First weeks broke records. First months made history.
By 2025:
BlackRock’s IBIT fund alone reached $103B AUM
Total Bitcoin ETF market exceeded $150B
IBIT controls 61% of all Bitcoin ETFs
Total capital flowing into Bitcoin ETFs in 2025: $732B
Institutional investors hold 31% of known Bitcoin supply
These figures read like a success story — and partly they are. But they also tell another story: one-fifth of Bitcoin’s circulation is now locked in institutional ETF structures.
———
Look Behind the “Mass Adoption” Slogan
Crypto communities waited for years: “Let institutional money come, price rises, we all profit.” That expectation happened — literally. Money arrived. Prices went up. And at the same time, a corporate backbone embedded itself at the center of the market.
At its core, an ETF gives exposure to Bitcoin — but not ownership. Investors do not hold the coins. No wallet. No private keys. It’s outside the original “be your own bank” promise.
Satoshi solved the problem of trustless ownership. ETFs reintroduced the intermediary — not a bank this time, but BlackRock.
Even Bloomberg senior ETF analyst Eric Balchunas admits: “Bitcoin’s high volatility and risk didn’t change with ETF entry.” ETFs didn’t stabilize the market. They added a layer — whose keys are held by institutional managers.
———
Wall Street Has Played This Game Before
1971. The U.S. dollar left the gold standard. Everyone in the system, unsure of gold, held dollars instead. Today, much of the world is in debt denominated in USD.
1972. SPDR Gold Shares launched. Investing in gold became easier. Today, most global gold holdings are not physical — they exist on paper.
Now, 2024–2025. Bitcoin ETFs launch. Crypto becomes more accessible. Institutional money flows. And the circulation of actual Bitcoin gradually shrinks.
Pattern familiar? Wall Street doesn’t change the asset. It builds a layer around it — and over time, that layer becomes the asset in practice.
———
Are ETF Advocates Wrong?
No. This question isn’t “are ETFs bad?” — it’s “what do ETFs really do?”
Arguments in favor:
1. Liquidity & Access: Most retirement funds, university endowments, and insurance companies cannot hold Bitcoin directly. Regulations prevent it. ETFs allow these institutions to enter — a real milestone for Bitcoin’s legitimacy.
2. Institutional Trust: BlackRock and Fidelity entering the market proves Bitcoin is beyond “scam” or “temporary bubble.” Not symbolic — large funds with risk models taking positions is a tangible sign of maturity.
3. Price Discovery: Institutional money increases market depth, which resists manipulation. According to 2025 data, 80% of Morgan Stanley clients buy crypto ETFs on their own initiative — showing demand is organic.
But here’s the catch: does ease of access replace true ownership?
———
The New Enemy of Decentralization: Centralized Liquidity
The Bitcoin protocol hasn’t changed. Blocks continue, halving cycles continue, node networks grow. In that sense, Bitcoin isn’t “taken over.”
But market perception, price formation, and institutional weight have centralized. This difference is more critical than it appears.
Consider: if BlackRock faces a serious liquidity issue tomorrow — and as of March 2026, the firm blocked $1.2B withdrawal requests from private credit funds — this crisis would directly affect Bitcoin’s price. A corporate balance problem, unrelated to the protocol, triggers sell-offs.
This is a new systemic risk — one that didn’t exist pre-ETF.
———
What Would Satoshi Say?
This question deserves attention.
The Bitcoin whitepaper begins: “Commerce on the Internet has come to rely almost exclusively on financial institutions serving as trusted third parties.” Satoshi identified this as a problem.
Today, an IBIT investor accesses Bitcoin not through a bank, but through BlackRock. The trusted third party hasn’t disappeared — only the name changed.
Disappointing? Perhaps. But perhaps inevitable.
History shows disruptive systems either integrate into the mainstream or remain marginal. The internet became dominated by corporations — yet it wasn’t destroyed. It created a broader user base. The same dynamic may now be happening with crypto.
———
Conclusion: Two Cryptos Coexist
Fact: Two separate crypto ecosystems operate in parallel today.
1. The world of ETFs and institutional portfolios: price tracking, risk managed, integrated with traditional finance. Liquid, growing, powerful.
2. The world of wallet holders, node operators, DeFi users, and those living by “not your keys, not your coins.” Smaller, but carrying the spirit of the protocol.
ETFs haven’t freed crypto. But they haven’t taken it over — yet.
What they did: split crypto into two layers. The upper layer speaks Wall Street’s language. The lower layer still speaks Satoshi’s.
The real question: how will these two layers shape each other?
———
The real danger isn’t the existence of ETFs — it’s the community ignoring this divide.
———
Data Sources: Chainalysis, Bloomberg ETF Analytics, BlackRock Q4 Report, Morgan Stanley Digital Assets Summit 2026, Ainvest Institutional Crypto Report 2025
$BTC $ETH $SOL
#GateSquare #创作者冲榜 #内容挖矿 #Gate广场 #CryptoMarketsRiseBroadly
repost-content-media
  • Reward
  • 38
  • 1
  • Share
Luna_Starvip:
Ape In 🚀
View More
Why did Trump suddenly call for a halt?
Thirty-two days after the start of the war, Trump suddenly said, "We’re about to negotiate peace."
That sounds a bit familiar—he said the same on the first day of the war.
But this time, it’s different.
Because numbers don’t lie.
A set of figures that make the White House uneasy:
First, look at the polls.
A joint survey by Reuters and Ipsos released on March 24th shows these numbers:
Overall approval rating: 36%—the lowest since he returned to the White House
Economic satisfaction: 29%—the worst during his two terms, even lower than when
View Original
post-image
post-image
Ryakpandavip
Why did Trump suddenly call a halt?
Thirty-two days after the start of the war, Trump suddenly said, "We’re about to negotiate peace."
That sounds a bit familiar—he said the same thing on the first day of the war.
But this time, it’s different.
Because numbers don’t lie.
A set of numbers that make the White House uneasy
First, look at the polls.
A joint survey by Reuters and Ipsos released on March 24th shows these figures:
Overall approval rating: 36%—the lowest since he returned to the White House
Economic satisfaction: 29%—the worst in both terms, even lower than during Biden’s worst days
Support for the Iran war: 35%—61% of Americans say "I don’t support"
Cost of living approval: 25%—a core promise of Trump’s 2024 campaign
Numbers are cold, but behind them is the real temperature of public opinion.
Since the war began, Americans’ expressions at gas stations about oil prices are probably as tense as watching a stock market crash.
More troubling for the White House: the financial ledger
War costs money.
How much exactly? Cross-referencing several data points:
Think tank CSIS estimates about $900 million per day
The Pentagon admits: nearly $1 billion daily
Democratic lawmakers reveal: $11.3 billion spent in the six days before the war
Latest Pentagon budget request: over $200 billion
Let’s do some simple math:
32 days × $900 million per day ≈ about $288 billion
What’s that concept?
A Ford-class nuclear-powered aircraft carrier costs about $130 billion.
So, after 32 days of fighting, they’ve burned through more than two carriers.
And that’s just direct military expenses—no accounting for veteran benefits, debt interest, or the "stability costs" that could last indefinitely.
Trump’s ledger: why he must call a halt
Businesspeople understand the importance of cutting losses.
Trump is a businessman. He’s calculated this war’s costs clearly.
What are the benefits of fighting?
Destroying some Iranian nuclear facilities—considered a partial success. But reports say Iran has already transferred some of its enriched uranium equipment—bombed but not completely destroyed.
What are the costs?
Spending $100 million daily, rising inflation at home, Republican lawmakers starting to frown during midterms, oil prices soaring to the point drivers are cursing…
It’s a losing business.
So, calling a halt isn’t because Trump suddenly became a peace advocate, but because:
Costs have exceeded benefits, and it’s time to cut losses.
April 6th: what might happen?
The ball is now in Iran’s court.
U.S. conditions: halt nuclear program, accept inspections, reduce regional influence.
Iran’s conditions: lift sanctions, guarantee regime security, compensate for war damages.
Their core demands don’t overlap at all.
So, the most likely outcomes are:
First (55% probability): Partial ceasefire
U.S. pauses airstrikes, Iran reduces counterattacks, both sides announce "significant progress in negotiations"—but the agreement is incomplete, issues unresolved, just a cooling-off.
Second (25% probability): Downgrade but no agreement
U.S. reduces involvement, Israel continues solo strikes. Trump can say "We won" externally, and internally, "I didn’t send ground troops."
Third (15% probability): Israel strikes alone
U.S. withdraws main forces, but Israel doesn’t stop. This is Israel’s best option—someone helps bomb for a while, Iran is weakened, and they haven’t exhausted their budget.
Fourth (5% probability): Full ceasefire
Impossible unless internal upheaval occurs within Iran.
A piece of geopolitical economic common sense
Great powers fighting small countries rely on resource dominance.
But when great powers fight each other, it’s about who can withstand internal political pressure first.
Can the U.S. beat Iran? Technically, yes.
But domestic public patience has a time window. When oil prices hit a certain critical point, Trump’s approval rating won’t just be a matter of 36%. It could threaten his 2028 nomination.
So, what’s really being negotiated at the table isn’t just a nuclear deal, but the internal political cost line of the U.S.
Some market judgments
Not strict predictions, just for reference:
Crude oil: $100 is the bottom; after an agreement, it could quickly fall back to $85–$90, but the risk premium on the Strait of Hormuz will persist long-term.
Gold: Remains high before April 6; after an agreement, there will be a phased correction, but if Iran’s issues aren’t resolved, there’s still hope later in the year.
U.S. stocks: The short-term opportunity in energy stocks has passed; defensive sectors and gold stocks are worth watching.
In conclusion
Trump is a "real person."
On the first day of the war, he said, "I will be very good at war," and after thirty-two days, he said, "We’re about to negotiate peace."
There’s no personality split here—just a businessman realizing the costs are too high, and reacting normally.
War is an extension of politics; politics is a reflection of domestic public opinion.
When approval ratings drop to 36%, even the toughest strongman has to start doing the math.
That’s probably why, on April 6th, it might really be a turning point.
repost-content-media
  • Reward
  • 42
  • Repost
  • Share
Luna_Starvip:
LFG 🔥
View More
  • Reward
  • 50
  • Repost
  • Share
Luna_Starvip:
Ape In 🚀
View More
Oil doesn't guess the top, gold doesn't catch the bottom, wait for the oil and gold to rise with the wind. #Gate金手指 #国际油价走高
View Original
post-image
post-image
ShizukaKazuvip
#创作者冲榜 The Hormuz Blockade Sparks Market Turmoil: Gold Plummets, Crude Oil Surges—What’s Next?
Recent gold and oil movements are completely counterintuitive: Iran’s blockade of the Strait of Hormuz, with geopolitical tensions so high, yet gold not only failed to rise but has fallen from 5200 all the way down to 4400-4500; meanwhile, crude oil has surged continuously, rendering the old adage “a cannon shot, a thousand ounces of gold” completely ineffective.
The reason for the crude oil surge is simple: the Strait of Hormuz accounts for nearly 40% of global maritime oil shipments. A blockade creates a hard supply gap, compounded by geopolitical risk premiums, making an increase inevitable. Gold’s sharp decline isn’t primarily due to a failure of safe-haven demand but because rate cut expectations have completely vanished. Many mistakenly think rate hikes are coming, but that’s impossible—U.S. Treasury yields are already at historic highs, and further hikes would be unsustainable, likely triggering systemic risks.
The Federal Reserve’s current stance is: no rate hikes, but also no easy rate cuts—relying on high interest rates to contain imported inflation.
Gold is a zero-yield asset. The longer high interest rates persist, the higher the holding costs. Coupled with liquidity tightening, institutions are selling off gold to cash out, causing prices to fall naturally.
In simple terms: crude oil is filling supply gaps, while gold is squeezing the rate cut bubble. The current main theme is “strong oil, weak gold.”
Looking ahead, there are basically three possible scenarios:
1. Most likely: Strait remains blocked, the Fed continues to resist rate cuts, crude oil remains strong, pushing toward $120-$130; gold continues under pressure, dropping to 4250-4300.
Strategy: Use oil pullbacks to buy, avoid guessing the top; for gold, rebound to short, avoid bottom-fishing; a conservative approach is “long oil, short gold” for hedging.
2. Neutral scenario: Strait reopens, the Fed signals slight easing; geopolitical premium on oil diminishes, fluctuating back to $90-$100; gold stabilizes and rebounds, aiming for 4700-4800.
Strategy: Sell high and buy low in oil; small positions in gold for testing longs, avoid chasing highs.
3. Low-probability extreme: escalation of the blockade, oil breaks $140, inflation spirals out of control; after surging, oil crashes due to demand collapse; gold falls below 4000, market risks sharply escalate.
Strategy: Reduce positions, hold cash, trade less, prioritize capital preservation.
Focusing on these three signals is enough:
1. Recovery status of Hormuz navigation
2. Whether the Fed hints at rate cuts
3. Whether the 10-year U.S. Treasury yield drops below 4.2%
Market volatility is high right now. Don’t over-leverage on a single direction, avoid blindly bottom-fishing, don’t hold onto losing positions, and follow the trend—nothing is more important.
repost-content-media
  • Reward
  • 45
  • Repost
  • Share
Luna_Starvip:
To The Moon 🌕
View More
🔥 Watch-to-Earn Issue 19 is now live, and the prize pool has been refreshed!
🎰 80 Heat Points = 1 Draw
Heat points can be accumulated for use in 2 consecutive activity periods (currently in the 2nd period)
🎁 Prizes for this period:
1 GT
Gate × RedBull Jacket
Gate Brand Stickers
TradFi Golden Ticket
📌 Continuous Sign-in Reminder:
Sign-in Day 1 +1
Sign-in Day 2 +2
🎁 Sign in for 7 / 14 consecutive days
Can participate in additional lucky draws
Send out 1 peripheral reward to each of 5 users in each draw
👉 https://www.gate.com/activities/watch-to-earn?now_period=19
👀 https://www.gate.com/li
GT-1,22%
View Original
post-image
GateLiveChinesevip
🔥 Watch-to-Earn Issue 19 is now live, and the prize pool has been refreshed!
🎰 80 Heat Points = 1 Lottery Draw
Heat points can be accumulated and used across 2 event periods (currently in the 2nd period)
🎁 Prizes for this period:
1 GT
Gate × RedBull Jacket
Gate Brand Stickers
TradFi Golden Ticket
📌 Continuous Sign-in Reminder:
Sign-in Day 1 +1
Sign-in Day 2 +2
🎁 Sign-in for 7 / 14 consecutive days
Allows participation in additional lucky draws
5 users will be selected in each draw to receive a peripheral reward item
👉 https://www.gate.com/activities/watch-to-earn?now_period=19
👀 https://www.gate.com/live
repost-content-media
  • Reward
  • 44
  • Repost
  • Share
MoonGirlvip:
Ape In 🚀
View More
#TrumpExtendsStrikeDelay10Days
What exactly happened? (Background )
On March 23, 2026, U.S. President Donald Trump announced a temporary suspension of military strikes against Iran's energy infrastructure via Truth Social, shaking global markets. The targets mainly included Iran's power plants and oil-related facilities—these are the lifelines of Iran's economy and key nodes in global energy supply. Trump gave Tehran a five-day window for negotiations to ensure the safe passage of ships through the Strait of Hormuz. This move was initially interpreted as a cautious de-escalation measure.
BTC-0,07%
ETH0,49%
View Original
post-image
post-image
HighAmbitionvip
#TrumpExtendsStrikeDelay10Days
What Actually Happened? (The Background)
On March 23, 2026, U.S. President Donald Trump sent shockwaves through global markets by announcing via Truth Social a temporary pause on planned military strikes against Iran’s energy infrastructure. The targets were specifically Iran’s power plants and oil-related facilities — the lifeblood of its economy and a critical node in global energy supply. Trump gave Tehran a window of five days to negotiate and ensure the safe passage of ships through the Strait of Hormuz, a move that was initially interpreted as a cautious de-escalation. Markets responded with optimism, as even a brief pause in the threat of conflict tends to ease geopolitical risk premiums.
Then, on March 27, in a move that caught many off guard, Trump extended the pause for another ten days, effectively pushing the deadline to April 6. Notably, this announcement came just minutes after U.S. stock markets closed following one of the worst sessions of the year, a timing that many analysts interpreted as strategically calculated. He claimed negotiations were progressing “very well” and highlighted Iran’s symbolic gesture of allowing ten oil tankers to pass through the Strait. Tehran, however, publicly denied that any direct talks were ongoing, creating an information asymmetry that added complexity to market pricing. The hashtag #TrumpExtendsStrikeDelay10Days trended across X as traders, analysts, and geopolitical commentators dissected the ramifications, particularly for oil and crypto markets that had become increasingly sensitive to every Middle East development.
Why the Strait of Hormuz Matters So Much
The Strait of Hormuz is arguably the single most geopolitically sensitive maritime passage on the planet. Roughly 20–21% of the world’s oil supply flows through this narrow corridor daily, equating to about 17 million barrels per day. Any blockage or disruption would ripple instantly across global energy markets. Historical data shows that even minor threats to the strait trigger sharp spikes in Brent and WTI futures, sometimes in the range of 20–40%. Gulf states such as Saudi Arabia, the UAE, Kuwait, and Iraq rely heavily on this passage for their oil exports, and disruptions would extend far beyond the region, affecting energy supply chains across Europe, Asia, and beyond. This is why a single Trump tweet referencing Iran can send shockwaves not only through stock markets but also through the crypto space, where risk appetite and liquidity respond to global macro events with increasing sensitivity.
The Initial Market Reaction (March 23 — First Delay)
The first announcement of the five-day pause triggered a classic “risk-on” reaction. Bitcoin surged from roughly $69,000 to over $71,000 within hours, a sharp 3% jump that reflected market relief. Oil prices fell as the immediate war premium evaporated, while U.S. equities experienced a notable rebound — Dow Jones futures spiked +1,000 points in premarket trading. Gold, traditionally considered a safe haven, gave back some gains as investors rotated back into risk assets. The broader crypto market mirrored this sentiment: Ethereum, XRP, and Solana all ticked higher, reflecting a renewed appetite for risk. This initial reaction illustrated a pattern that has become increasingly clear over 2026: crypto markets are no longer isolated from macro and geopolitical developments; instead, they move almost in lockstep with broader risk-on and risk-off flows.
The Second Extension (March 27 — 10 More Days)
The second extension brought a nuanced market response. Unlike the initial bounce, Bitcoin did not rally significantly, instead hovering around $66,758. The S&P 500 had just posted a -1.7% decline, marking its worst single-day drop in months, while oil prices surged amid lingering fears of military escalation. European markets were expected to open only slightly higher, while Asia-Pacific equities remained under pressure, reflecting the continued uncertainty. Analysts noted a diminishing return in market reactions to repeated diplomatic extensions — the first delay triggered a strong relief rally, but the second was met with skepticism and caution. This pattern suggested that markets were beginning to price in both the possibility of further extensions and the structural risk of conflict, creating a whipsaw environment where short-term headline risk could trigger volatility but not sustained directional moves.
Crypto Market in Full Detail
By March 30, 2026, Bitcoin was trading at $66,758, down 5.39% over the previous seven days and 23.83% over 90 days. Its daily chart showed a bearish alignment with the 7-day moving average below the 30-day and 120-day moving averages, signaling that short-term momentum was weak relative to the longer-term trend. However, technical indicators such as the Commodity Channel Index (CCI) and Williams %R suggested that BTC was in oversold territory, highlighting the potential for a technical bounce. The Fear & Greed Index at 9/100 reflected extreme fear, emphasizing the depth of market caution. Ethereum was trading at $2,013, down 6.63% over seven days and 32.25% over 90 days. ETH ETFs saw eight consecutive days of net outflows, with BlackRock alone selling over $140 million in ETH during the week. XRP and Solana each dropped over 6%, while altcoin trading volumes fell by roughly 80% from October 2025 peaks. Total crypto market capitalization declined by approximately $44 billion during this turbulent period. These metrics collectively illustrate a market operating under extreme stress, with sentiment heavily skewed toward caution and downside risk.
Oil & Energy: The Invisible Hand Moving Crypto
Oil continues to act as a hidden macro lever for crypto markets. Rising tensions in the Middle East push oil prices higher, generating inflationary fears that keep the Federal Reserve hawkish and dampen risk assets, including cryptocurrencies. Conversely, Trump’s extensions ease geopolitical pressure, leading to short-term drops in oil and providing a temporary window for crypto to recover. Brent crude traded near $108 per barrel, while WTI hovered around $93–94, levels that signal persistent inflationary pressure. Given the Fed’s focus on inflation, sustained oil prices above $100/barrel could undermine hopes of rate cuts, one of the key structural drivers behind crypto bull markets. Every diplomatic headline, therefore, is not just a geopolitical signal but also a potential market mover for BTC, ETH, and altcoins.
The "Market Revolt" Narrative (Why Trump Blinked)
Several analysts suggested that the timing of the extension — immediately after one of Wall Street’s worst sessions of the year — may have been a deliberate market intervention rather than a purely diplomatic gesture. Trump has a documented history of using social media to influence market psychology, and this latest move reinforced the notion of a “Trump Put” that extends to crypto markets. For traders, this implies that headline-driven volatility is potentially predictable and tradable. The pattern is becoming clear: Trump delays → BTC experiences a brief pop → sentiment fades → markets reassess risk. This emerging behavior signals that geopolitical headlines and crypto price movements are increasingly intertwined, creating both opportunity and risk for traders who actively monitor these events.
What Happens After April 6? Scenarios for Crypto
April 6, 2026, is the next inflection point for crypto markets. If negotiations succeed or the pause is extended, oil prices could fall sharply, risk-on conditions could return, and BTC might recover toward $70,000–$75,000. Altcoins would likely post stronger percentage gains, ETF inflows may reverse, and investor sentiment could improve significantly. If military strikes begin, oil could spike to $120–$130 per barrel, inflation fears would surge, and BTC could test $60,000 or lower, triggering liquidations across leveraged positions. Gold would likely outperform crypto as a safe haven. The most probable scenario is continued headline-driven volatility, keeping BTC in a $64,000–$70,000 range, with option premiums elevated and trading activity focused on short-term swings rather than sustained directional moves.
Institutional Moves During the Chaos
Institutional investors are clearly positioning strategically rather than fleeing during this period of heightened geopolitical risk. Strategy (formerly MicroStrategy) purchased 1,031 BTC for $76.6 million, averaging $74,326 per BTC, bringing total holdings to 762,099 BTC. BlackRock moved substantial BTC and ETH holdings to Coinbase Prime but faced ETF outflows, reflecting mixed client sentiment. Morgan Stanley announced plans to launch a spot Bitcoin ETF with a low 14bps management fee, potentially attracting significant institutional inflows. Coinbase partnered with Fannie Mae and Better Home & Finance to offer Bitcoin-backed mortgages, allowing BTC or USDC as collateral. These actions signal that institutions are actively building infrastructure and positioning for future growth rather than liquidating positions during periods of volatility.
The Bigger Picture: Bitcoin as a Geopolitical Sentiment Ticker
The structural takeaway from #TrumpExtendsStrikeDelay10Days is clear: Bitcoin in 2026 functions as a geopolitical sentiment instrument. Positive diplomatic signals drive BTC up alongside equities, while conflict fears push it down, diverging from its traditional safe-haven narrative. BTC’s 90-day performance of -23.83% closely mirrors drawdowns in risk assets amid heightened geopolitical tensions, while gold has surged, underscoring the shift in BTC’s role. Traders must now treat Bitcoin as sensitive to geopolitical developments as much as they monitor on-chain metrics, emphasizing the need for proactive risk management and adaptive trading strategies.
Key Takeaways in One Place
Trump’s 10-day extension bought valuable time for diplomacy, markets, and crypto stability. Bitcoin trades at $66,758, ETH at $2,013, with extreme fear dominating market sentiment. Oil prices remain the primary macro signal, and institutional moves indicate ongoing infrastructure development. April 6 will determine whether crypto enters a risk-on recovery or faces heightened drawdowns. Traders should remain vigilant, prioritize oil and geopolitical news as leading indicators, and use this period to strategically position and manage risk.
repost-content-media
  • Reward
  • 41
  • Repost
  • Share
Luna_Starvip:
Ape In 🚀
View More
A community experiment of "doing only, not issuing tokens"—how far can it go? 🚀
While everyone is asking "When will the token be issued," we want to explore a more fundamental question:
If this industry doesn't issue tokens, what do we have left?
The answer might be a bit harsh: perhaps only whitepapers, anonymous teams, and a financial game destined for someone to take over.
Therefore, we decide not to be part of the problem.
We're tired of the narrative that "launching equals peak, slowly zeroing out." While everyone is designing token economies to attract hot money, we've launched this "un
View Original
post-image
post-image
[The user has shared his/her trading data. Go to the App to view more.]
  • Reward
  • 75
  • 1
  • Share
Luna_Starvip:
To The Moon 🌕
View More
#Gate广场AI测评官 Using OpenClaw for quantitative trading, can it really make money?
Recently, a very popular name has emerged in the quant and crypto circles: OpenClaw. Many people call it the "AI Lobster Trader," and you often see promotions in communities like: "Turn $50 into $3,000 in two days," "Automated quant makes thousands of dollars in a day," "AI finds strategies and places orders automatically." It sounds like an automatic money-printing machine.
But the question is: how effective is OpenClaw for running quantitative trading in reality?
Today, we will clarify this from three perspectiv
View Original
Ryakpandavip
#Gate广场AI测评官 Using OpenClaw for quantitative trading, can it really make money?
Recently, a very popular name has emerged in the quant and crypto circles: OpenClaw. Many people call it the "AI Lobster Trader," and you often see promotions in communities like: "Turn $50 into $3,000 in two days," "Automated quant makes thousands of dollars in a day," "AI finds strategies and places orders automatically." It sounds like an automatic money-printing machine.
But the question is: how effective is OpenClaw for running quantitative trading in reality?
Today, we will clarify this from three perspectives: technology, actual results, and risks.
1. What exactly is OpenClaw?
First, the conclusion: OpenClaw is not a trading system per se. It is an AI Agent framework.
OpenClaw is an open-source platform for automated intelligent agents that can perform tasks using large models, such as:
- Automatically collecting data, analyzing information, calling APIs, executing scripts, triggering trading actions.
It was first launched by developer Peter Steinberger in 2025 and quickly became popular in the developer community. Simply put: OpenClaw = AI execution system, not = profit-making strategy. Many people confuse these two things.
2. Why is OpenClaw used for quant trading?
The reason is quite simple. Traditional quantitative trading has three parts:
1. Data
2. Strategy
3. Execution
OpenClaw excels at automation of execution. For example, it can: automatically fetch market data, run backtests, optimize parameters, monitor markets, place orders automatically, and even turn the entire process into a pipeline: idea → backtest → simulation → live trading. Some projects even promote: AI can automatically discover strategies and optimize parameters. So many start fantasizing: "AI trades for me, I just collect the profits." But reality is usually not that simple.
3. Actual results: it can run, but not necessarily make money
If you look at real user feedback, you'll notice an interesting phenomenon. OpenClaw can indeed run trades, but the returns vary greatly. Some say: an average monthly return of about 5%. Others suffer losses directly. The reason is simple: it’s not the AI that makes money, but the strategy.
The core of quant trading always boils down to three things: strategy logic, risk control, and market understanding. AI is actually unstable in these areas. If the strategy itself is poor, no matter how intelligent the automation system, it’s useless.
4. What is the true value of OpenClaw?
If you ask professional quant traders, most will give a more rational answer: the most valuable aspect of OpenClaw is its automation engineering capability. For example:
1. Automated research: AI can scan markets daily, analyze news, and detect abnormal volatility.
2. Automated backtesting: strategies can be automatically tested against historical data. Automated monitoring: when the market shows anomalies—volatility, drawdowns, price breakthroughs—the system automatically alerts.
Many engineers believe that the best use of OpenClaw is for research + monitoring + semi-automatic trading, rather than fully automatic order placement.
5. The real conclusion: if you only ask, "How effective is OpenClaw at running quantitative trading?" the answer is simple. It is not a money-making machine. It is more like an automated operation system for quant trading. If you have mature strategies, comprehensive risk controls, and technical skills, it can improve efficiency. But if you just want to "set up AI to automatically make money," the most likely result is: paying tuition fees.
There’s an old saying in the quant industry: automation doesn’t turn bad strategies into good ones. OpenClaw just automates trading. But what truly determines your profitability is never AI, but: your trading logic.
repost-content-media
  • Reward
  • 61
  • Repost
  • Share
Luna_Starvip:
LFG 🔥
View More
📅 Bitcoin Rebounds to $71K on "Peace Talks"—Beware of Regulatory "Weaning" Blow (March 26, 2026)#加密市场回涨 #创作者冲榜
🌪️ One-Line Summary:
The market took a breather after falling hard, but don't get overconfident! Bitcoin rebounded to $71,000, yet there's still a regulatory axe hanging overhead: banning stablecoins from paying interest. This is a rebound, not a reversal—don't chase the rally recklessly.
------
📈 Core Developments
1. Why the sudden spike?
◦ Direct Cause: Trump said he wants to talk with Iran and won't take action for now, so global markets breathed a sigh of relief. Bitcoin capit
ETH0,43%
GT-0,95%
BTC-0,09%
View Original
post-image
post-image
  • Reward
  • 65
  • Repost
  • Share
Luna_Starvip:
Ape In 🚀
View More
# One Trade, Six Profound Insights: The Multi-Dimensional Resonance of AI Quantitative Strategy
As the final data of this BTC/USDT perpetual contract live trading test concluded, what emerged was far more than a profit figure—it was a comprehensive "diagnostic report" on strategy, discipline, and human-machine synergy. As a deep observer and practitioner in the Gate community, I've decoded six core dimensions from these specific trading data that transcend candlestick charts, collectively outlining the contours of a robust strategy.
🌊 **Dimension One: Resonating with Trends, Not Playing the P
BTC-0,07%
View Original
post-image
  • Reward
  • 50
  • Repost
  • Share
Luna_Starvip:
LFG 🔥
View More
Crypto Daily (2026.03.25)
One sentence setting the tone: The big coin remains steadfast at 70,000, capital is flowing back; but regulatory headwinds strike suddenly, putting the stablecoin yield model in jeopardy.
------
📊 Market Overview
• BTC: $70,879 (-1.09%) | ETH: $2,145 (-0.12%)
• Fear Index: 37 (Fear) | 24-hour Liquidations: $716 million (Long positions account for 68% )
🚨 Headline: Will the "Interest" on Stablecoins Fade Away?
The US Senate is drafting the Clarity Act, which aims to prohibit platforms from paying "deposit-like interest" to stablecoin holders. The market is immediatel
GT-0,95%
ETH0,43%
BTC-0,09%
View Original
post-image
post-image
  • Reward
  • 64
  • 2
  • Share
Luna_Starvip:
Ape In 🚀
View More
Thank you for sharing! The sharp decline is Rich Bird's "transformation," confidence shines brighter than gold, waiting for the rebound to cash in!
View Original
LittleGodOfWealthPlutusvip
#创作者冲榜
Global Financial Markets Experience "Black Monday"--In Darkest Times, Confidence Shines Brighter Than Gold
Today, global financial markets welcomed Black Monday, with the sharp decline in Asia-Pacific stocks and precious metals markets becoming the focal point. The Nikkei 225 Index fell more than 3%, South Korea's KOSPI Index plummeted over 4%, and China's three major indices opened significantly lower, with over 5,000 declining stocks across Shanghai, Shenzhen, and Beijing; the precious metals market was equally devastated, with Shanghai silver dropping over 4% in a single day, Shanghai gold declining over 1%, and London gold and silver weakening in sync, with traditional safe-haven properties completely losing effectiveness. The cryptocurrency market was not spared either, with Bitcoin down 2%, Ethereum down over 3%, and over 200,000 liquidations in a single day. This cross-market crash even evoked the scent of financial crisis, but what's really wrong with the market? Digging to the root, we've found that neither the fundamentals nor the news carry particularly heavy bearish signals. In the face of such irrational decline, confidence becomes especially important, because after the darkest hour, a rebound can arrive at any time. 💪💪
👉Let's first look at the crash causes we can currently identify:
1. Federal Reserve Policy Shift: A Dramatic Reversal of Market Expectations
The shift in the Federal Reserve's policy direction is the core trigger for this market crash. Previously, the market widely expected the Fed to cut rates 2-3 times in 2026, a projection that served as important logic supporting global asset prices. However, a series of recent economic data and Fed statements have completely reversed market expectations. The US February PPI exceeded expectations, with overall PPI rising 0.7% month-over-month, surpassing the expected 0.3%, and accelerating 3.4% year-over-year, indicating stubborn inflation pressure persists. Against this backdrop, the Federal Reserve's March FOMC meeting maintained the federal funds rate target range at 3.50%-3.75%, and the dot plot showed policymakers expect only one rate cut in 2026, with even 7 officials supporting no rate cuts for the entire year. Market expectations thus plummeted from the early-year forecast of 2-3 cuts to less than 1, with even talk of rate hikes emerging.
The reversal in Federal Reserve policy expectations directly triggered a repricing of global assets. The US Dollar Index broke through the 100 level, and US Treasury yields surged to near-year highs, with 2-year Treasury yields breaking 3.8%. For gold, silver, and cryptocurrencies priced in US dollars, a stronger dollar directly depressed their prices, while Asia-Pacific stocks faced capital outflow pressure triggered by dollar strength.
2. US-Iran Conflict Escalation: Inflation Backfires and Safe-Haven Logic Fails
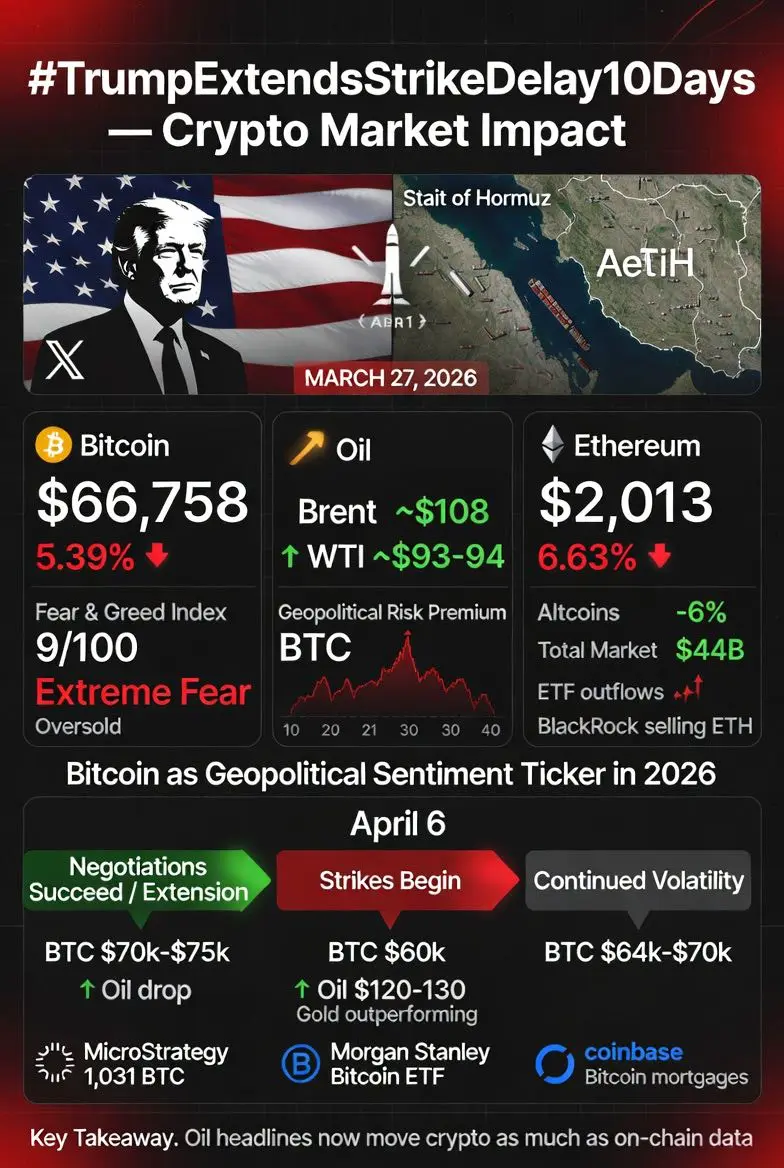
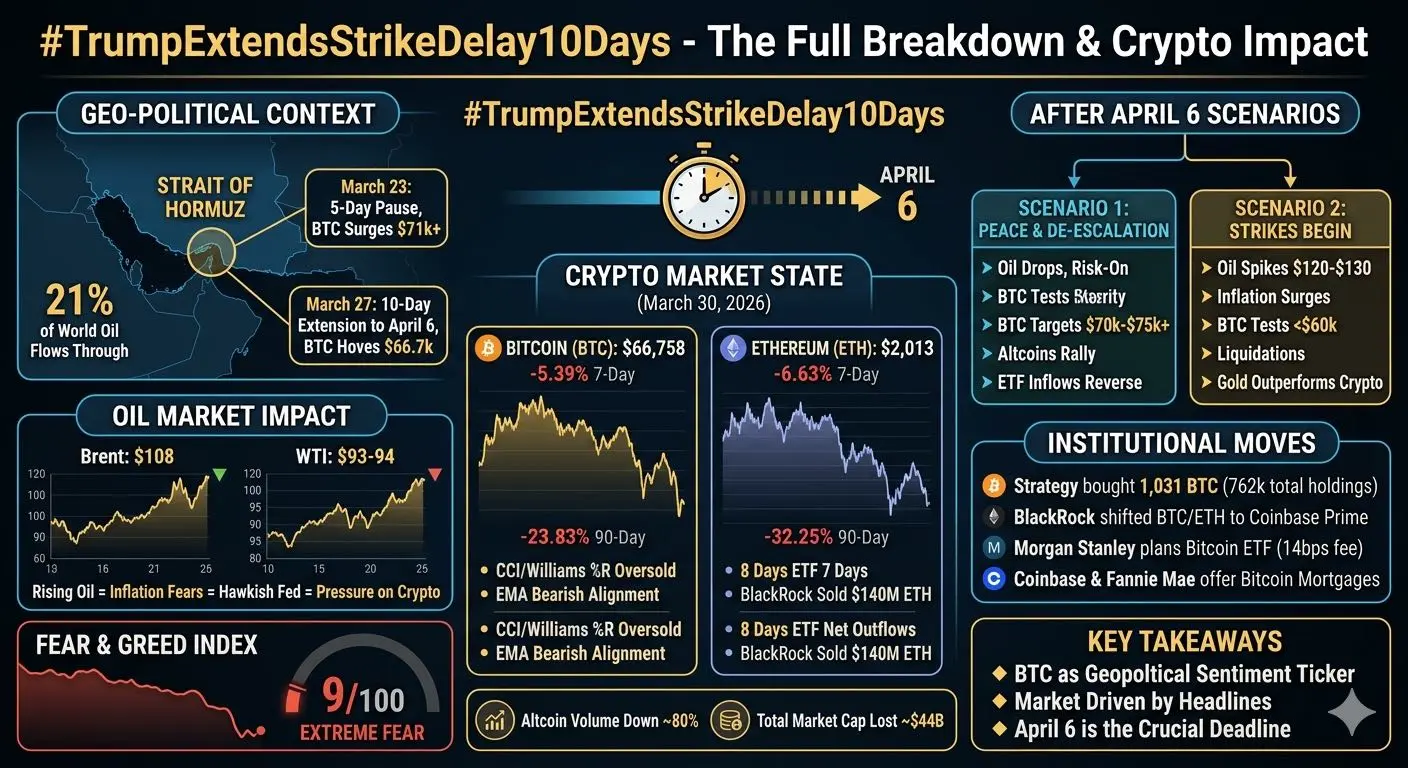
The continued escalation of Middle East geopolitical conflict is an important catalyst for this market crash. US President Trump gave Iran 48 hours to open the Strait of Hormuz and threatened to destroy its power plants, and Iran responded firmly with 4 countermeasures including completely closing the Strait of Hormuz. The Strait of Hormuz handles approximately 20% of global oil and natural gas transportation, and the escalation sparked market concerns about energy supply disruptions, with international oil prices surging at one point, WTI crude oil rising to $99.837 per barrel and Brent crude to $108.390 per barrel.
The escalation of geopolitical conflict naturally brings adjustments in risk assets like Asia-Pacific stocks and cryptocurrencies, but why did precious metals prices also fall? The reason is that the market formed a "reverse transmission chain" of "oil price up→inflation rises→rate cuts delayed→precious metals down." The rise in energy prices strengthens market expectations for sustained high inflation, further solidifying the Fed's determination to maintain high rates, causing the holding costs of precious metals to continue rising. Meanwhile, the elevated prices of gold and silver caused many investors to develop "fear of heights," stripping away the safe-haven properties and instead adopting characteristics of risk assets, forcing capital to rush toward US dollar cash as the traditional "last refuge."
3. Fund Stampede and Leverage Liquidation: Confidence Collapse in Black Swan Events
The enormous gains and high-leverage positions accumulated in prior markets triggered serious fund stampedes and leverage liquidations when bearish factors concentrated, further amplifying market declines. Over the previous half year, gold prices rose 60%, silver prices doubled, accumulating massive profit-taking positions. Once hawkish Fed signals were released, these profits were cashed in collectively, triggering selling waves. Meanwhile, futures market margin increases triggered long stop losses, and programmed trading intensified selling pressure, forming a "longs killing longs" scenario. The silver market, with a scale only 1/10 of gold and leverage exceeding 35%, became the hardest hit area, with declines far exceeding gold. Gold ETFs have experienced net outflows for three consecutive weeks, with holdings reduced by over 60 tons in just three weeks, wiping out all net inflows for the year. We've discussed this in previous articles.
🙋To summarize in one sentence: although the fundamentals have experienced some subtle changes, there are no major unexpected factors causing today's market crash. The underlying reasons are likely a concentrated catharsis of panic emotions accumulated since the US-Iran war, combined with a stampede triggered by sudden crashes under the market's long-term high-leverage operations. The crash is short-term and accidental, with a high probability of not being sustained.
👉So where will the market head after the black swan, and how should we respond?
Let's first look at history:
Today's gold crash has made many investors doubt gold's safe-haven properties. However, reviewing history, gold often returns to its long-term uptrend after experiencing crashes. In 2013, gold prices plummeted from around $1,700 per ounce to below $1,200, a decline exceeding 28%. At that time, bearish voices on gold were constant, with many believing gold's bull market had ended. But subsequently, gold prices gradually stabilized and reached a record high of $2,075 per ounce during the 2020 pandemic.
Similarly, China's A-shares also plummeted 7% on April 7 last year due to US-China trade tensions, but the market subsequently rebounded and launched a bull market, with the Shanghai Composite rising over 1,000 points. Investors who cut positions on April 7 probably wish they could slap their own legs.
As for bitcoin, needless to say, countless historical cases have proven that bitcoin crashes are opportunities to bottom-fish, and the market will continue to rise long-term. In 2018, bitcoin prices plummeted from near the $20,000 high to around $3,000, a decline exceeding 85%. Many people thought bitcoin had reached its end. However, in 2020, bitcoin prices began rising sharply, reaching a record high exceeding $60,000 in 2021. In 2022, bitcoin experienced another crash, falling from above $40,000 to below $15,000. But subsequently, bitcoin prices gradually recovered, reaching a peak of $126,000 in 2025.
🙋One sentence to summarize: For quality assets, "black swans" are "lucky birds" that let you bottom-fish and make money. Don't sell in panic; confidence is more valuable than gold!
👉Having said so much, how should we operate currently?
✅If you're holding a full position, I'd recommend you close your account for now and do something relaxing, then check your account in a couple of days. You might discover your assets have returned to their original state. Market bears come from nowhere and return to nowhere; there's no need to make yourself tense and depressed for two days for nothing. After all, the most important thing in life is happiness! 😊😊😊
✅If you're currently in cash, you can start building positions gradually. Pay attention to these levels:
Gold: Watch the 4,000 round number level, enter your initial position above 4,000, add on a break below 4,000, stop loss below 3,800
Silver: Follow gold trends closely, if it drops to 50+, enter your initial position. Add on a gold break below 4,000, stop loss below 50 dollars
BTC: Enter initial position at market price, add on a break below 67,500, stop loss at break of 67,000
ETH: Enter initial position at market price, add on a break below 2,021, stop loss at break of 2,000
💡Meanwhile, when bottom-fishing, also note these tips:
1. Stick with quality assets: The core of long-term investing
During market crashes, stocks of quality companies are often wrongly sold off. These enterprises boast strong profitability, solid financial conditions, and broad development prospects, maintaining stable operating performance even during market downturns. Investors should hold these quality assets and patiently await market rebounds.
Regarding assets like gold and bitcoin, investors should also approach from a long-term perspective, not being misled by short-term price fluctuations. Gold, as a scarce resource, possesses preservation and appreciation functions; bitcoin, as an emerging digital asset, has considerable investment potential. As long as investors can tolerate short-term price volatility, long-term holding often yields solid returns.
2. Appropriately diversify investments
Don't invest all funds into a single asset, but appropriately diversify across different asset classes, such as stocks, bonds, gold, and bitcoin. This way, when one asset class declines, others may perform well, offsetting some losses.
3. Control positions: Flexibly respond to market changes
During periods of market uncertainty, controlling positions is extremely important. Investors shouldn't operate at full capacity, but should retain certain cash reserves to timely enter when better investment opportunities appear.
Meanwhile, investors should timely adjust positions based on market changes. When markets show sufficient rebounds, appropriately take profits; when markets decline again, promptly build positions and buy on dips.
Alright, having said so much, everyone, bottom-fish with this cup of chicken soup! Wishing everyone prosperity every day! 💰💰💰
repost-content-media
  • Reward
  • 45
  • Repost
  • Share
Luna_Starvip:
LFG 🔥
View More
The Donald's on the move, Bitcoin's on a roll.
BTC-0,07%
View Original
Ryakpandavip
#加密市场回涨 Trump Announces 5-Day US-Iran Ceasefire! Bitcoin Surges Past $71,000, Financial Markets Need the King of Deals, the World's Strongest Financial Operator!
Trump Announces 5-Day US-Iran Ceasefire! Bitcoin Surges Past $71,000, Social Discussion Volume Skyrockets 38% Overnight. A slight easing of geopolitical tensions has sparked a "revenge rally" in the cryptocurrency market.
On March 23rd local time, US President Trump suddenly announced a 5-day pause on military strikes against Iran's energy infrastructure, stating that the US and Iran have engaged in "productive dialogue."
The news triggered a sharp rally in global risk assets, with the crypto market experiencing a strong rebound. Bitcoin surged past $71,000 within 24 hours, with over $660 million in short positions liquidated across the entire network. According to data from crypto research firm Santiment, Bitcoin's social discussion volume jumped 38% overnight, with market enthusiasm quickly recovering.
01 Market Data Snapshot
BTC Price: Broke through $71,000 USDT, with 24-hour gains exceeding 4%, surging from the daily low of $67,445
Social Sentiment: Bitcoin social discussion volume surged 38%, with market focus concentrated on "US-Iran situation" and "BTC rebound"
Trading Volume: 24-hour crypto market trading volume spiked approximately 80%, with evident increase in fund inflows
Altcoin Performance: Ethereum ( ETH ) up over 4.5%, Solana ( SOL ) up over 5%, XRP and Dogecoin following with gains
Futures Market: Approximately $660 million in short positions liquidated network-wide, shorts heavily hit
02 Why the Sudden Rebound? Ceasefire News Proves Key Turning Point
The direct trigger for this rebound is Trump's statement on March 23rd. He stated that the US and Iran had engaged in active dialogue on "comprehensive resolution of Middle East hostilities," and subsequently ordered a 5-day pause on previously planned strikes against Iran's energy infrastructure. Previously, escalating Middle East tensions had made markets extremely pessimistic, with investors dumping risk assets. The arrival of this news quickly reversed market sentiment—"the worst short-term risks are temporarily averted," as funds began flowing back from safe-haven assets to stocks and cryptocurrencies and other high-risk sectors. Notably, crude oil prices plummeted over 10% following the announcement, further confirming the market's pricing logic regarding easing geopolitical conflict.
03 Bitcoin: Risk Asset or Safe Haven?
Once again, Bitcoin demonstrated its high correlation with global risk assets. Against the backdrop of surging US stocks, Bitcoin rallied in sync, rather than playing its traditional safe-haven role.
Technically, Bitcoin reclaimed the $70,000 psychological level. Analysts broadly believe that if it can stabilize above $69,000 in the coming days, the market could challenge the previous highs of $74,000–$75,000 this month. However, Santiment also notes: a 38% surge in social discussion volume often signals short-term overheating. When market sentiment becomes too euphoric, the probability of a near-term pullback rises accordingly.
04 Altcoins Following Suit, But Momentum Still Not Fully Unleashed
Led by Bitcoin, major altcoins like Ethereum and Solana recorded typical 4%–5% gains. However, in contrast to Bitcoin's high sentiment, altcoins' overall social discussion volume remains near two-year lows. This suggests that the current rally is driven more by Bitcoin sentiment spillover plus short-covering, rather than a full-scale retail "FOMO" surge. A comprehensive altcoin recovery may require more time and stronger market confidence.
05 Risks Remain: Iran Denies Negotiations, Ceasefire Only 5 Days
Despite positive market reaction, potential risks haven't truly been eliminated. Iran officially denies negotiations: Iran quickly responded, stating it has not engaged in any direct or indirect negotiations with the US, accusing Trump's statement of being "fake news."
5-day ceasefire is short-lived: If negotiations bear no fruit after the ceasefire ends, military conflict could escalate again.
Energy supply not restored: Strait of Hormuz shipping has not fully returned to normal, with fundamental energy supply issues unresolved.
Market sentiment remains fragile: The "Fear and Greed Index" reflecting overall market sentiment remains in "extreme fear" territory, with investor confidence not yet fully restored.
06 Institutional Capital Flows: Inflows Slowing
According to the latest CoinShares data, inflow velocity for crypto investment products last week has noticeably slowed. This indicates that despite price rebounds, external incremental capital shows limited enthusiasm for chasing highs. Current market movements rely more on existing capital and sentiment repair.
07 Summary
This rebound is a typical "event-driven" rally. Trump's announced 5-day ceasefire temporarily alleviates market concerns about further Middle East deterioration, directing capital back into risk assets, with cryptocurrencies rising accordingly and social discussion heat spiking. However, we must remain clear-headed: fundamental geopolitical contradictions remain unresolved, Iran denies negotiations, and market sentiment remains in "extreme fear" territory. The sustainability of this rebound remains to be observed.
repost-content-media
  • Reward
  • 43
  • Repost
  • Share
Luna_Starvip:
Ape In 🚀
View More
  • Pin