Ggan
Trade
Basic
Futures
Futures
Hundreds of contracts settled in USDT or BTC
Options
HOT
Trade European-style vanilla options
Unified Account
Maximize your capital efficiency
Demo Trading
Futures Kickoff
Get prepared for your futures trading
Futures Events
Participate in events to win generous rewards
Demo Trading
Use virtual funds to experience risk-free trading
Earn
Launch
CandyDrop
Collect candies to earn airdrops
Launchpool
Quick staking, earn potential new tokens
HODLer Airdrop
Hold GT and get massive airdrops for free
Launchpad
Be early to the next big token project
Alpha Points
NEW
Trade on-chain assets and enjoy airdrop rewards!
Futures Points
NEW
Earn futures points and claim airdrop rewards
Investment
Simple Earn
Earn interests with idle tokens
Auto-Invest
Auto-invest on a regular basis
Dual Investment
Buy low and sell high to take profits from price fluctuations
Soft Staking
Earn rewards with flexible staking
Crypto Loan
0 Fees
Pledge one crypto to borrow another
Lending Center
One-stop lending hub
VIP Wealth Hub
Customized wealth management empowers your assets growth
Private Wealth Management
Customized asset management to grow your digital assets
Quant Fund
Top asset management team helps you profit without hassle
Staking
Stake cryptos to earn in PoS products
Smart Leverage
NEW
No forced liquidation before maturity, worry-free leveraged gains
GUSD Minting
Use USDT/USDC to mint GUSD for treasury-level yields
More
Ggan
No content yet
- Reward
- like
- Comment
- Repost
- Share
Reflecting on this year's encryption journey—from market surges to bold moves, every step is worth remembering. Check your #2025Gate年度账单 now, revisit your 2025 encryption journey with Gate, and share to receive 20 USDT. https://www.gate.com/zh/competition/your-year-in-review-2025?ref=BAMRU19b&ref_type=126&shareUid=VlJHU1tYCAsO0O0O
View Original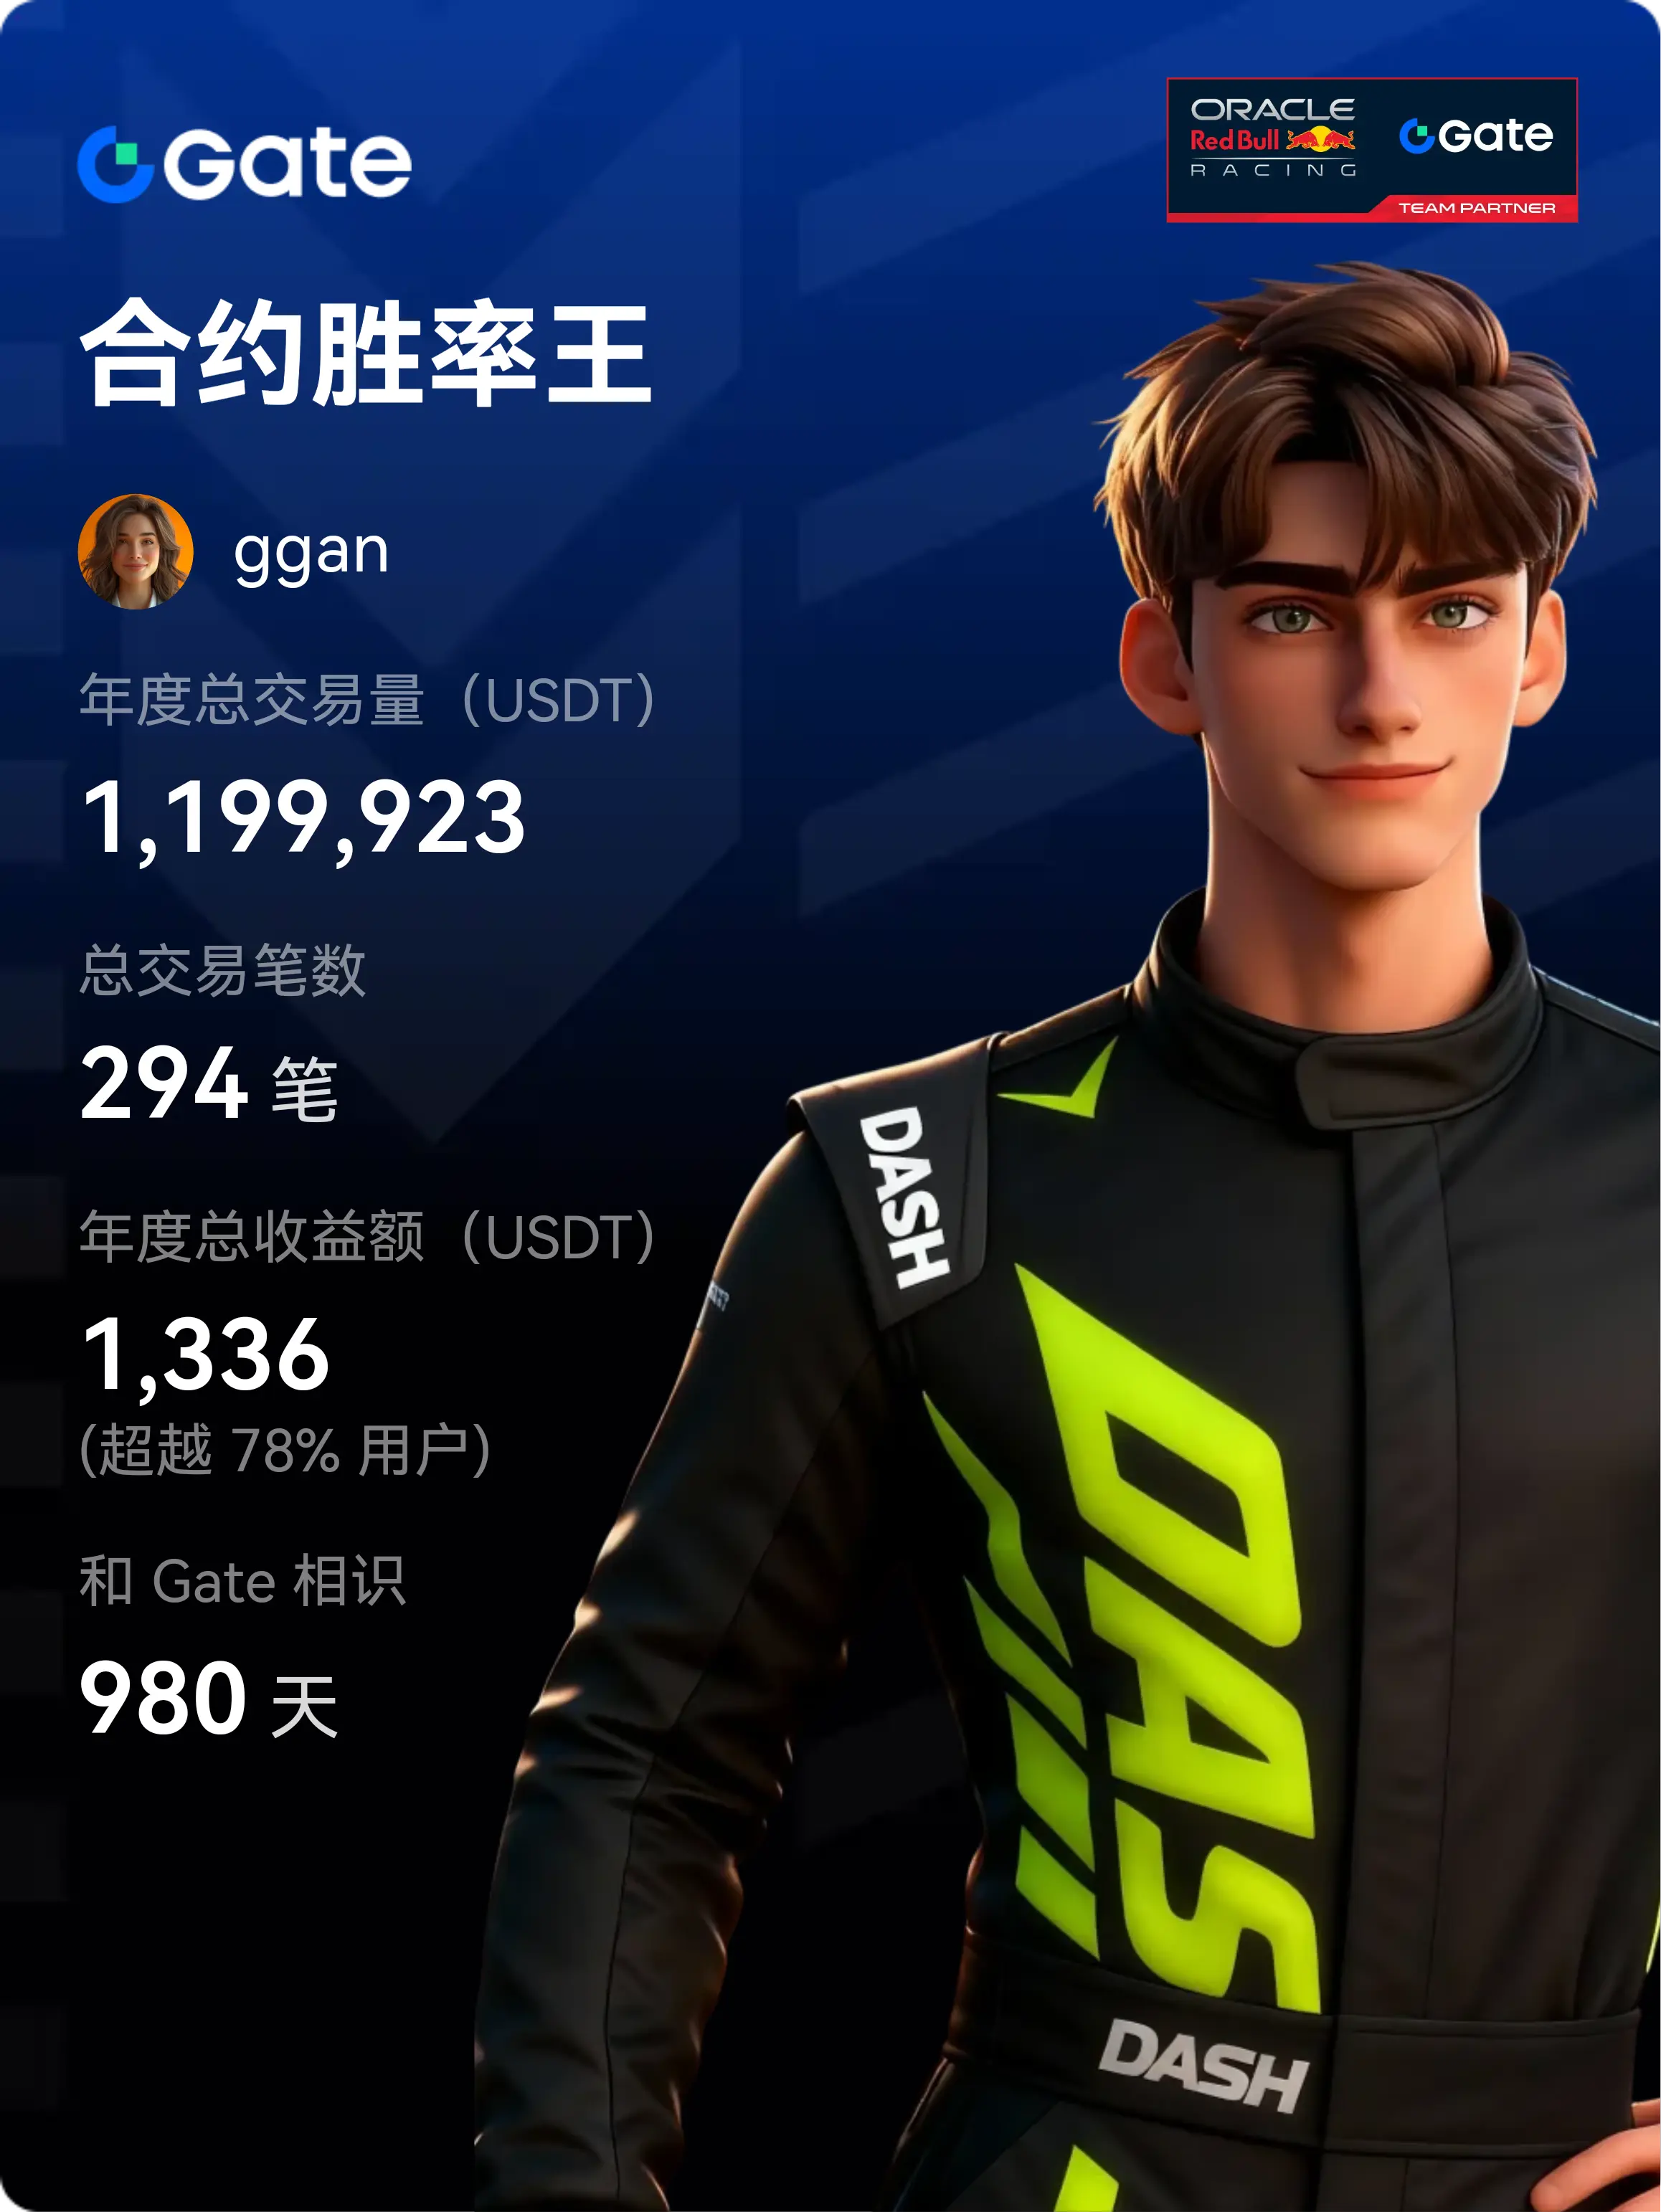
- Reward
- like
- Comment
- Repost
- Share
Oh oh
View Original- Reward
- like
- Comment
- Repost
- Share
😍
- Reward
- like
- Comment
- Repost
- Share
😘😘
- Reward
- like
- Comment
- Repost
- Share
- Reward
- like
- Comment
- Repost
- Share
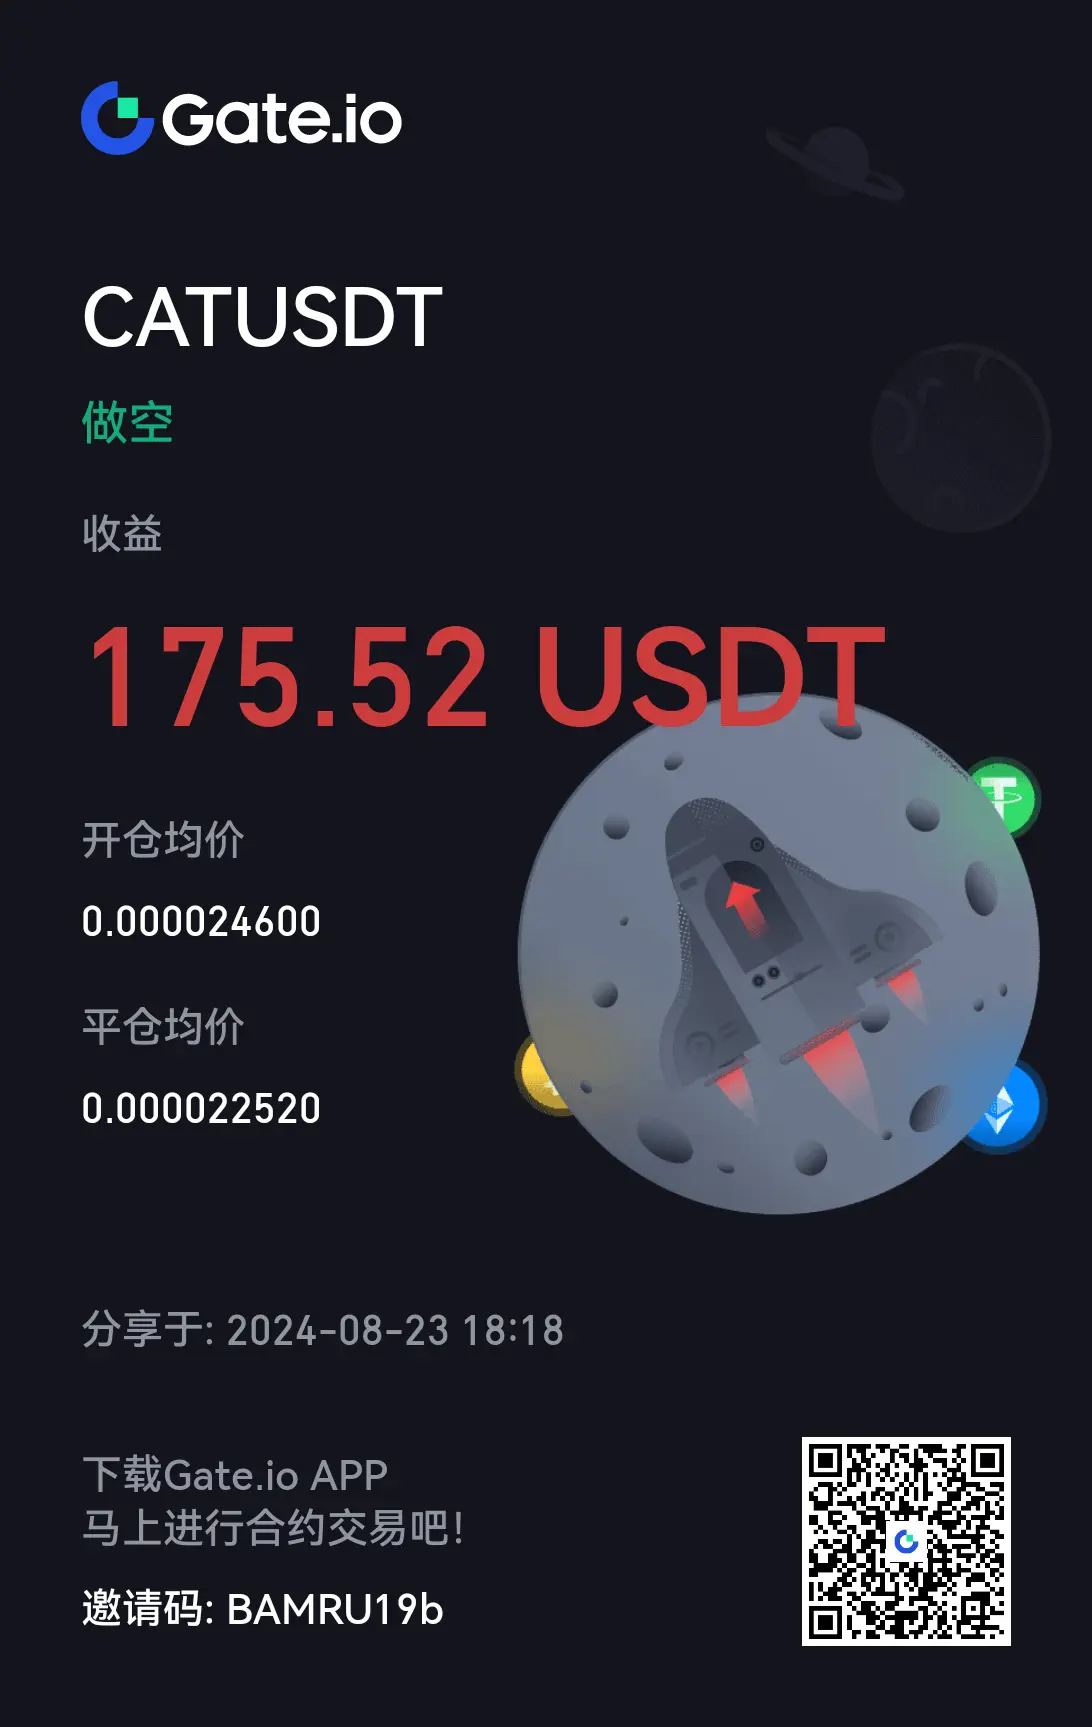
#晒出我的合约收益#
[The user has shared his/her trading data. Go to the App to view more.]
- Reward
- like
- 1
- Repost
- Share
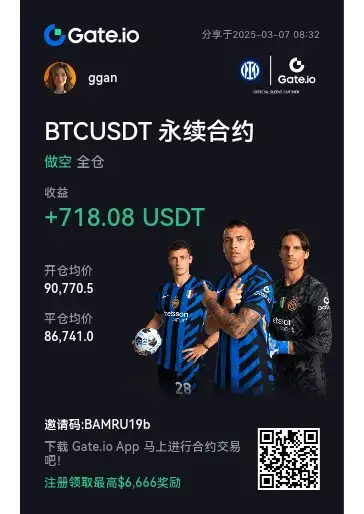
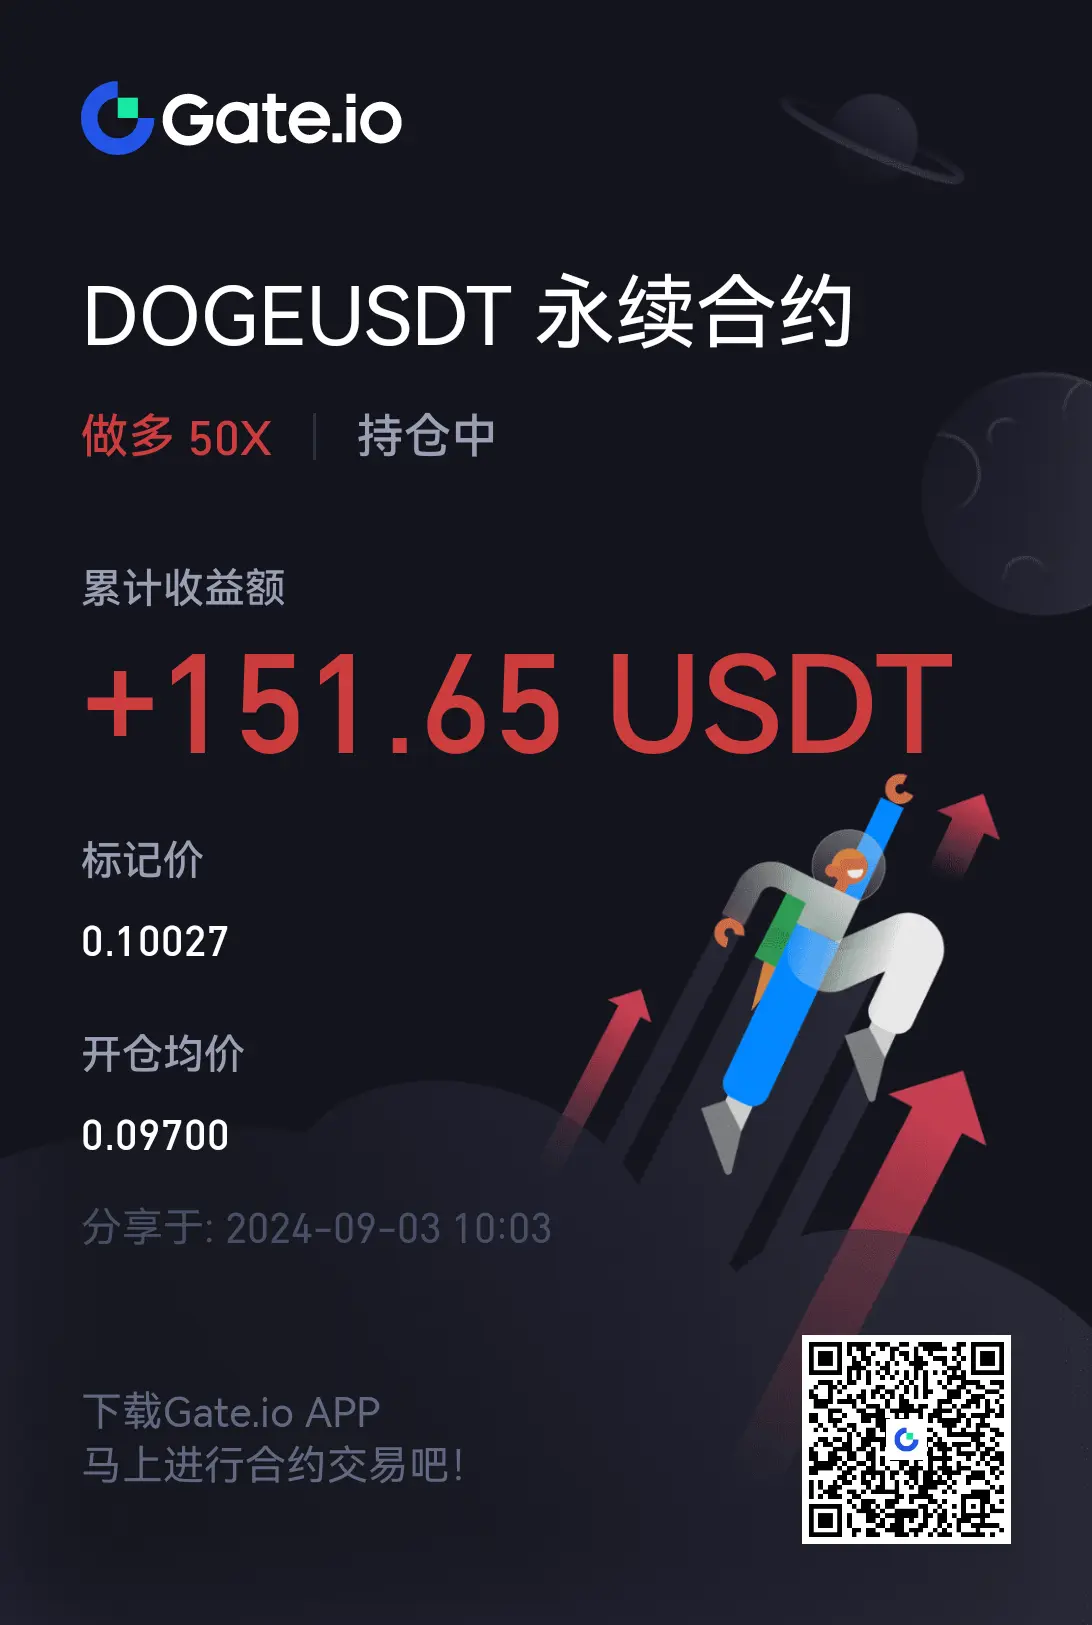
#晒出我的持仓收益#
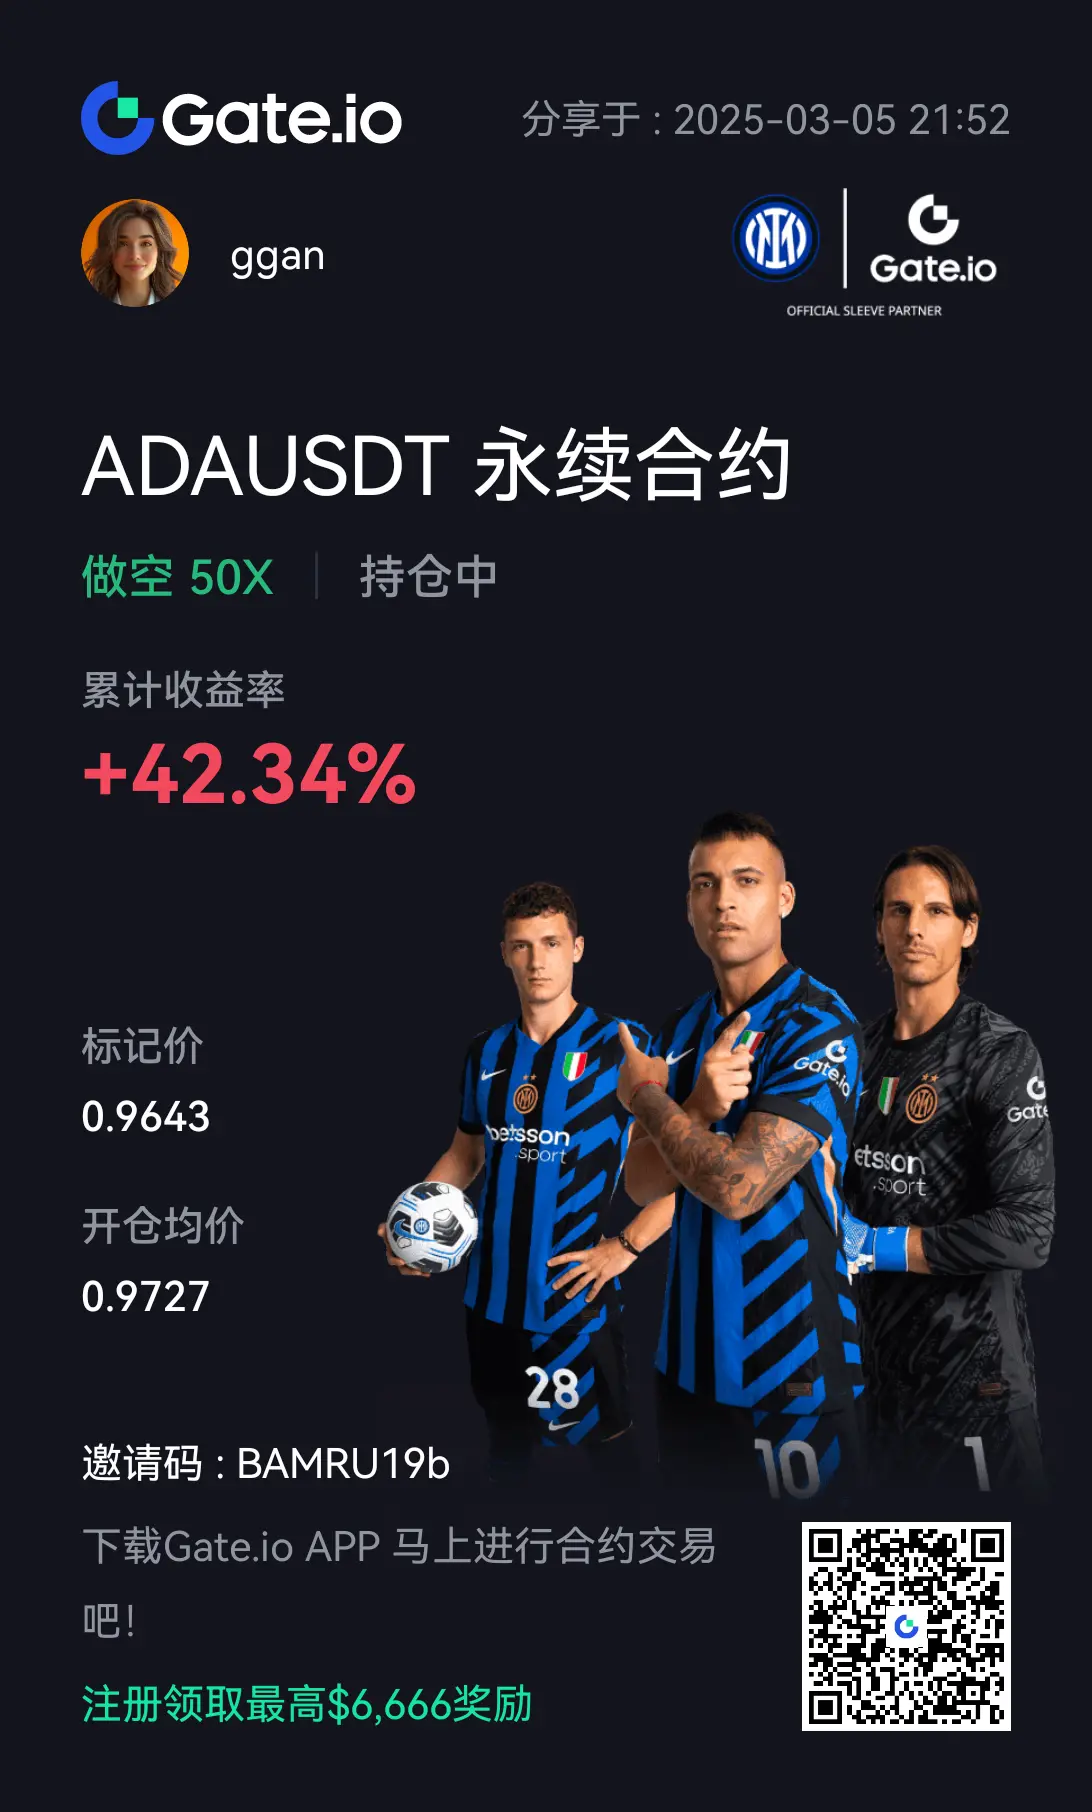
[The user has shared his/her trading data. Go to the App to view more.]
- Reward
- like
- Comment
- Repost
- Share
1. Overall Analysis
Recently, the price has fluctuated within the range of 95,000-102,000.
In the short term, the market as a whole is showing a turbulent downward trend, with prices fluctuating in the range of 95000-100000 and rebounding multiple times. The candlestick pattern shows the alternation of bullish and bearish forces, and TD and moving average indicators both indicate that the market may be at a key turning point. The short-term moving average and EMA both show a downward bias in the market, while the BOLL indicator shows a decrease in market volatility, possibly continuing to cons
View OriginalRecently, the price has fluctuated within the range of 95,000-102,000.
In the short term, the market as a whole is showing a turbulent downward trend, with prices fluctuating in the range of 95000-100000 and rebounding multiple times. The candlestick pattern shows the alternation of bullish and bearish forces, and TD and moving average indicators both indicate that the market may be at a key turning point. The short-term moving average and EMA both show a downward bias in the market, while the BOLL indicator shows a decrease in market volatility, possibly continuing to cons
[The user has shared his/her trading data. Go to the App to view more.]
- Reward
- like
- Comment
- Repost
- Share
A miss is as good as a mile
View Original- Reward
- like
- 1
- Repost
- Share
A322119322119 :
:
All in All in 🙌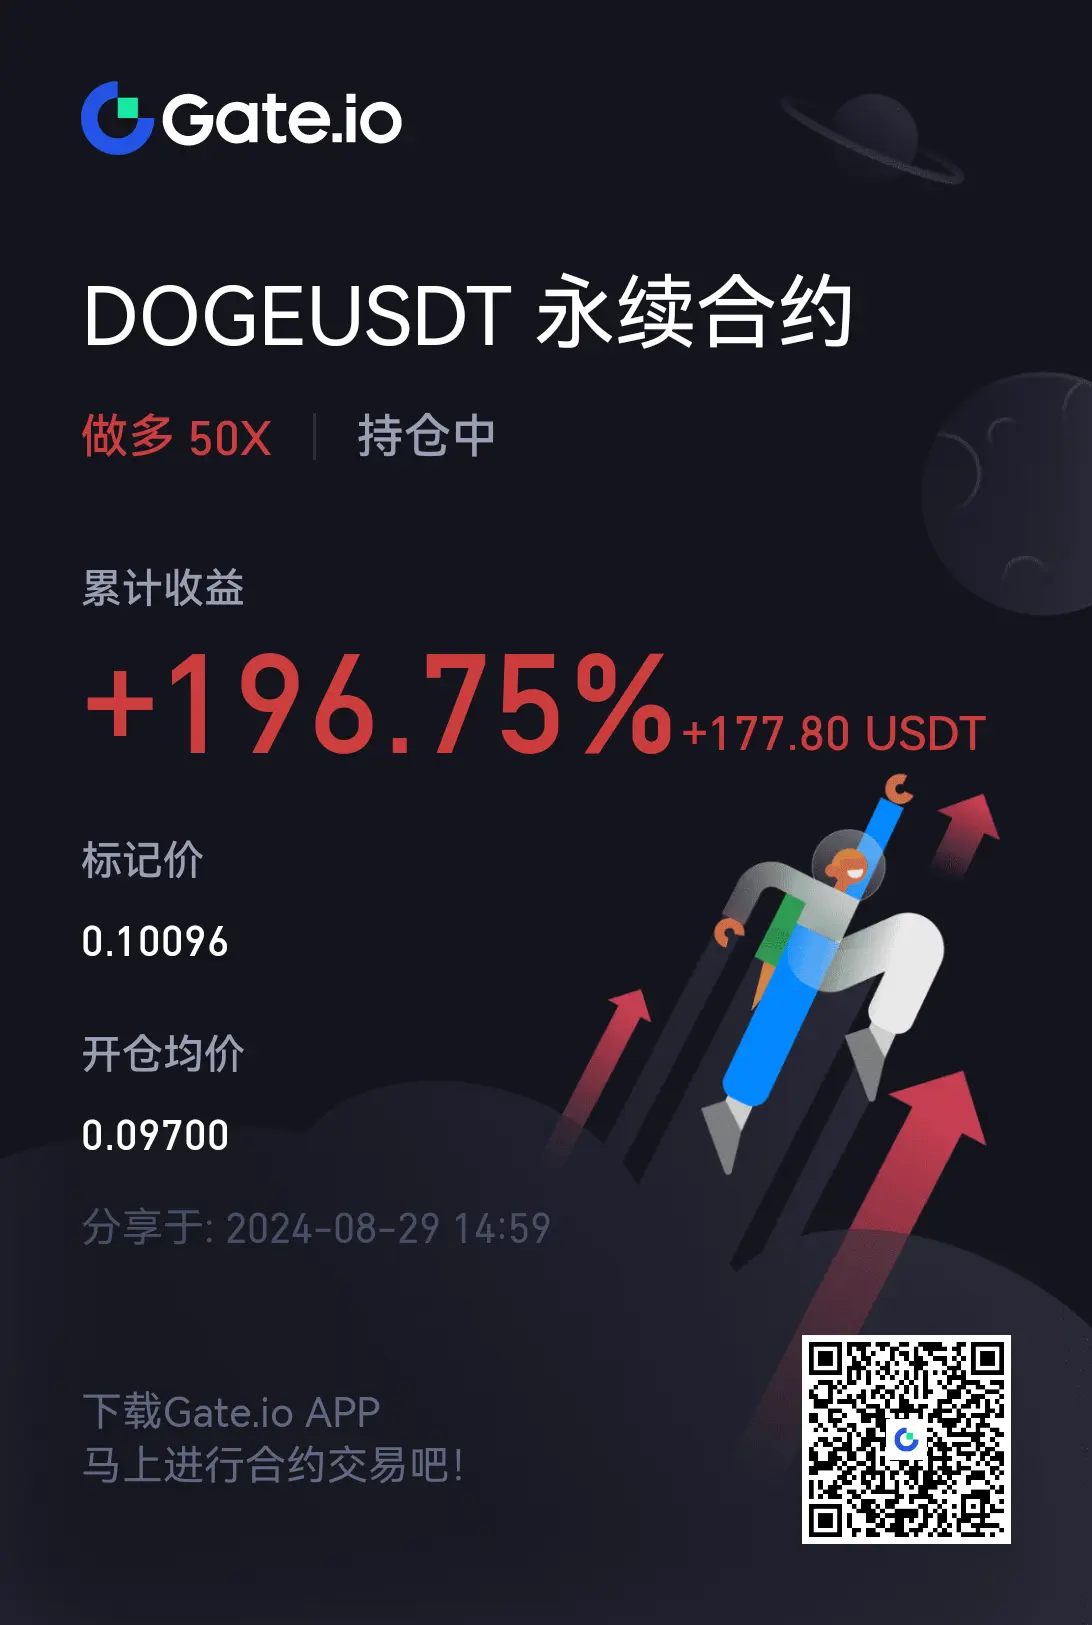
Target 0.11
View OriginalSubscribers Only
Subscribe now to view exclusive content[The user has shared his/her trading data. Go to the App to view more.]
- Reward
- like
- Comment
- Repost
- Share