Trade
Basic
Futures
Futures
Hundreds of contracts settled in USDT or BTC
TradFi
Gold
Trade global traditional assets with USDT in one place
Options
Hot
Trade European-style vanilla options
Unified Account
Maximize your capital efficiency
Demo Trading
Futures Kickoff
Get prepared for your futures trading
Futures Events
Participate in events to win generous rewards
Demo Trading
Use virtual funds to experience risk-free trading
Earn
Launch
CandyDrop
Collect candies to earn airdrops
Launchpool
Quick staking, earn potential new tokens
HODLer Airdrop
Hold GT and get massive airdrops for free
Launchpad
Be early to the next big token project
Alpha Points
Trade on-chain assets and enjoy airdrop rewards!
Futures Points
Earn futures points and claim airdrop rewards
Investment
Simple Earn
Earn interests with idle tokens
Auto-Invest
Auto-invest on a regular basis
Dual Investment
Buy low and sell high to take profits from price fluctuations
Soft Staking
Earn rewards with flexible staking
Crypto Loan
0 Fees
Pledge one crypto to borrow another
Lending Center
One-stop lending hub
VIP Wealth Hub
Customized wealth management empowers your assets growth
Private Wealth Management
Customized asset management to grow your digital assets
Quant Fund
Top asset management team helps you profit without hassle
Staking
Stake cryptos to earn in PoS products
Smart Leverage
New
No forced liquidation before maturity, worry-free leveraged gains
GUSD Minting
Use USDT/USDC to mint GUSD for treasury-level yields
More
CryptoAnalyZen
No content yet
CryptoAnalyZen
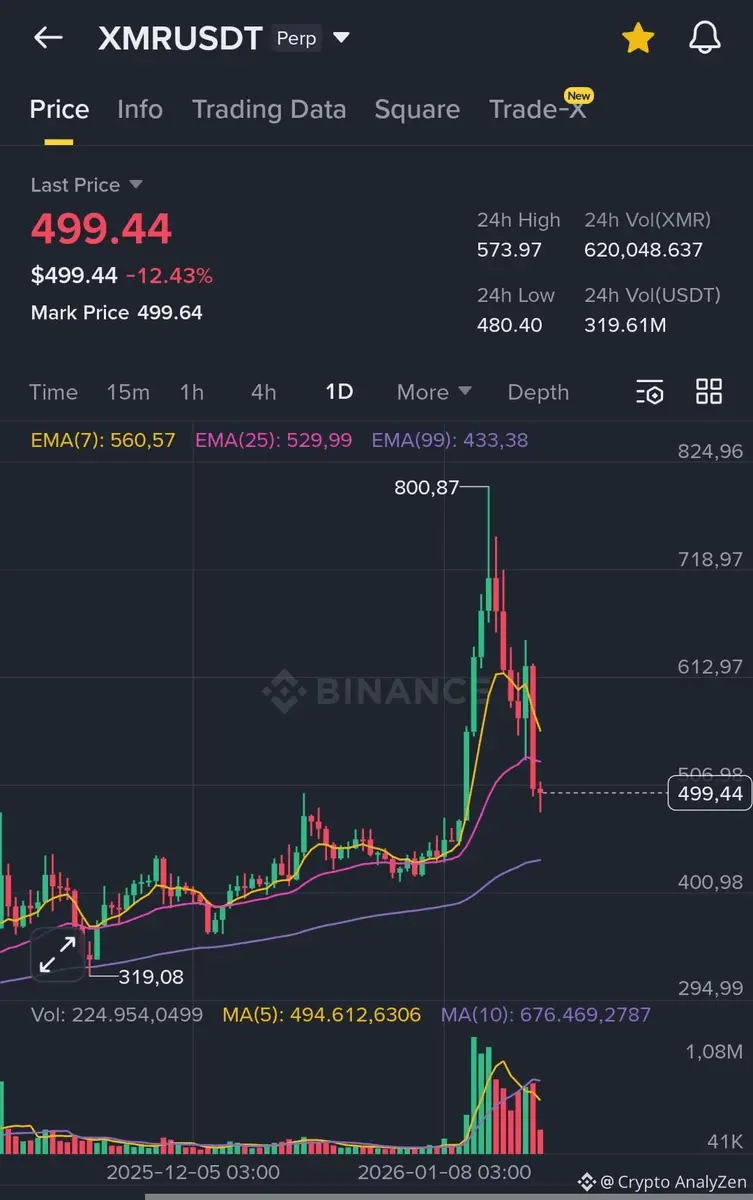
$XMR - sharp decline without retesting the upper zone\nMy last downside level was marked as 499\n\nIt\'s done here\n\nA sharp price decline with a slight decline in open interest - I expect a rebound up to the previous low on 4H\n
- Reward
- like
- Comment
- Repost
- Share
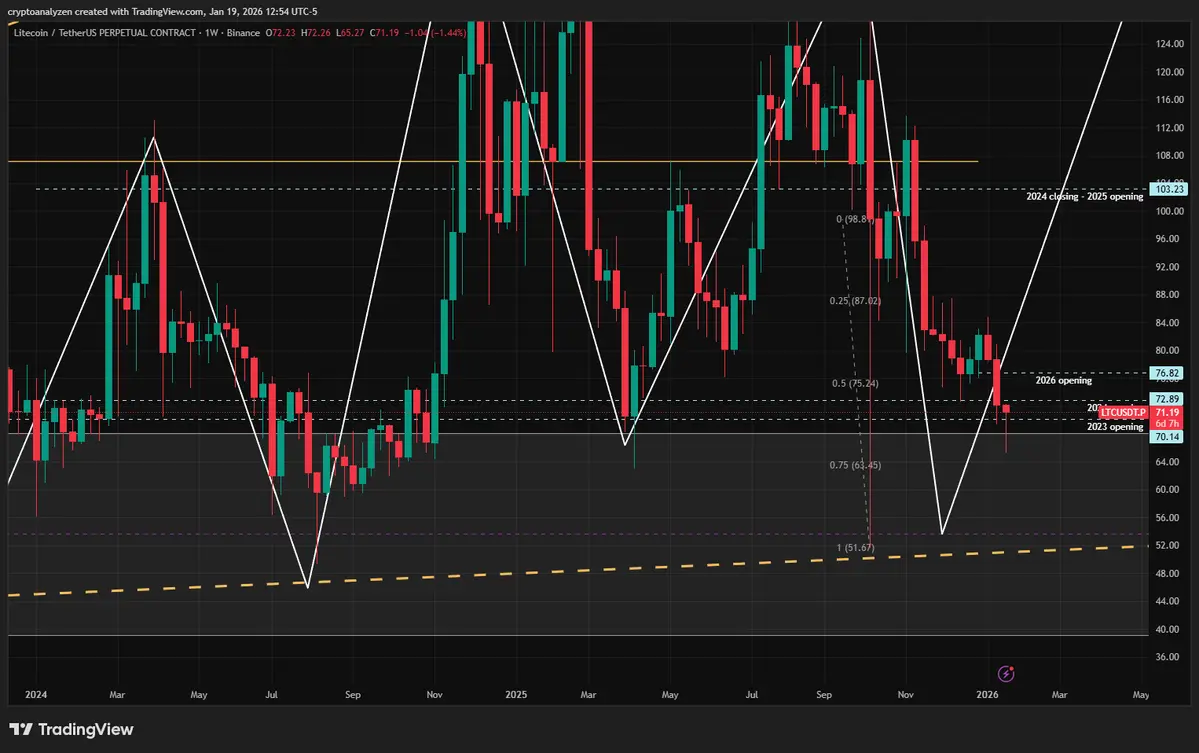
$LTC The price continues to decline as open interest increases.
As you recall, the forecast was for a decline below 68, with a test of the October squeeze low (52).
This is a compressed spring effect - watch closely for the possibility of a rapid upward move as soon as open interest begins to decline.
#CryptoMarketPullback #$LTC
As you recall, the forecast was for a decline below 68, with a test of the October squeeze low (52).
This is a compressed spring effect - watch closely for the possibility of a rapid upward move as soon as open interest begins to decline.
#CryptoMarketPullback #$LTC
LTC-2,39%
- Reward
- like
- Comment
- Repost
- Share
- Reward
- 1
- Comment
- Repost
- Share
$XMR Update
• 50% daily upper tail was tested last week → after that price almost hit the old ATH
• New 50% upper tail formed at 686.85
• Gap below (clear on 4H)
After CNY dump + fast rebound into gap base →
Next likely: pullback to weekly open 572.83 → then fill gap 4H
• 50% daily upper tail was tested last week → after that price almost hit the old ATH
• New 50% upper tail formed at 686.85
• Gap below (clear on 4H)
After CNY dump + fast rebound into gap base →
Next likely: pullback to weekly open 572.83 → then fill gap 4H

- Reward
- like
- Comment
- Repost
- Share
- Reward
- 1
- Comment
- Repost
- Share
- Reward
- like
- Comment
- Repost
- Share
$XMR Long-upper tailed daily candle formed.
Daily close near 23% Fib of last uptrend → price moved below 50% daily upper tail
Next: possible Asian high retest (751)
If classic rejection forms
(green daily → red daily, open/close near 50%)
it signals reversal + continuation ↓
Daily close near 23% Fib of last uptrend → price moved below 50% daily upper tail
Next: possible Asian high retest (751)
If classic rejection forms
(green daily → red daily, open/close near 50%)
it signals reversal + continuation ↓
- Reward
- like
- Comment
- Repost
- Share
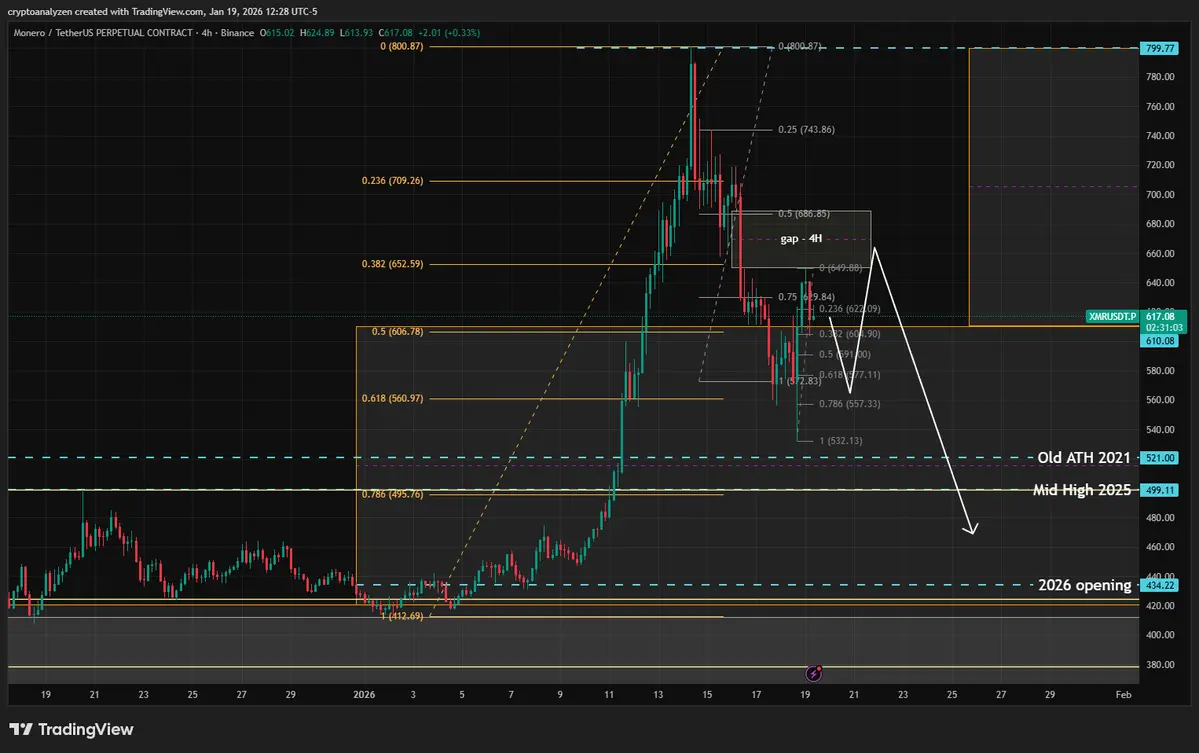
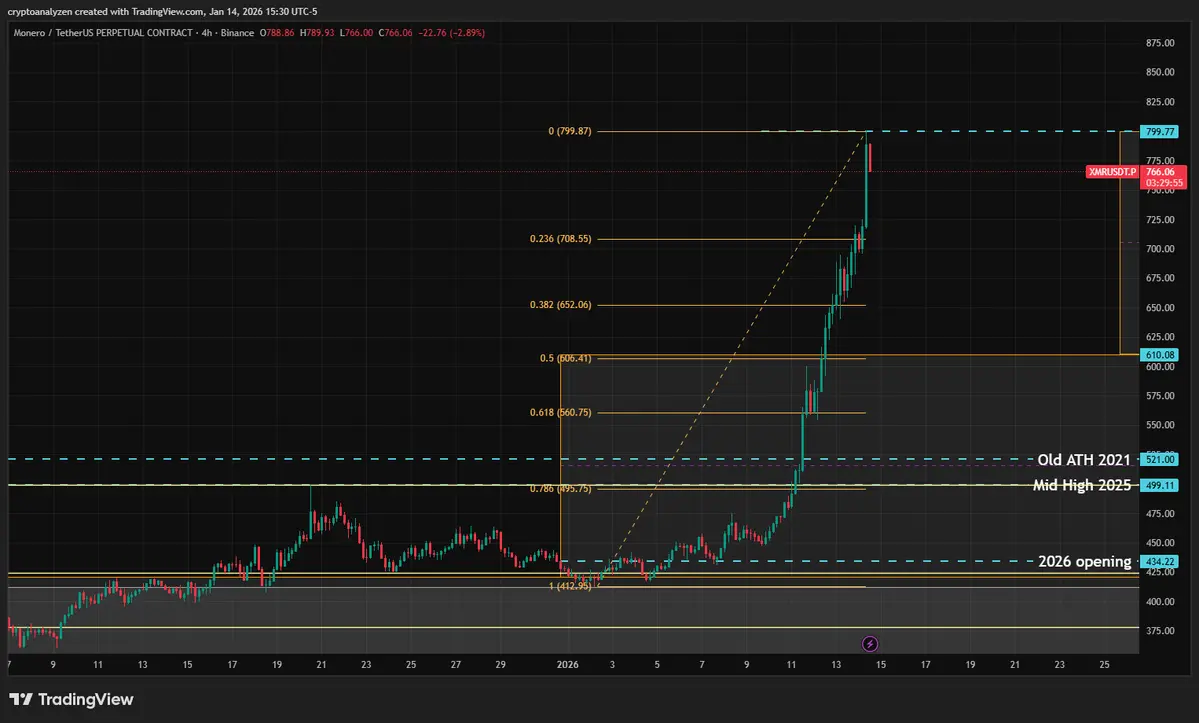
$XMR — I opened a short with a very tight stop, in case the uptrend continued. Shorts were being opened en masse, which means someone was selling (closing) longs very well.
On the 4H chart, Fibonacci levels align beautifully with the measured ranges.
On the 4H chart, Fibonacci levels align beautifully with the measured ranges.
- Reward
- like
- Comment
- Repost
- Share
- Reward
- like
- 1
- Repost
- Share
It'sMyTurnToTurnTheTables. :
:
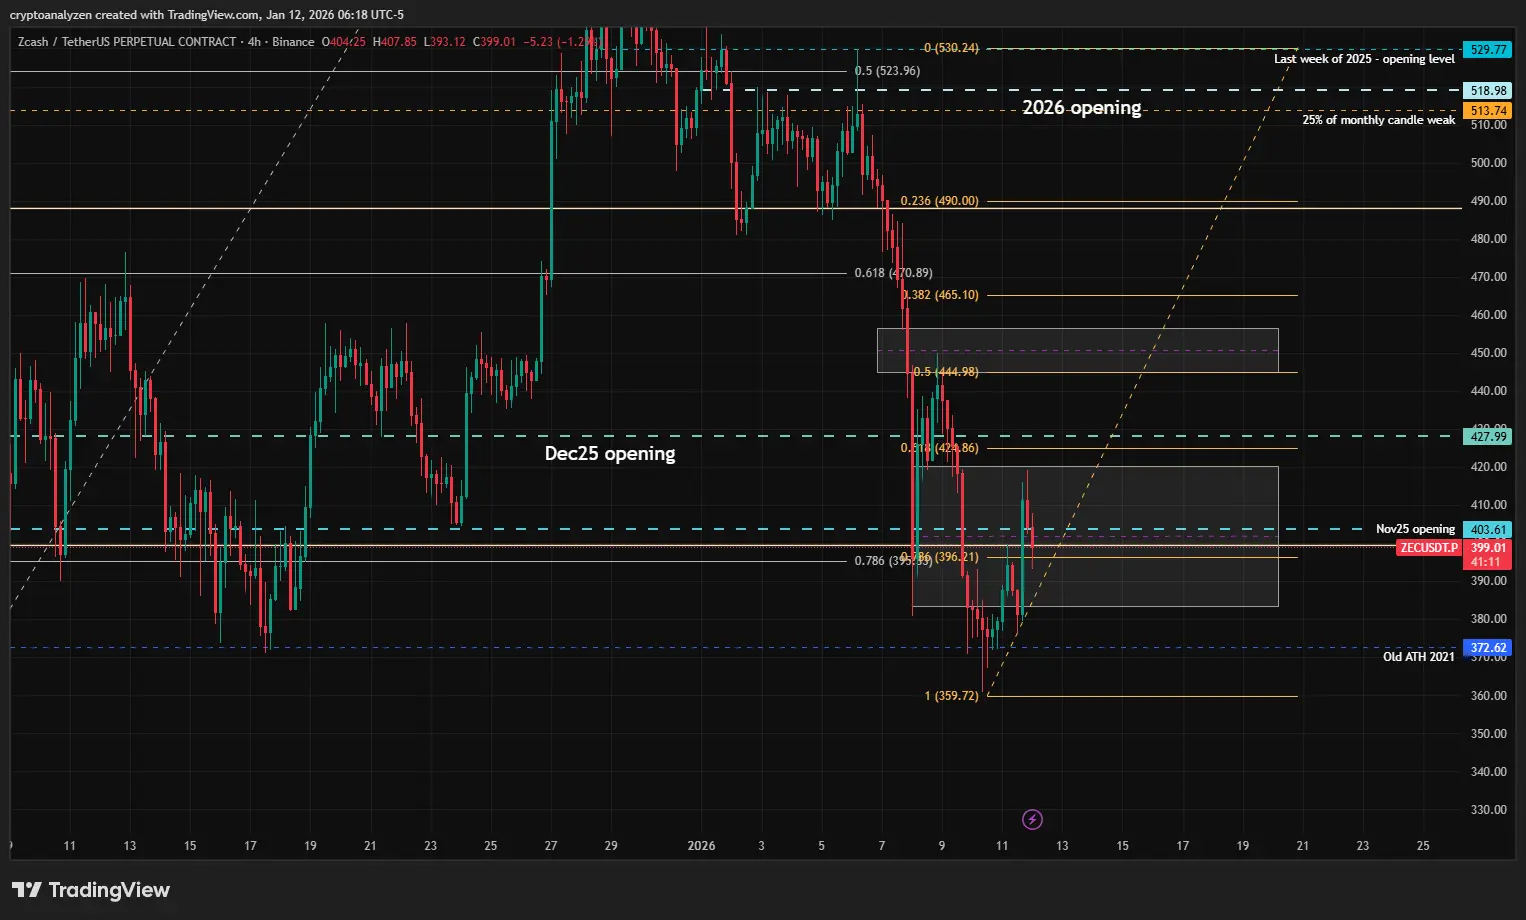
Increase by a few percent$ZEC update
Price has reached the lower boundary of the highlighted range.
After covering almost the entire December range within the first two weeks of the new year, momentum is slowing.
Weekly candle prints a clear red body, increasing the probability of a further downside move.
Market sentiment currently favors a continuation lower.
Scenario to watch:
A possible fake breakout above the December 2025 open price (427.99), followed by a rejection.
Plan:
Considering a small speculative long with tight risk control.
Targets: partial scaling at key Fibonacci retracement levels of the previous
ZEC-9,55%
- Reward
- like
- Comment
- Repost
- Share
I just wrote new post on Substack
- Reward
- like
- Comment
- Repost
- Share
- Reward
- 1
- 2
- Repost
- Share
GateUser-c5543907:
Hold tight 💪View More
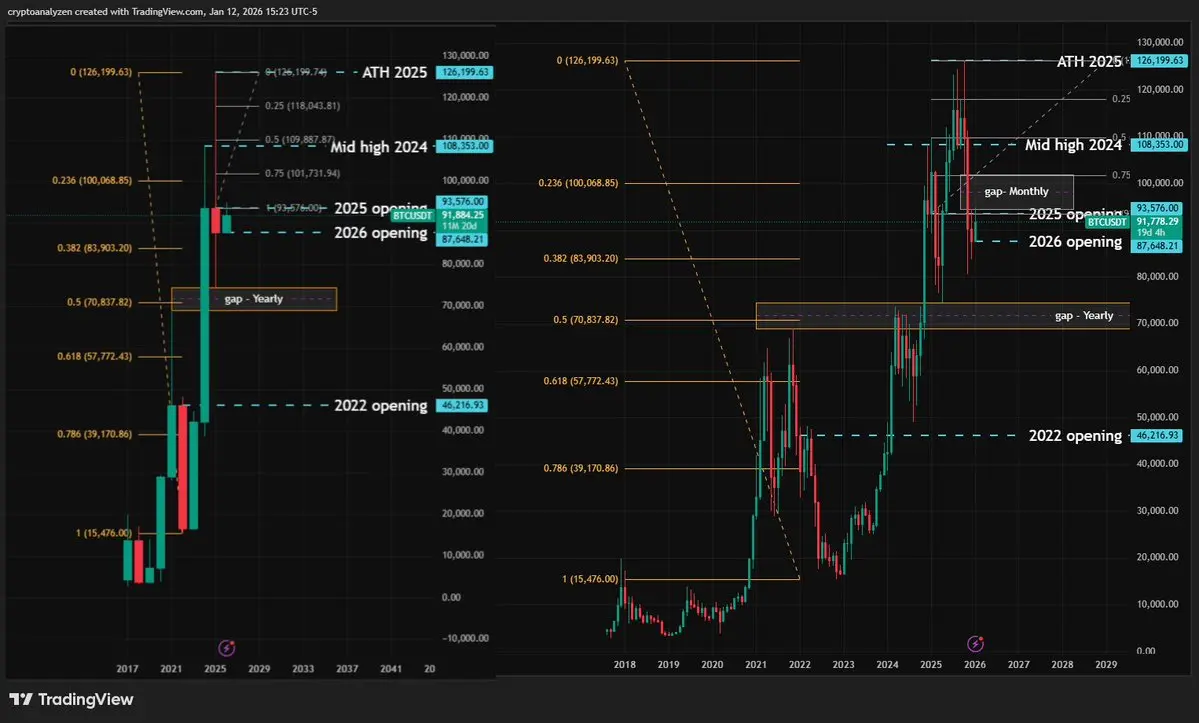
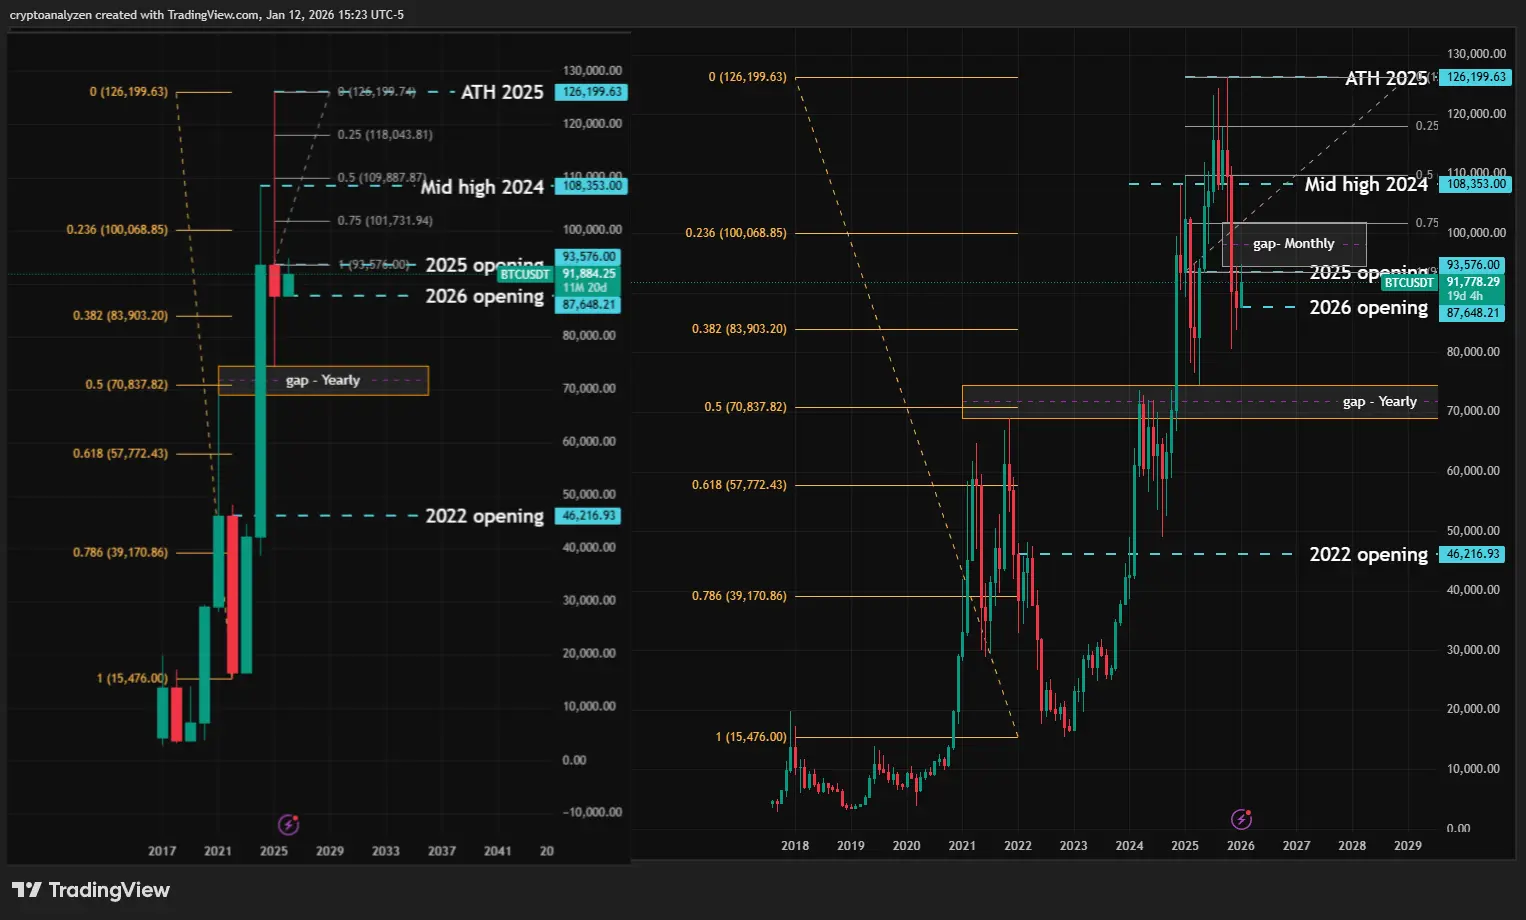
$BTC — 2026 Outlook
The annual chart now shows a scenario different from what was expected at the end of 2025.
Three upward impulse waves are clearly visible. The third wave that started in 2023 ended at the 2025 ATH of 126,199.63. The red yearly candle with a long upper wick increases the probability of a correction.
A test of the 2024 mid-high at 108,353.00 remains possible. This level is just below 109,887.87 (50% of the 2025 upper tail).
Early 2026 already showed attempts to reclaim the 2025 opening level — 93,576.00.
On the monthly chart, there is a gap between 102,000.00 and 94,588.99, a
BTC-3,27%
- Reward
- 1
- 1
- Repost
- Share
GateUser-c5543907:
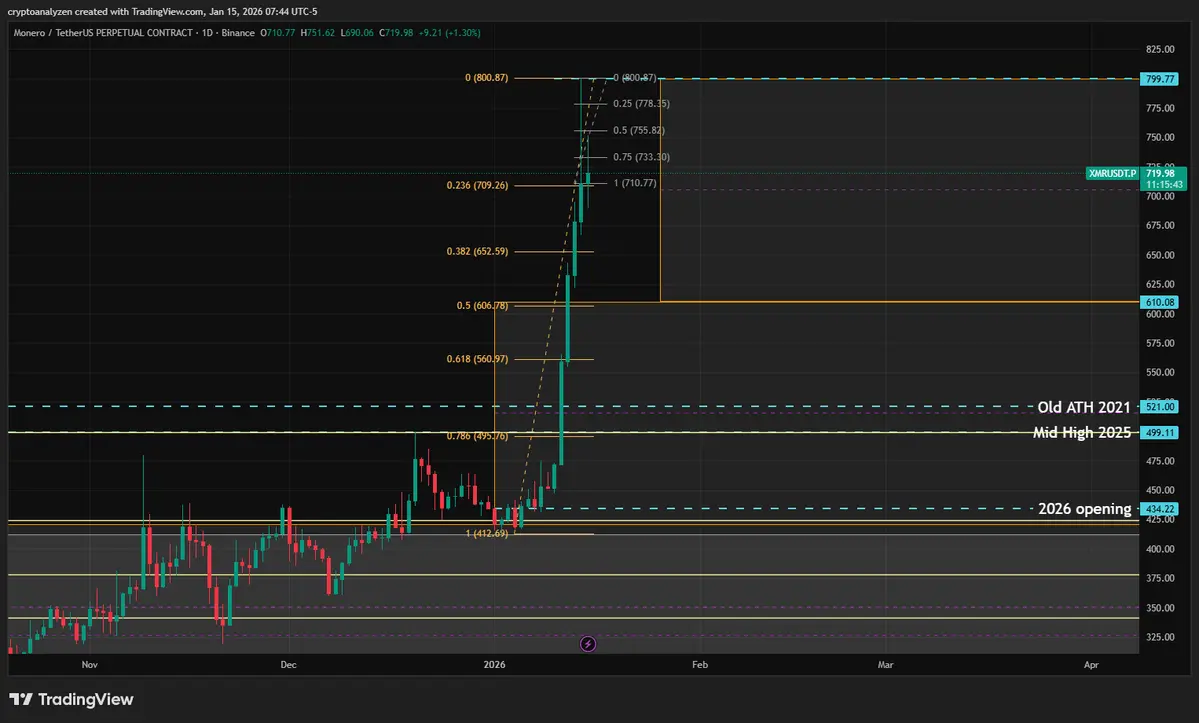
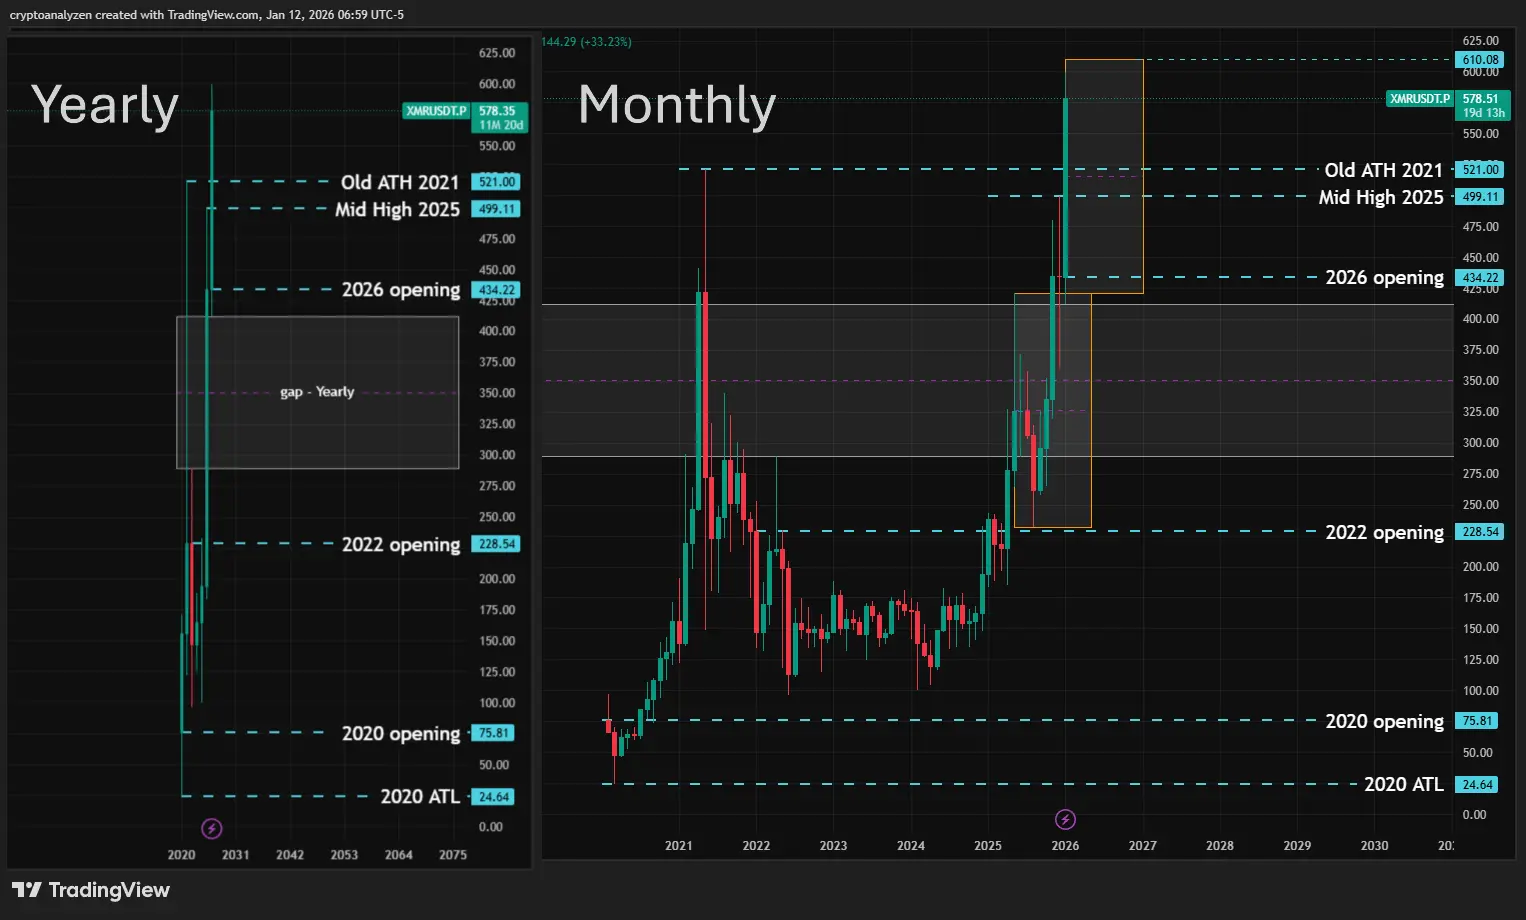
Vryvaytes 🚀$XMR
New all-time high formed in early January.
I’m approaching this situation starting from the annual chart.
In 2025 the asset traded in a very wide range: 183.42–499.11
Price ended 2025 close to 75% of the 2021 candle top (ATH 521.00)
This supports the idea of continued upside
However, I would prefer to see a healthy correction:
ideally toward 50% Fibonacci of the 2025 range → 341.27
this level is just below the midpoint of the current gap zone between the 2026 low and 2023 high
If we project the previous pullback (Jan–Aug 2025), the level 610.08 becomes visible — meaning we are very close
- Reward
- like
- Comment
- Repost
- Share
- Reward
- like
- Comment
- Repost
- Share
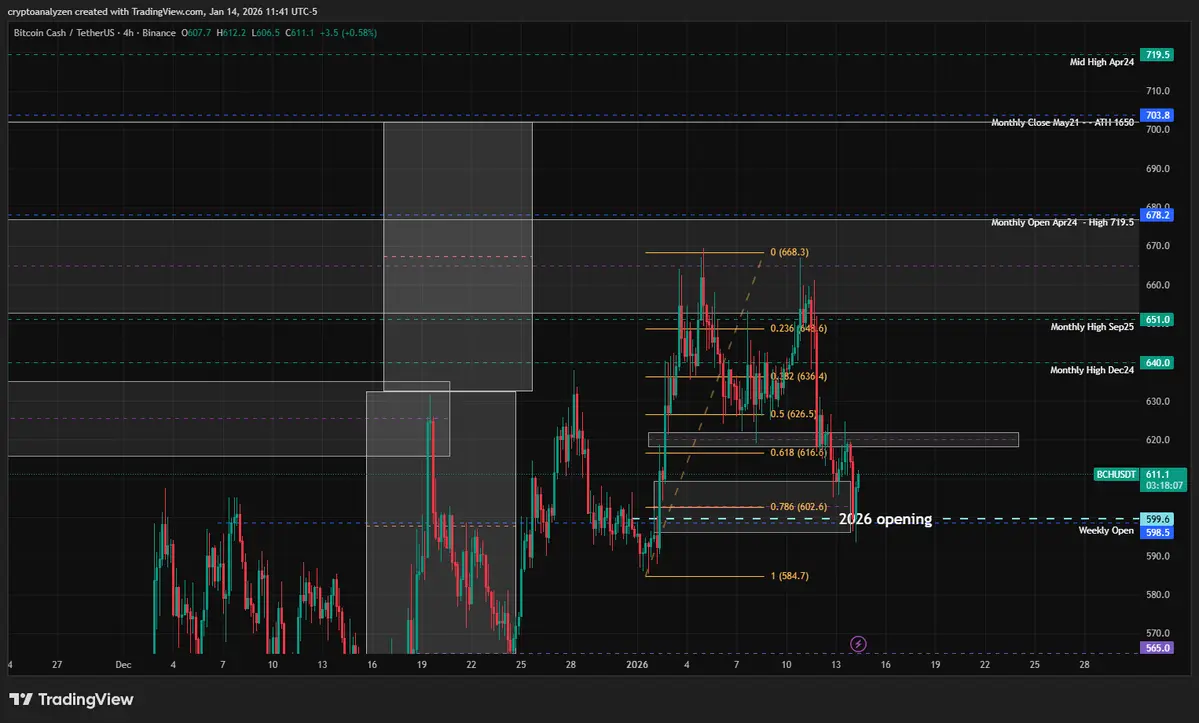
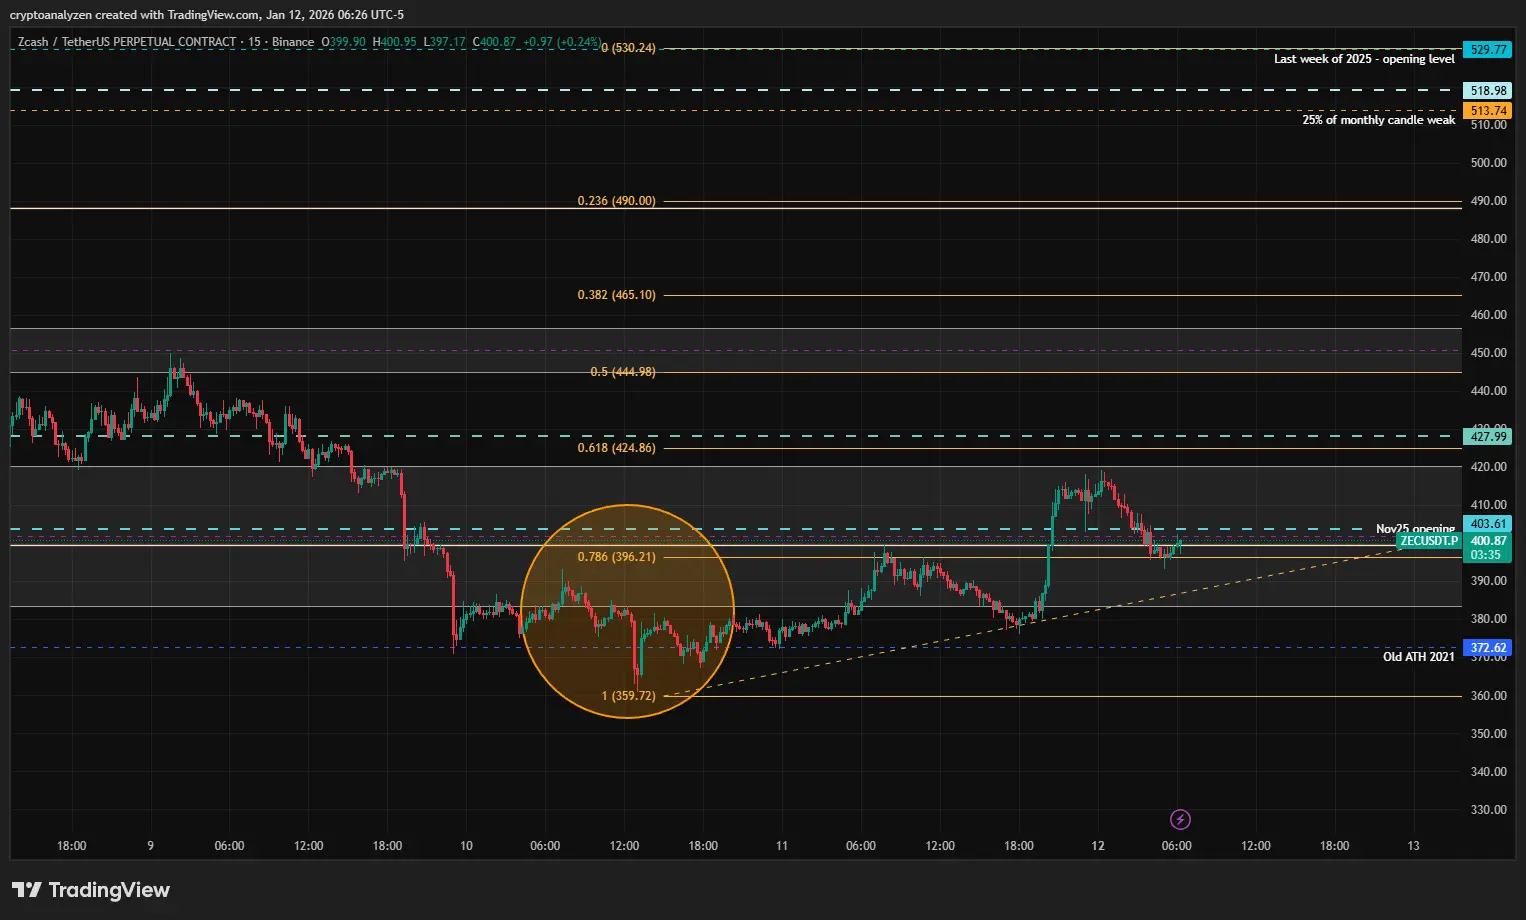
$ZEC – Quick Review
The bullish scenario has been validated: price broke through the November 2025 open (403.61) and fully filled the previous downside gap.
The lower border of that gap aligns with the breaker start at 383 (clearly visible on M15). This move ran liquidity below the prior mid-low and even under the 2021 ATH at 372.62, suggesting classic stop-hunting behavior.
If bullish continuation follows, the retracement phase is likely completed. Any moves below the mid-zone should be treated as areas for building long exposure.
#ZEC #ZEC #ALTCOIN #DailyMarketOverview
ZEC-9,55%
- Reward
- like
- Comment
- Repost
- Share
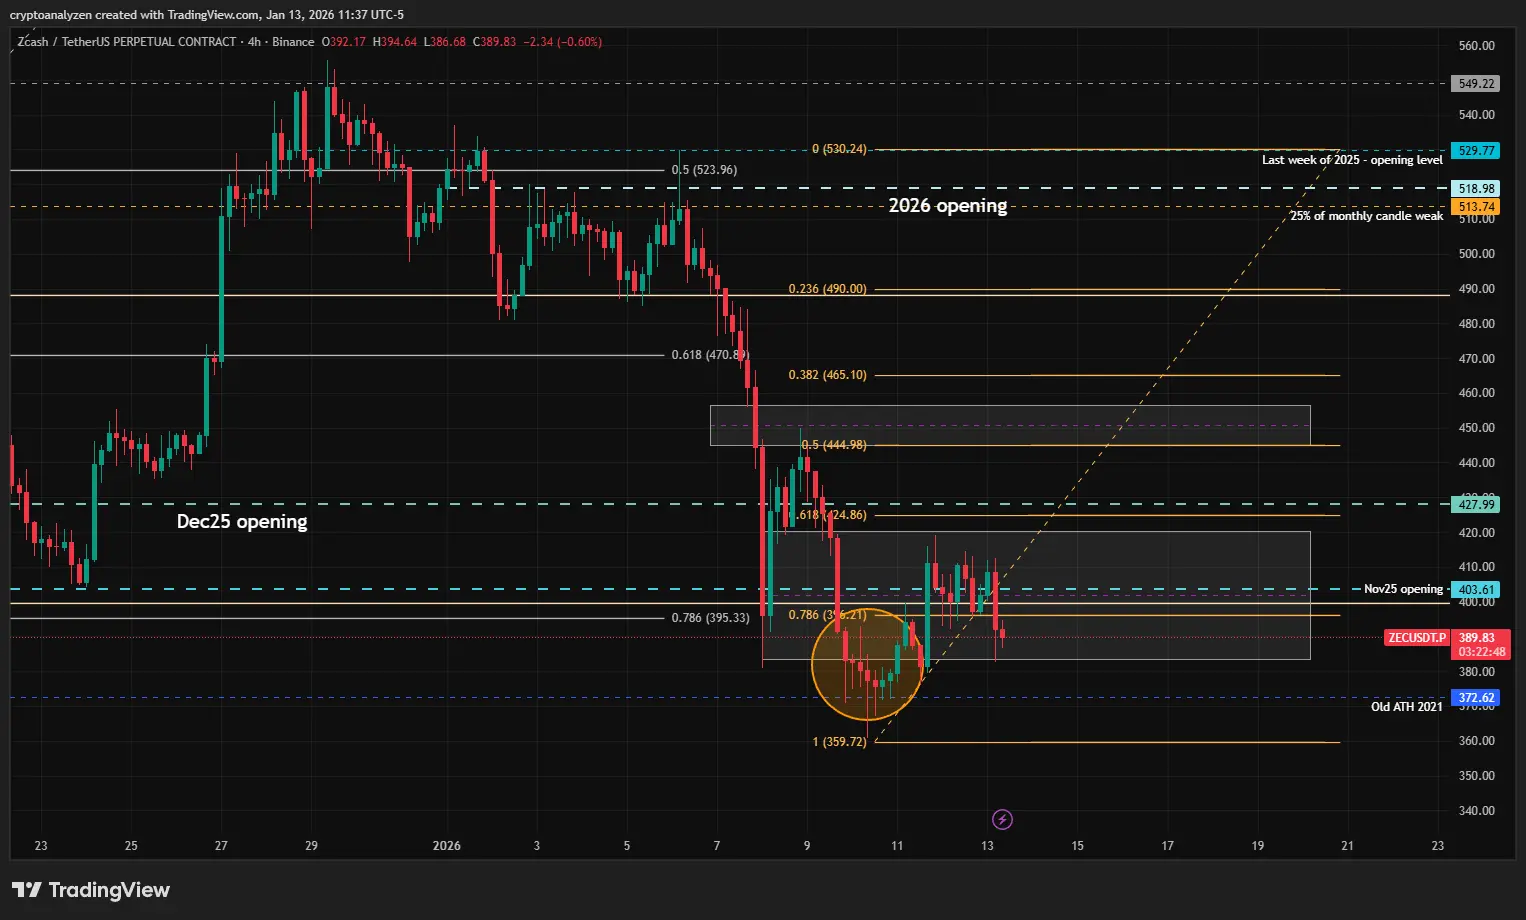
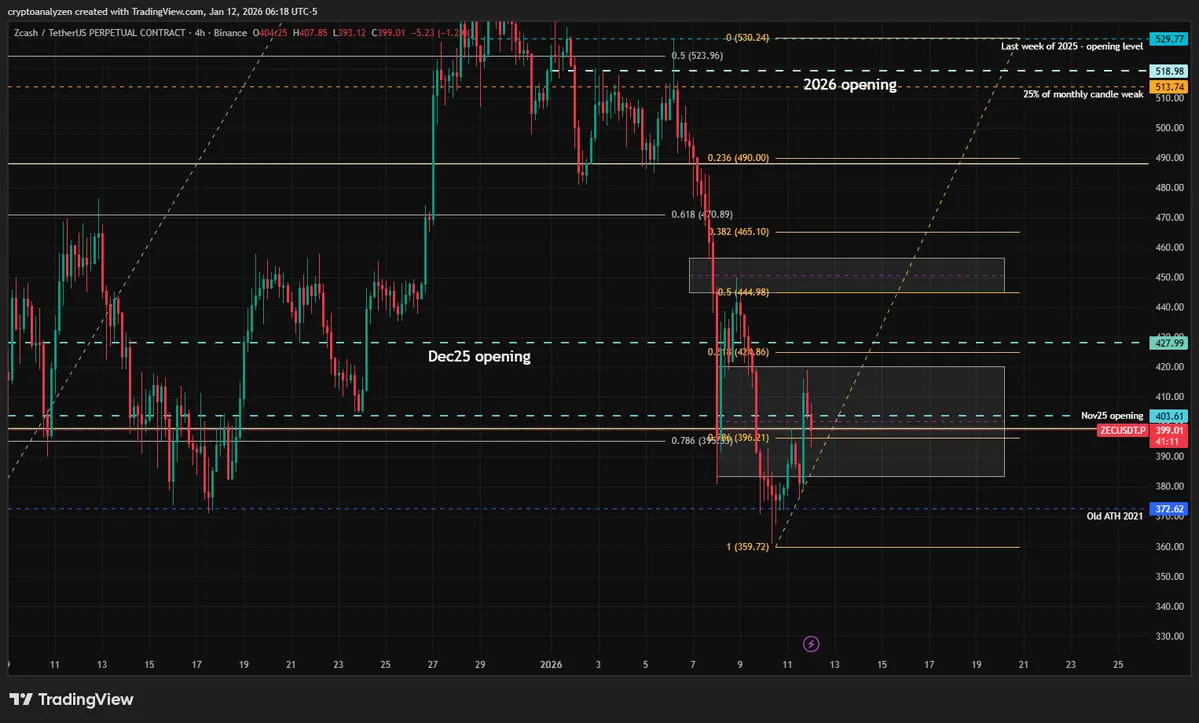
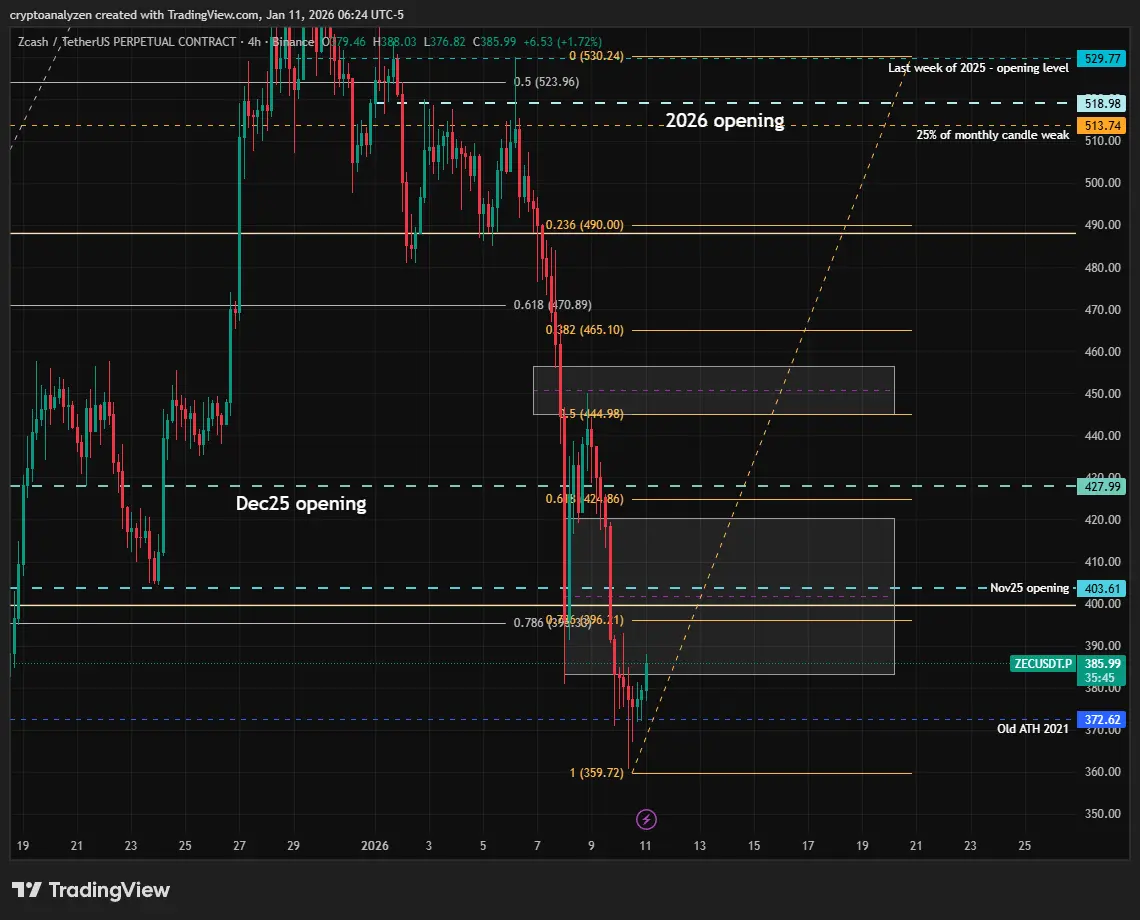
$ZEC update
Even though the yearly outlook for ZEC is mostly bearish, and despite the recent news about the team, I think we may still see a test of higher levels this month.
Watch the following levels:
• 403.61 — November 2025 open
• 427.99 — December 2025 open
• the gap zone (456-444) above the 50% Fibonacci level of this year’s full downside move
If momentum strengthens, price could even push above the 2026 opening level, which may offer a chance to open fresh short setups.
Yesterday’s drop came with rising open interest, which looks more like new longs being opened rather than longs being
ZEC-9,55%
- Reward
- 1
- 1
- Repost
- Share
CryptoAnalyZen:
Buy To Earn 💎$TRX — 2026 outlook
TRX is currently 6th in the TOP-20 CMC Index.
After a major rally in 2024 that set a new ATH of 0.4500, the price spent last year trading in a wide range, testing 23% Fibonacci of the 2024 yearly move, and moving slightly above 50% of the yearly candle tail.
Right now, direction is uncertain, but a rejection structure may be forming.
If this plays out, price could break below the 2026 and 2025 opens and move toward the annual gap zone between 0.2011 and 0.18, which also aligns with the 62% Fibonacci retracement of the 0.0068–0.45 range.
#TRX #trx #tron
TRX-1,16%

- Reward
- 1
- 1
- Repost
- Share
CryptoAnalyZen:
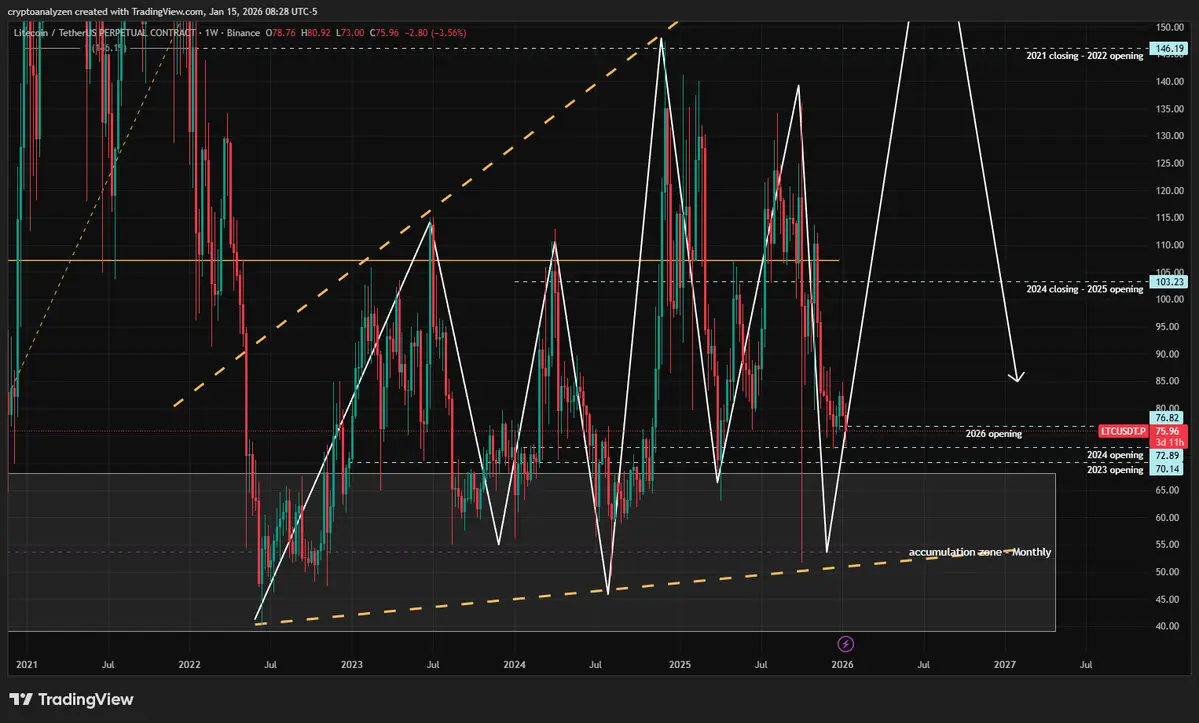
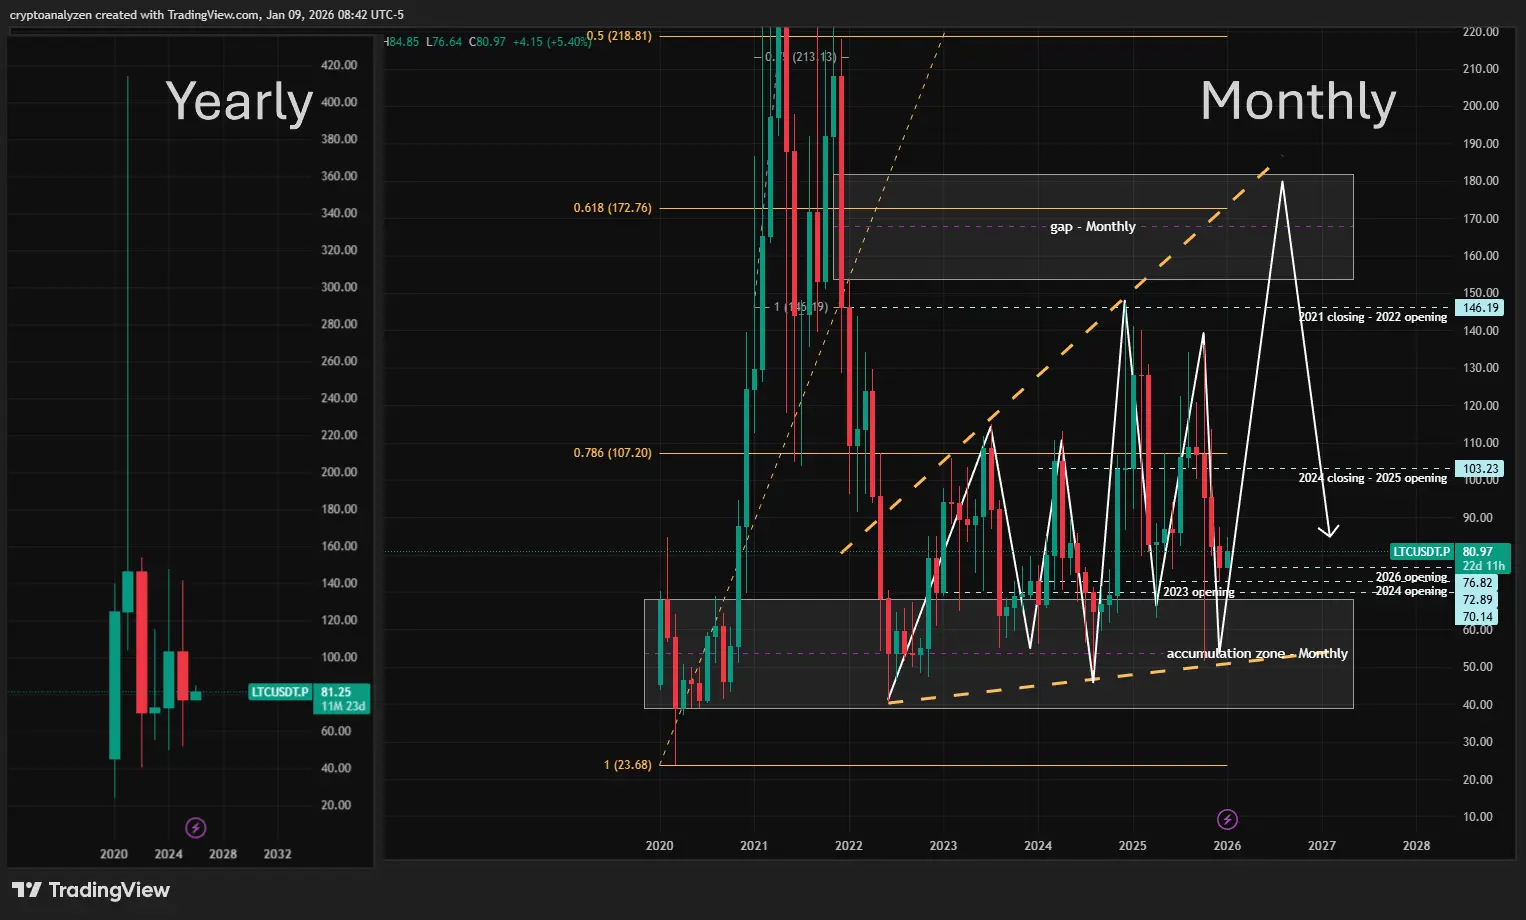
2026 GOGOGO 👊$LTC – 2026 outlook
LTC currently holds 15th place in the TOP-20 CMC Index, keeping it on my watchlist.
After the ATH in May 2021 (413.94) and the following decline, the price is still trying to “fight gravity,” but it has been unable to break above the 2022 opening price at 146.19.
On the monthly chart, an expanding triangle pattern is visible, formed around the 2020–2021 accumulation zone.
If the pattern repeats, the next wave could push price higher into the gap between 181.91 and 153.79, aligning with the 62% Fibonacci level of the 23.68–413.94 range.
For now, I would like to see:
• a tes
LTC-2,39%
- Reward
- like
- Comment
- Repost
- Share
- Reward
- like
- 1
- Repost
- Share
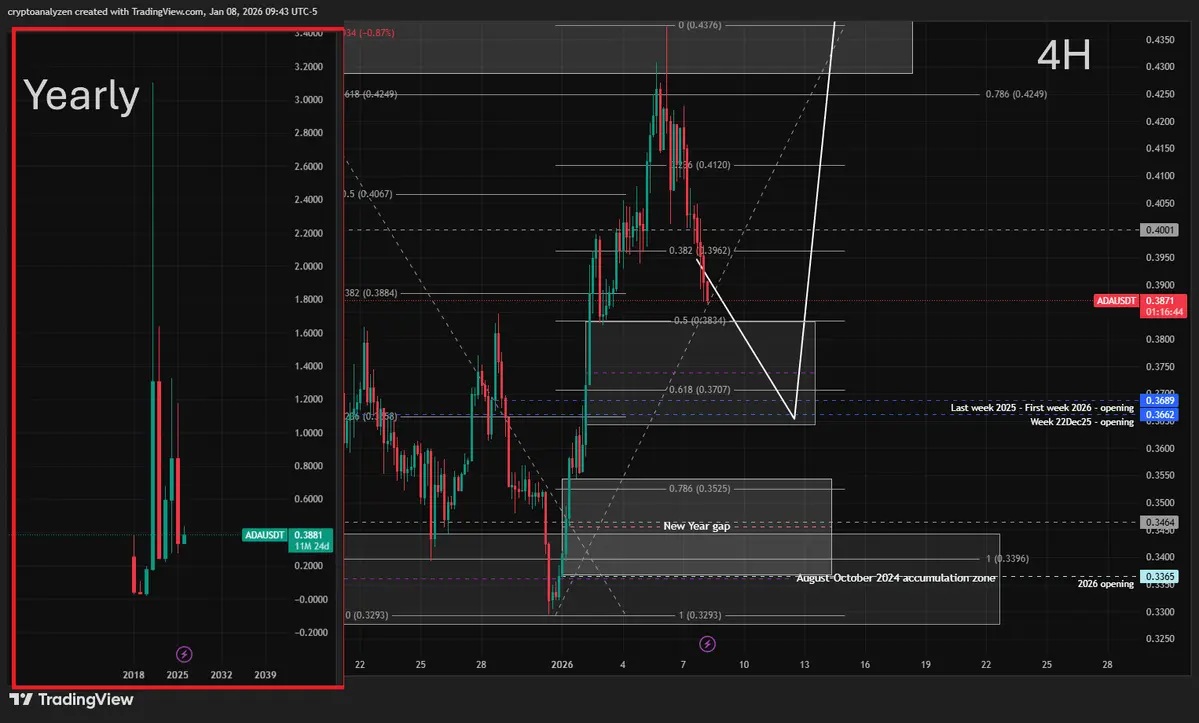
CryptoAnalyZen:
Ideally, we want the gap filled within the 50–62% Fibonacci zone of 0.32–0.43. For bullish continuation, price should not drop back into the New Year gap. If downside resumes, watch: • 0.2737 (2025 low) • 0.2458 (2023 open) • 0.1069–0.22 gap zoneTrending Topics
View More355.67K Popularity
21.44K Popularity
62.99K Popularity
15.32K Popularity
465.26K Popularity
Pin