Trade
Basic
Futures
Futures
Hundreds of contracts settled in USDT or BTC
TradFi
Gold
Trade global traditional assets with USDT in one place
Options
Hot
Trade European-style vanilla options
Unified Account
Maximize your capital efficiency
Demo Trading
Futures Kickoff
Get prepared for your futures trading
Futures Events
Participate in events to win generous rewards
Demo Trading
Use virtual funds to experience risk-free trading
Earn
Launch
CandyDrop
Collect candies to earn airdrops
Launchpool
Quick staking, earn potential new tokens
HODLer Airdrop
Hold GT and get massive airdrops for free
Launchpad
Be early to the next big token project
Alpha Points
Trade on-chain assets and enjoy airdrop rewards!
Futures Points
Earn futures points and claim airdrop rewards
Investment
Simple Earn
Earn interests with idle tokens
Auto-Invest
Auto-invest on a regular basis
Dual Investment
Buy low and sell high to take profits from price fluctuations
Soft Staking
Earn rewards with flexible staking
Crypto Loan
0 Fees
Pledge one crypto to borrow another
Lending Center
One-stop lending hub
VIP Wealth Hub
Customized wealth management empowers your assets growth
Private Wealth Management
Customized asset management to grow your digital assets
Quant Fund
Top asset management team helps you profit without hassle
Staking
Stake cryptos to earn in PoS products
Smart Leverage
New
No forced liquidation before maturity, worry-free leveraged gains
GUSD Minting
Use USDT/USDC to mint GUSD for treasury-level yields
More
CryptoRainRain
No content yet
CryptoRainRain
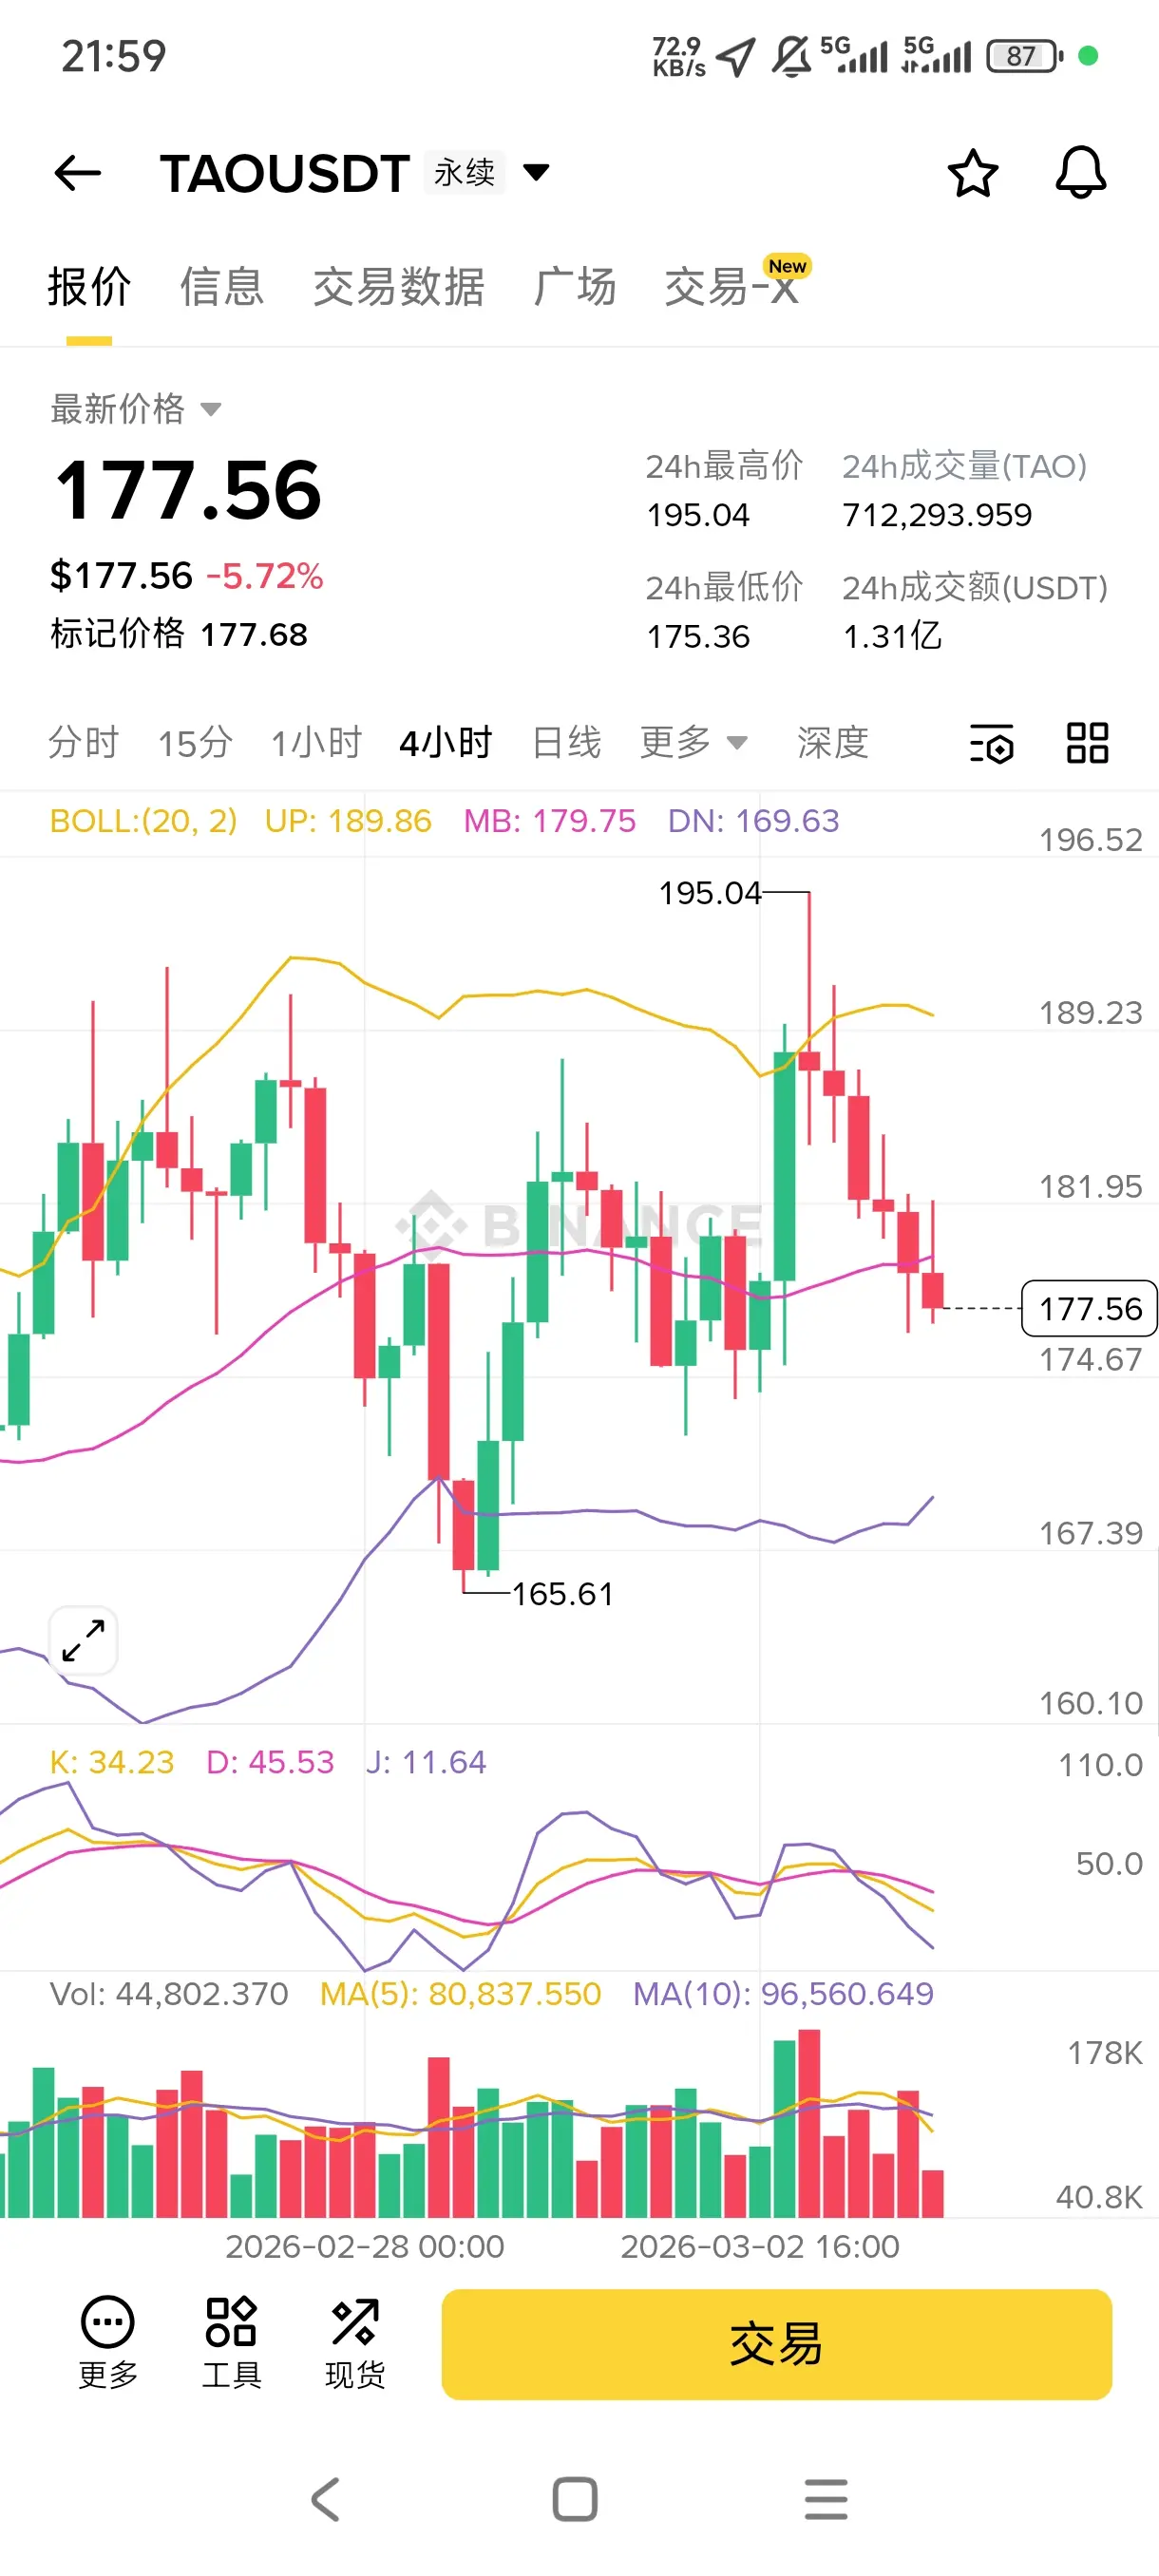
$TAO Empty Empty Empty 📉
TAO has been beaten down by the market, mainly because the overall sentiment in the crypto space is weak, and everyone is fleeing. It’s also plunging along with the market.
Technical analysis on the 4-hour chart: Bollinger Bands are opening downward, KDJ shows a death cross downward, indicating a bearish trend.
First target: 172.23
Second target: 159.80
Stop loss: 191.76
$btc $ETH
View OriginalTAO has been beaten down by the market, mainly because the overall sentiment in the crypto space is weak, and everyone is fleeing. It’s also plunging along with the market.
Technical analysis on the 4-hour chart: Bollinger Bands are opening downward, KDJ shows a death cross downward, indicating a bearish trend.
First target: 172.23
Second target: 159.80
Stop loss: 191.76
$btc $ETH
[The user has shared his/her trading data. Go to the App to view more.]
- Reward
- 2
- Comment
- Repost
- Share
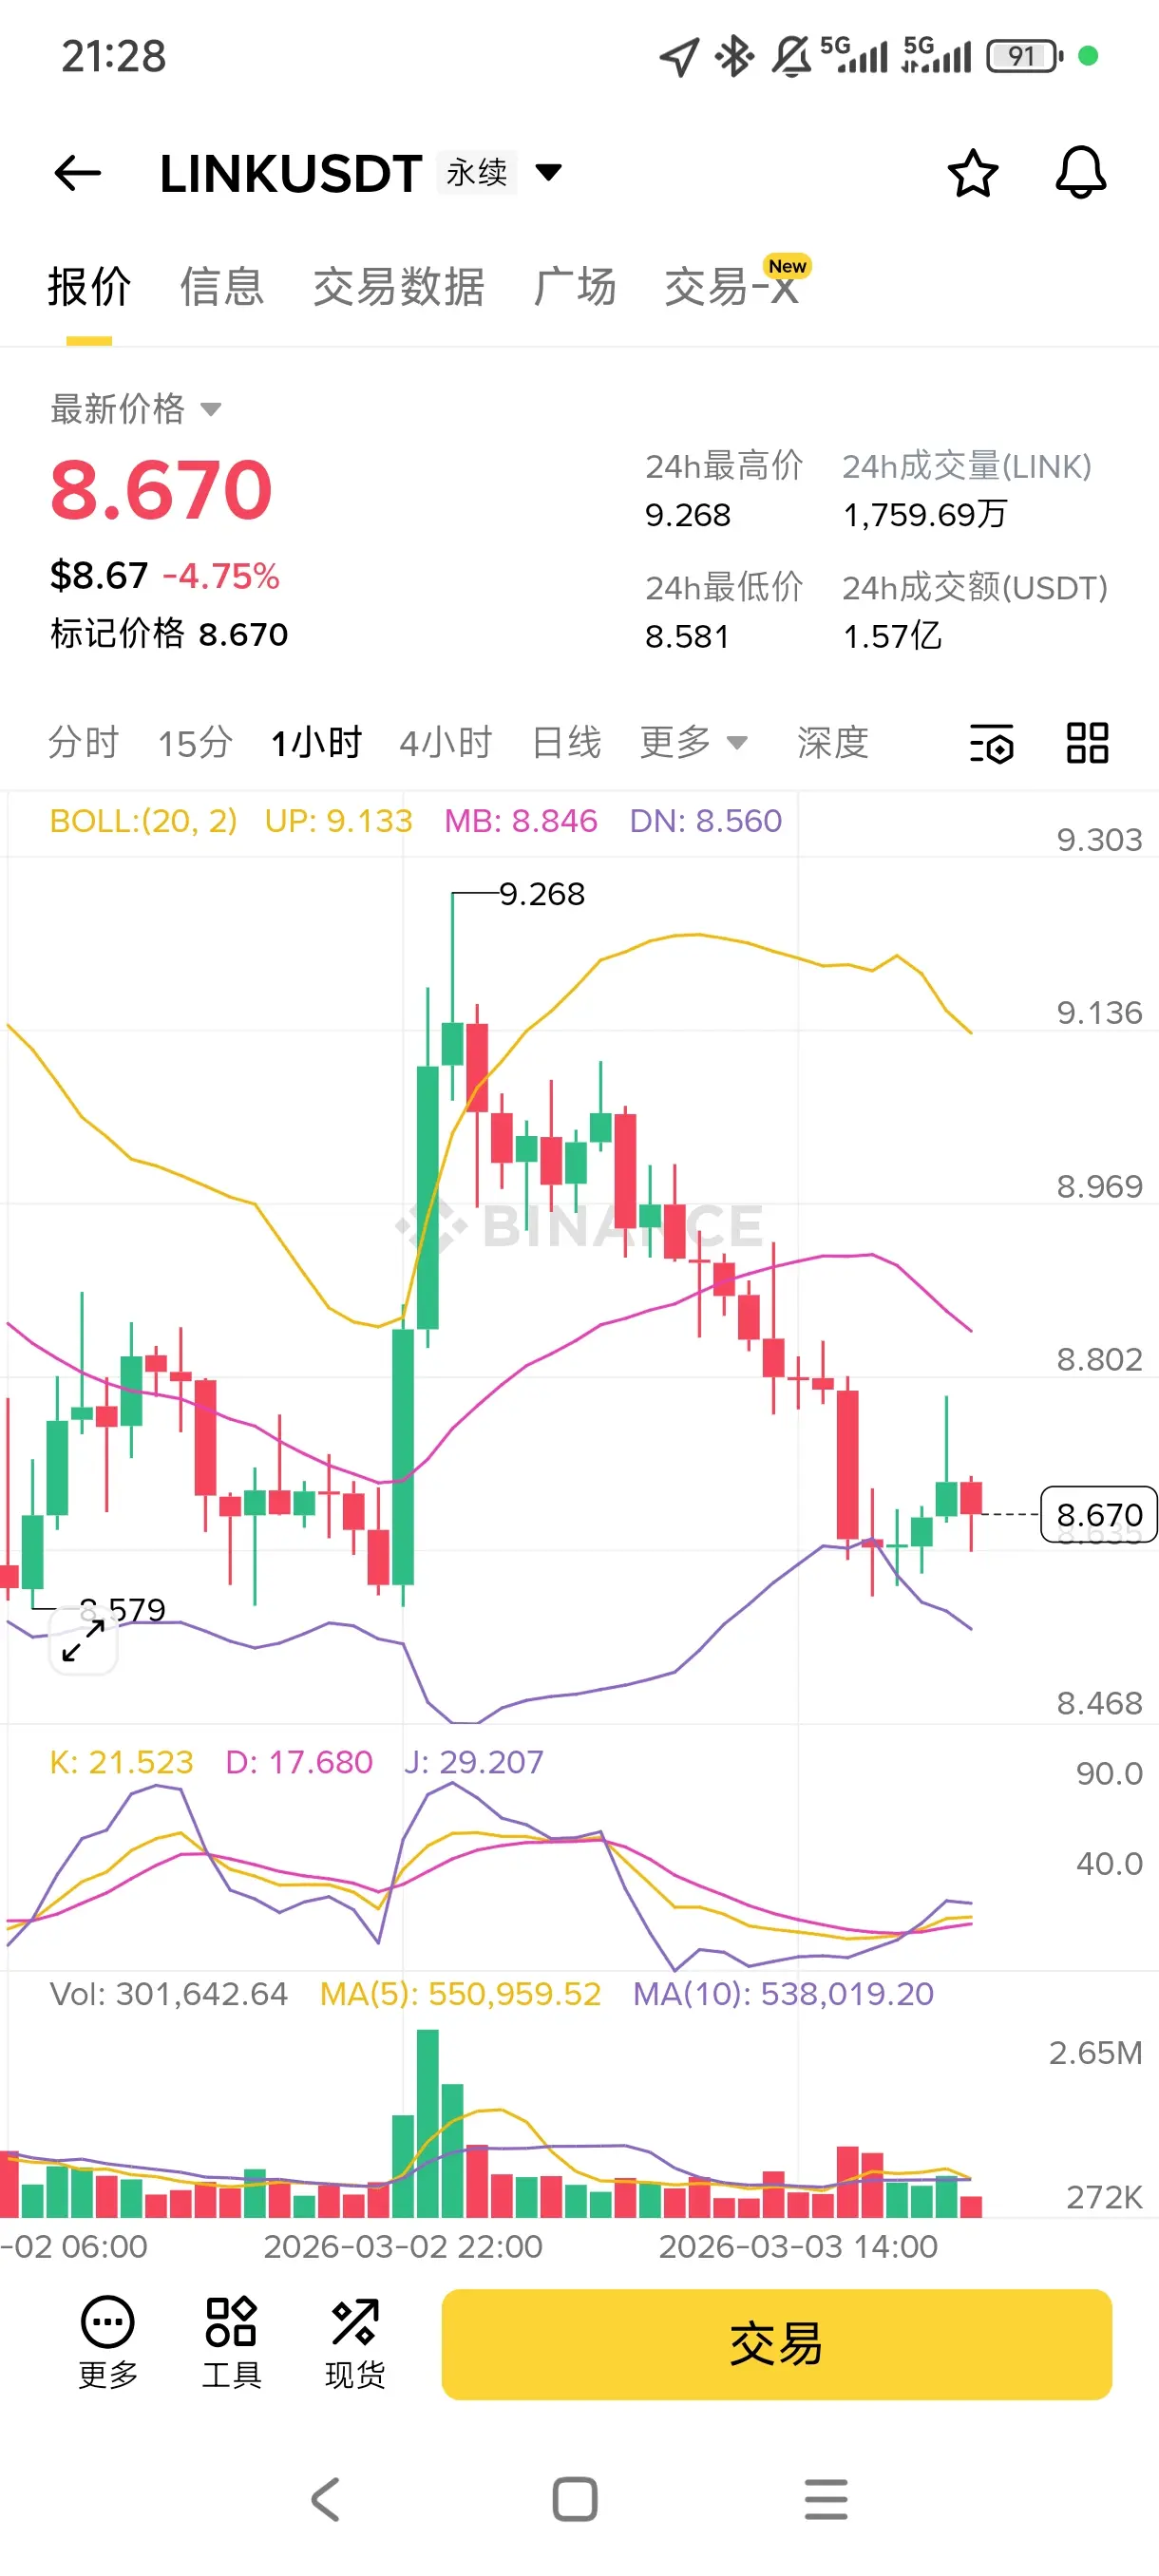
$LINK Empty Empty Empty 📉
LINK has recently been hammered down by the market, mainly due to the overall bearish sentiment in the crypto market, with everyone rushing to exit. It has also plummeted accordingly.
Technical analysis on the 1-hour chart: Bollinger Bands are opening downward, KDJ is hovering at low levels, indicating a bearish dominance.
First target: 8.41
Second target: 8.24
Stop loss: 9.36
$btc $ETH
View OriginalLINK has recently been hammered down by the market, mainly due to the overall bearish sentiment in the crypto market, with everyone rushing to exit. It has also plummeted accordingly.
Technical analysis on the 1-hour chart: Bollinger Bands are opening downward, KDJ is hovering at low levels, indicating a bearish dominance.
First target: 8.41
Second target: 8.24
Stop loss: 9.36
$btc $ETH
[The user has shared his/her trading data. Go to the App to view more.]
- Reward
- like
- Comment
- Repost
- Share
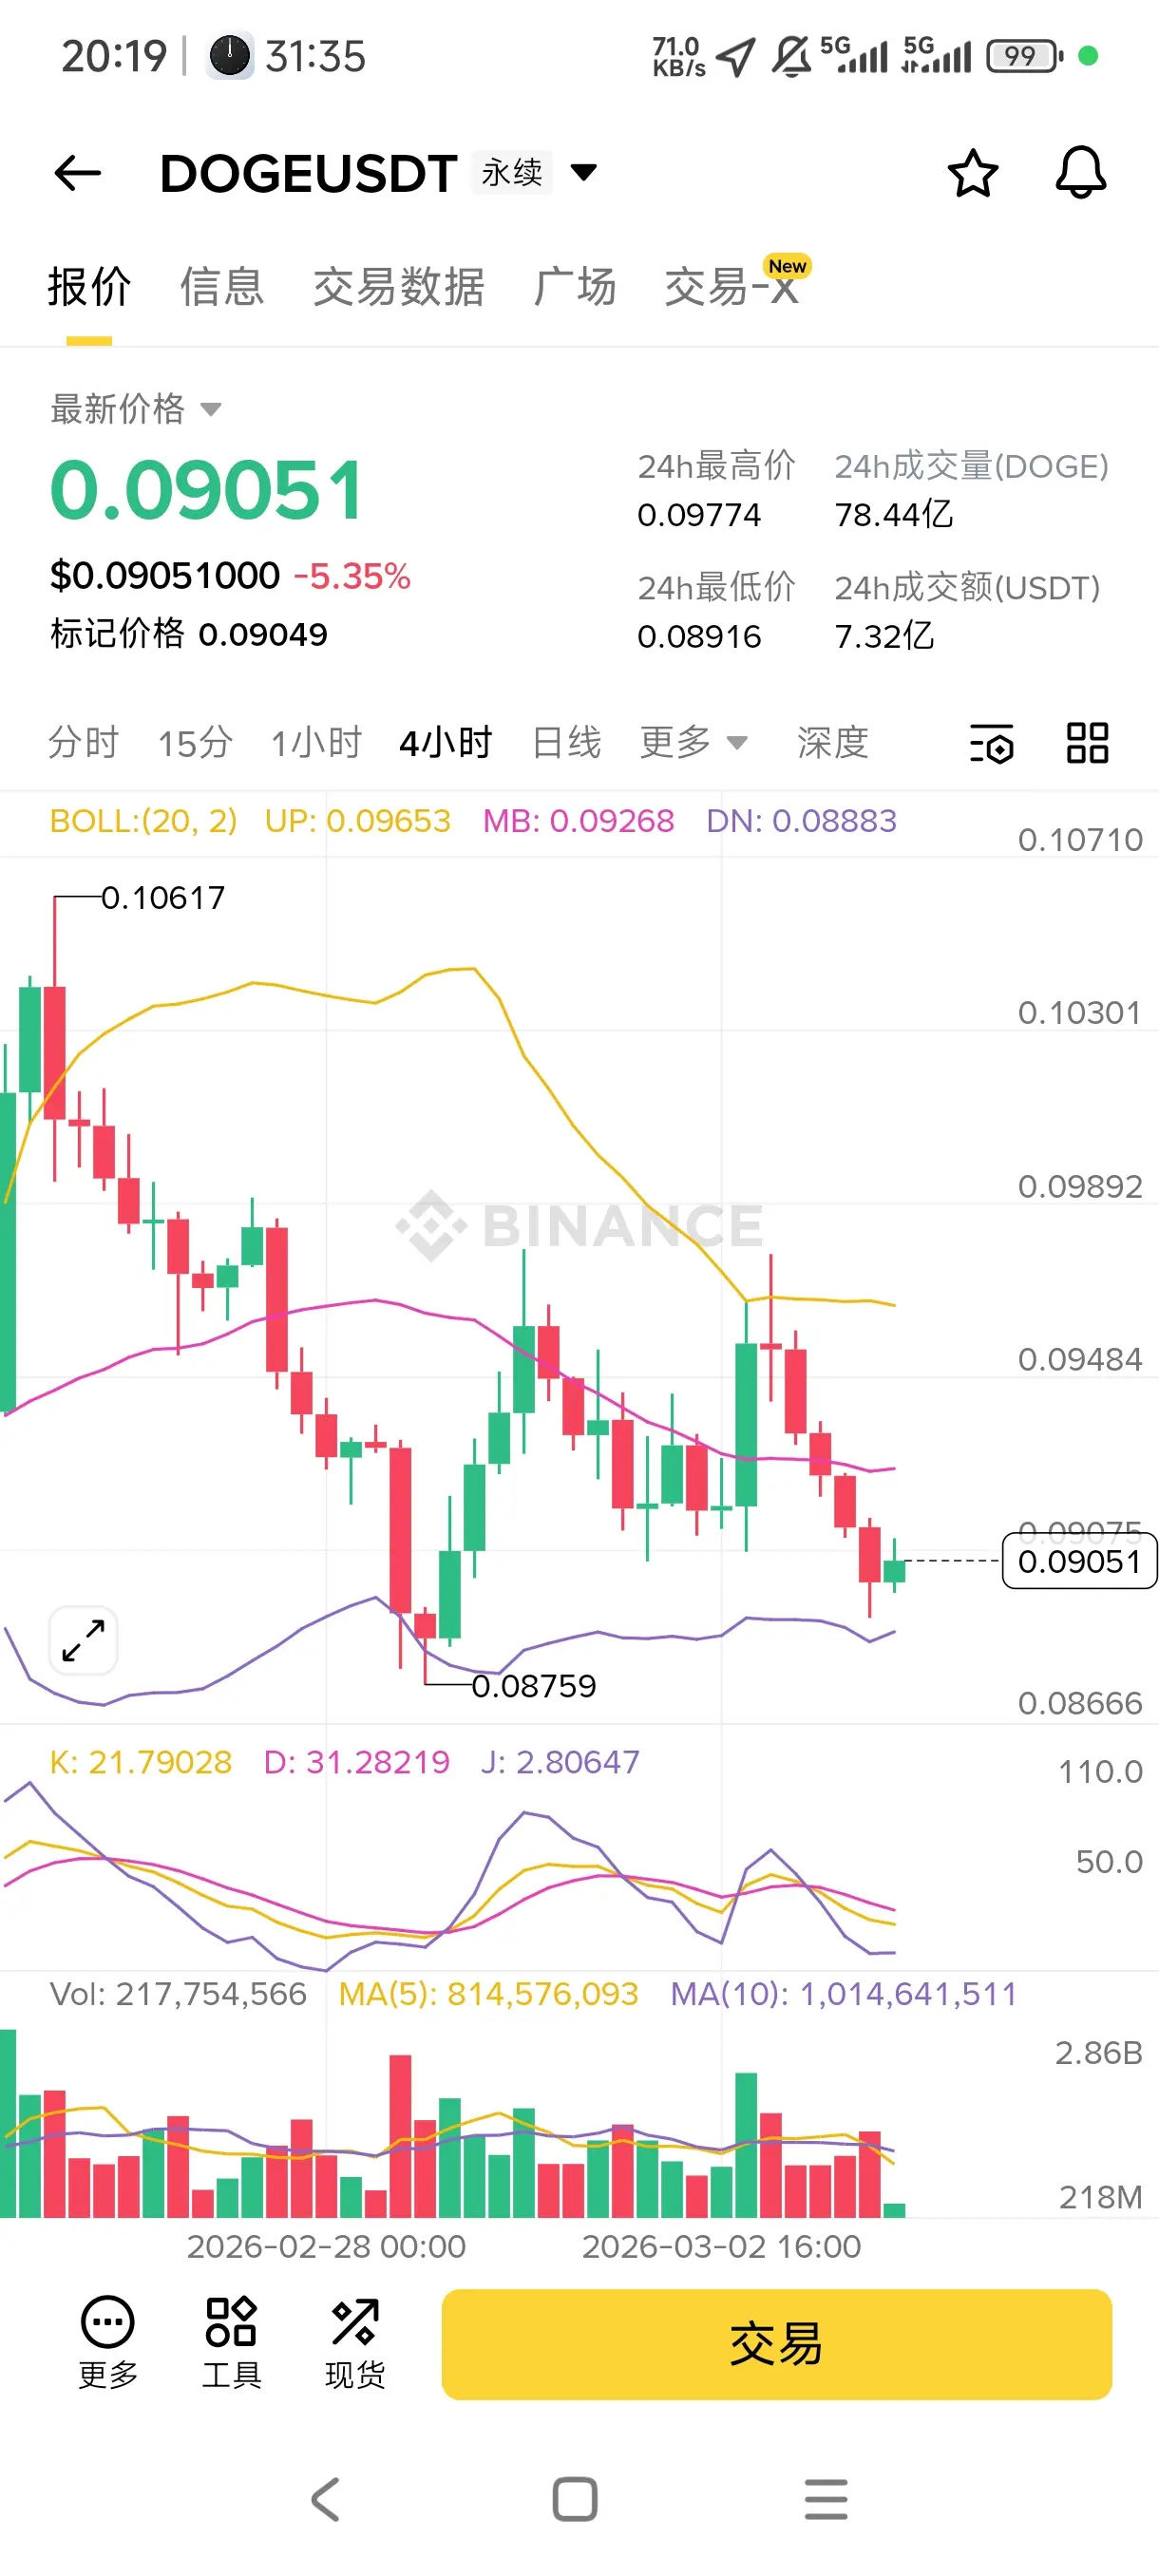
Empty empty empty 📉 Dogecoin 4-hour timeframe shows strong bearish momentum, breaking below the middle Bollinger Band and continuing to decline. The KDJ indicator's three lines are hovering at low levels, making short-term rebounds unlikely. It’s safer to follow the trend and go short.
After Trump’s comments on reserves turned out to be a false positive, the market sentiment quickly shifted to collective selling, dragging Dogecoin down with it.
Technical analysis on the 4-hour chart: The Bollinger Bands are opening downward, and the J value of the KDJ indicator has bottomed out, indicating a
View OriginalAfter Trump’s comments on reserves turned out to be a false positive, the market sentiment quickly shifted to collective selling, dragging Dogecoin down with it.
Technical analysis on the 4-hour chart: The Bollinger Bands are opening downward, and the J value of the KDJ indicator has bottomed out, indicating a
[The user has shared his/her trading data. Go to the App to view more.]
- Reward
- like
- Comment
- Repost
- Share
Boom! If the Strait of Hormuz is blocked, will oil prices directly break $100?😱
The prediction from the German bank is too intense. If the Strait of Hormuz is blocked and oil supply is cut by 20%, oil prices will skyrocket past $100. If that happens, wallets will be drained dry!$BTC $ETH $SOL
View OriginalThe prediction from the German bank is too intense. If the Strait of Hormuz is blocked and oil supply is cut by 20%, oil prices will skyrocket past $100. If that happens, wallets will be drained dry!$BTC $ETH $SOL

[The user has shared his/her trading data. Go to the App to view more.]
- Reward
- like
- Comment
- Repost
- Share
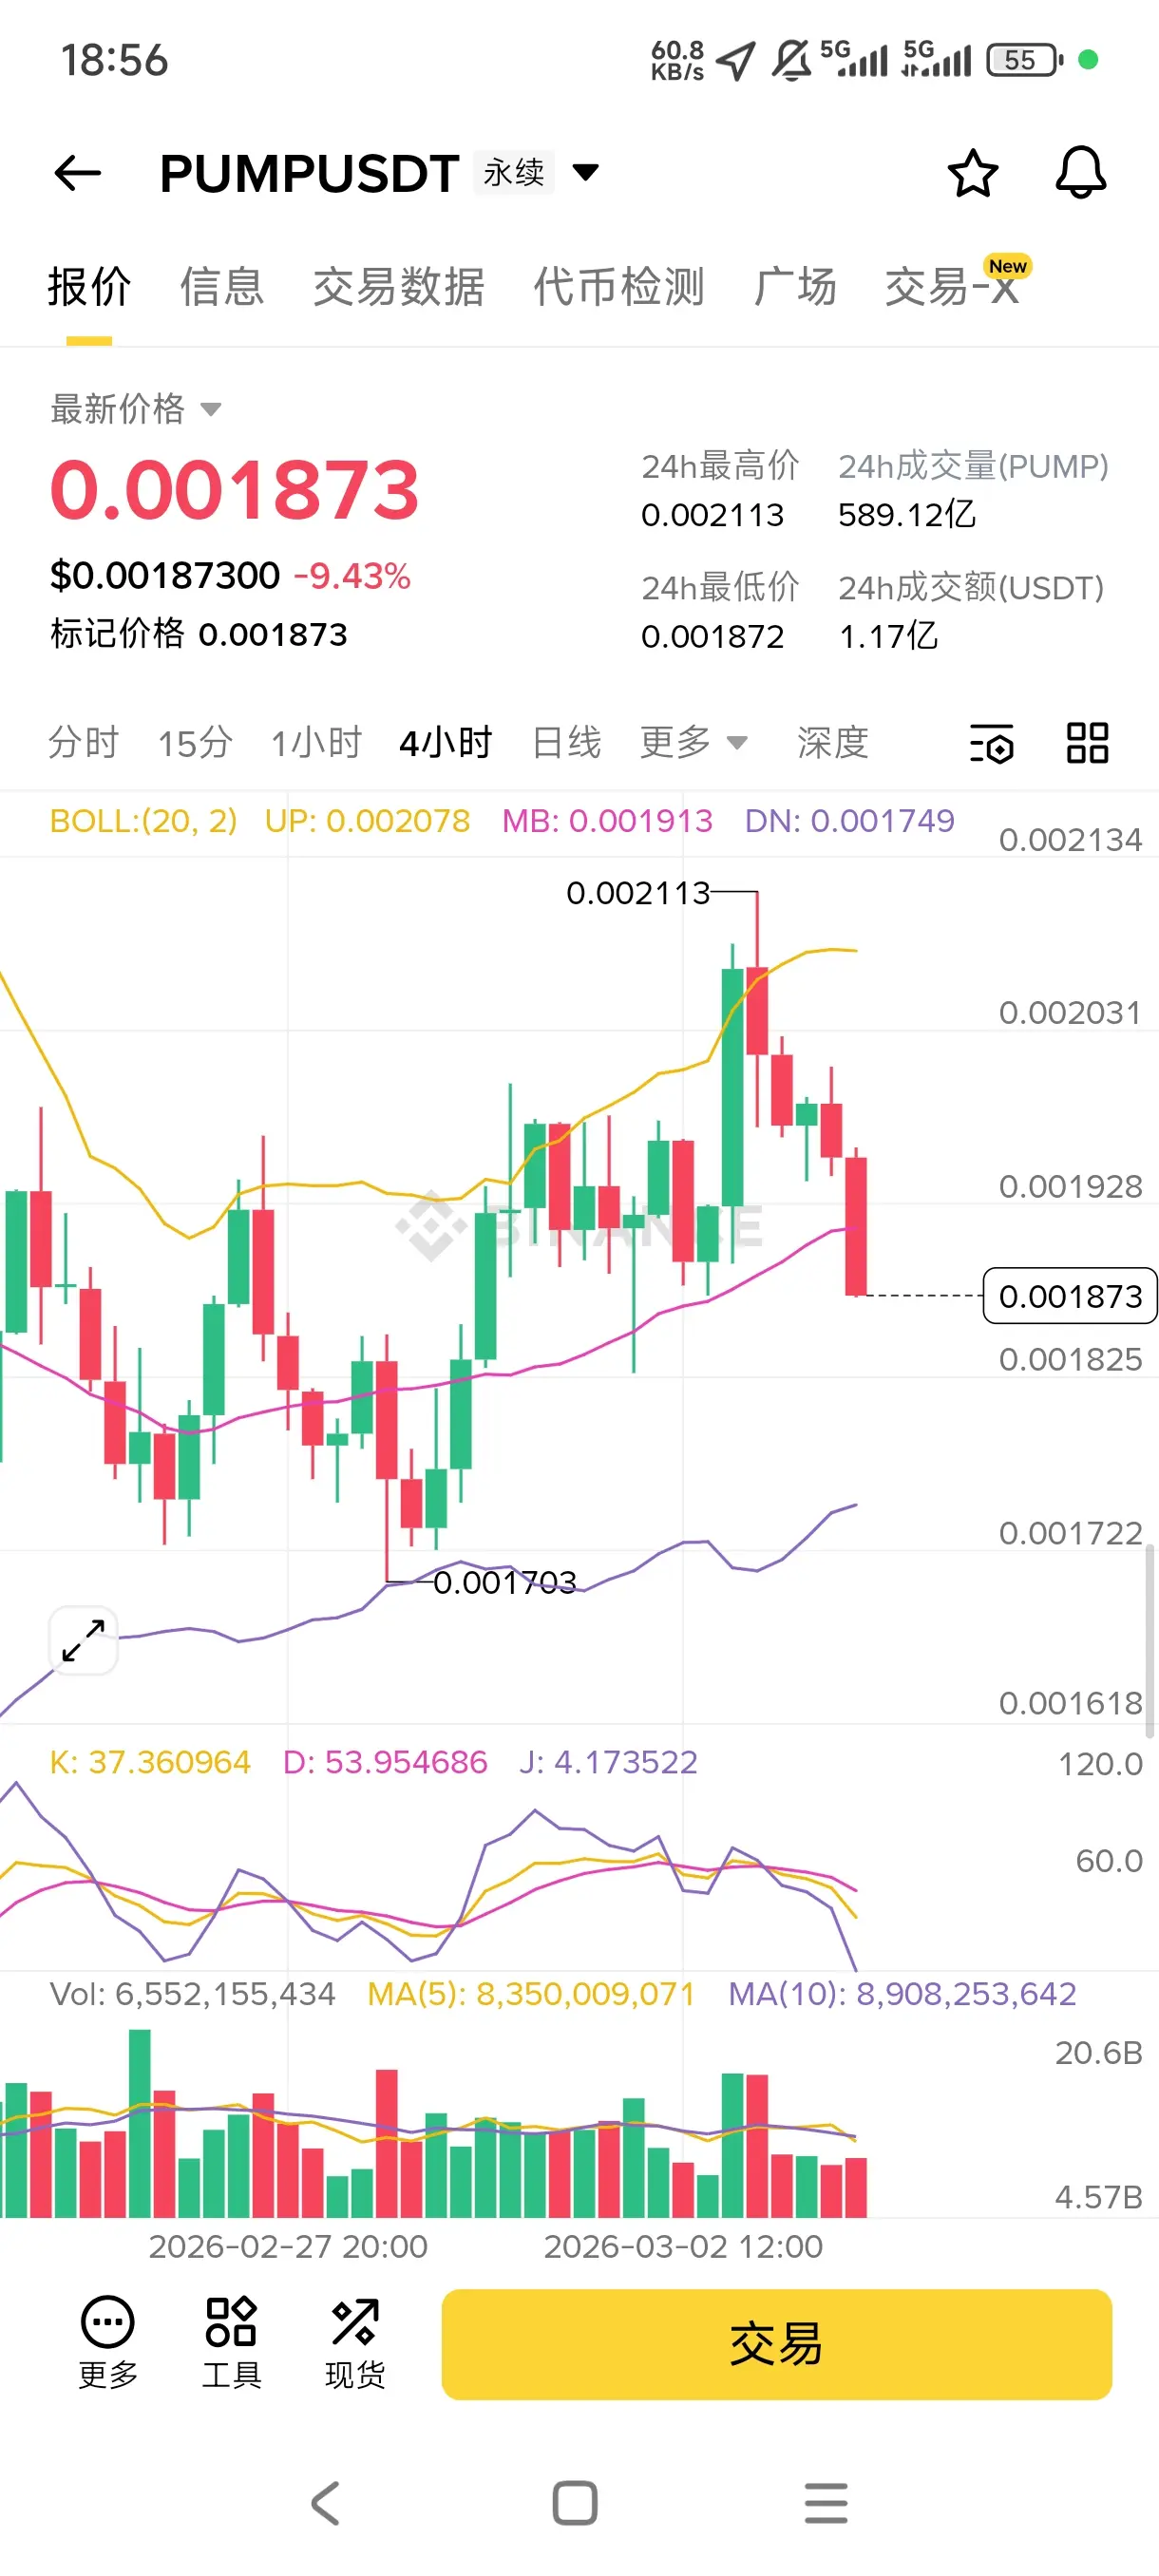
$PUMP Empty Empty Empty📉
PumpFun's associated address has cashed out a crazy $7.23 million, and this wave of dumping has directly stunned PUMP, with retail investors rushing to exit.
On the technical side, the 4-hour chart shows the price breaking below the middle band of the Bollinger Bands, with KDJ forming a death cross downward, indicating a clear bearish trend.
First target: 0.00180
Second target: 0.00168
Stop loss: 0.00202
$btc $ETH
View OriginalPumpFun's associated address has cashed out a crazy $7.23 million, and this wave of dumping has directly stunned PUMP, with retail investors rushing to exit.
On the technical side, the 4-hour chart shows the price breaking below the middle band of the Bollinger Bands, with KDJ forming a death cross downward, indicating a clear bearish trend.
First target: 0.00180
Second target: 0.00168
Stop loss: 0.00202
$btc $ETH
[The user has shared his/her trading data. Go to the App to view more.]
- Reward
- like
- Comment
- Repost
- Share
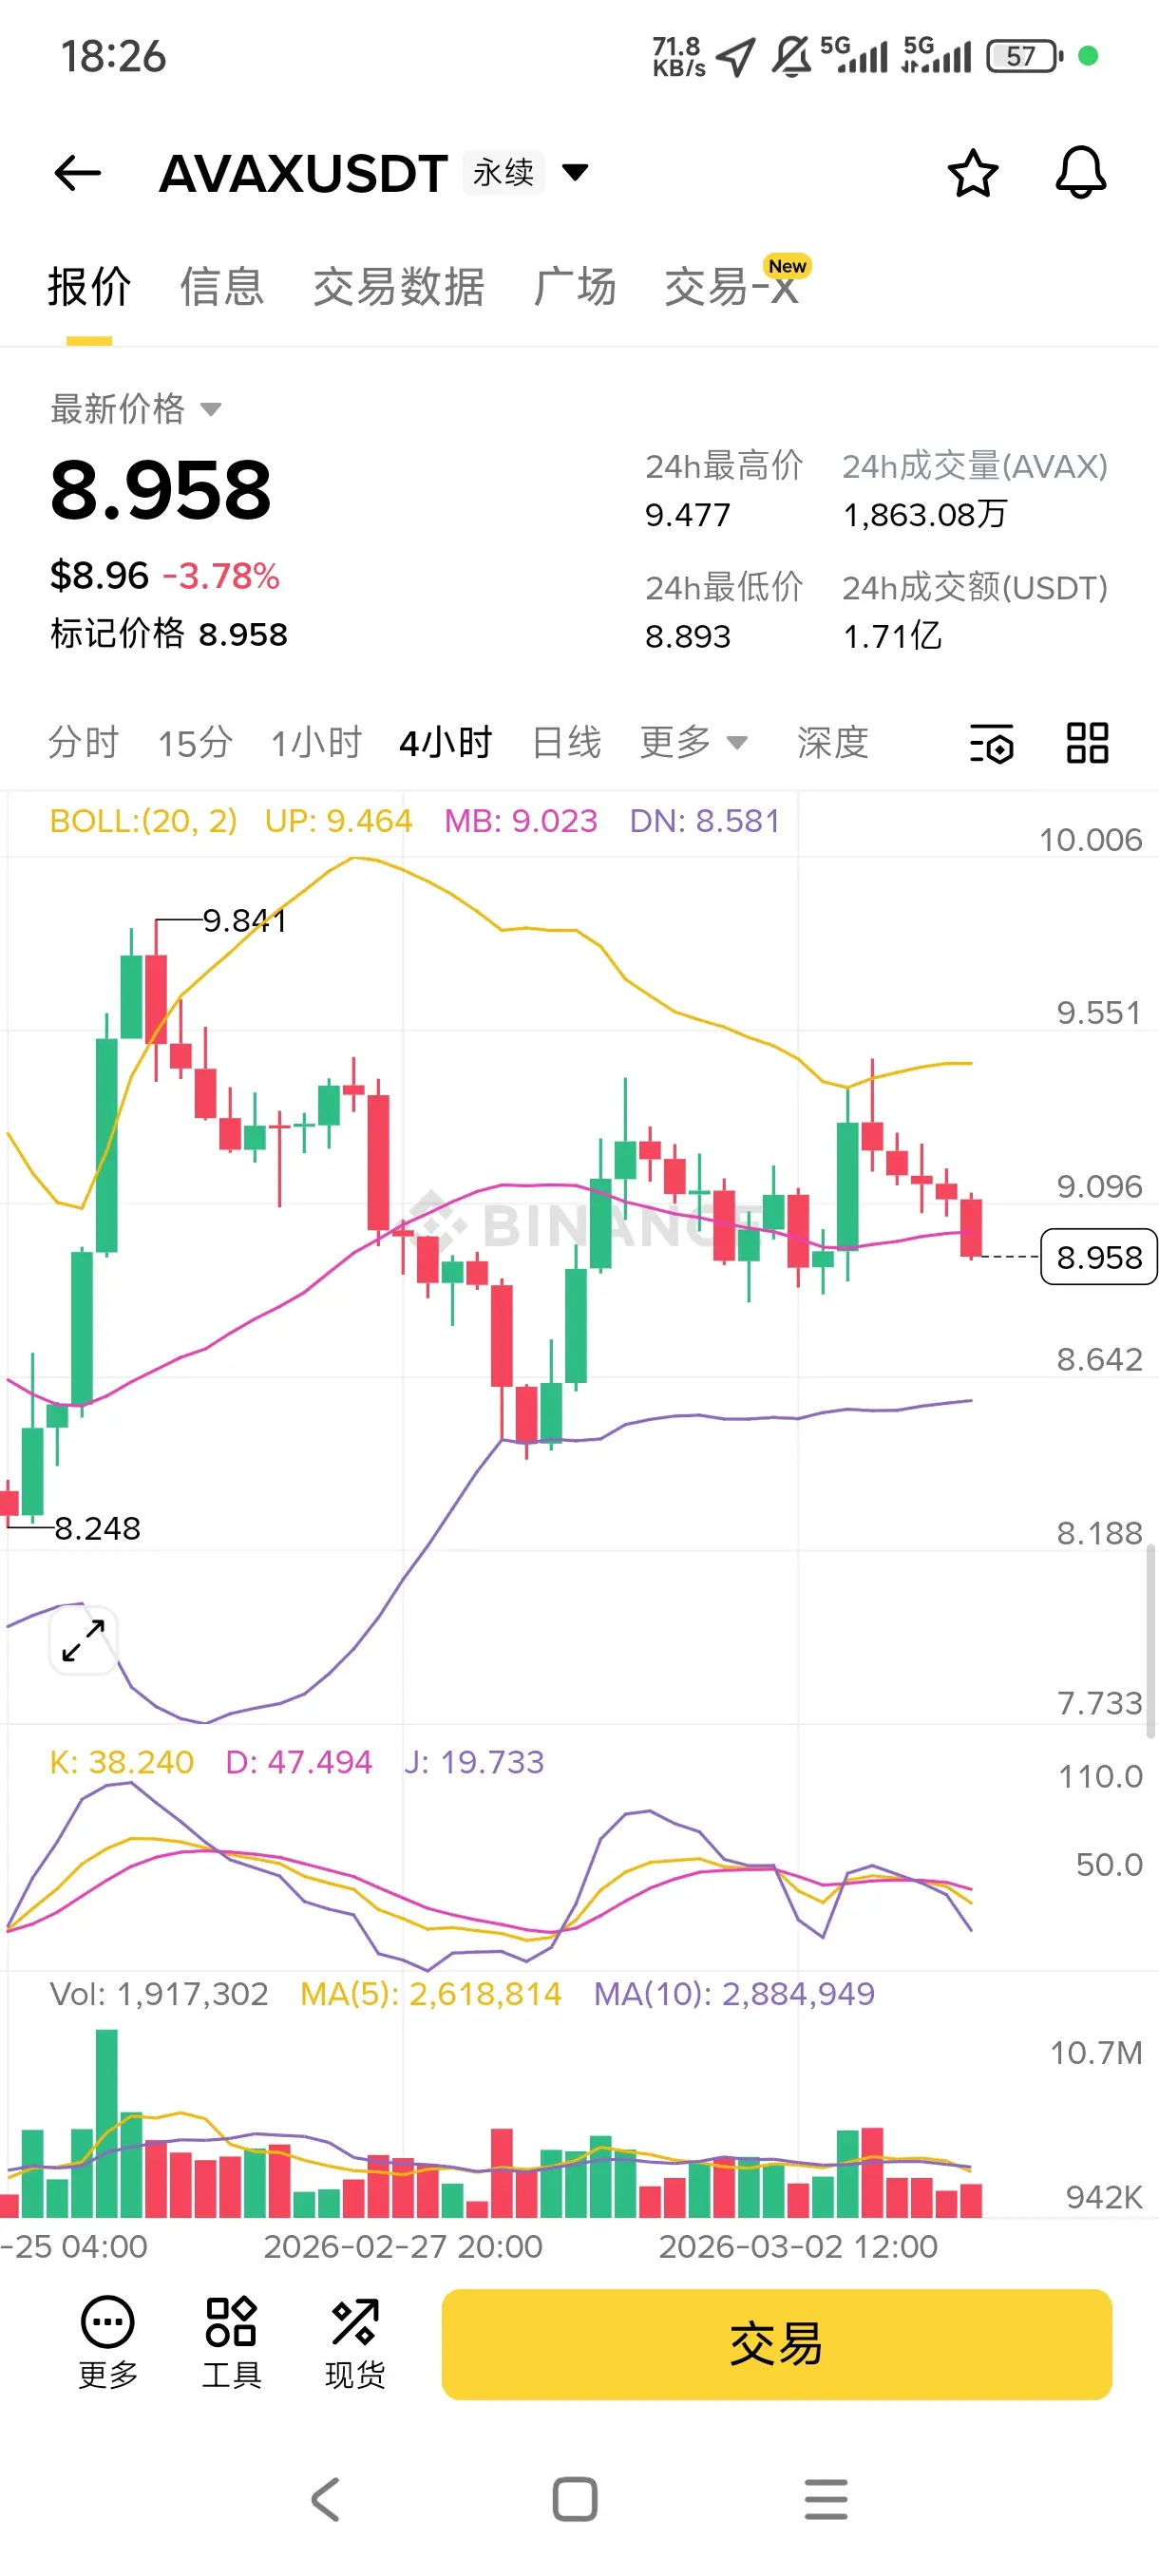
$AVAX Empty Empty Empty📉
Things are heating up again in the Middle East, with the US-Iran conflict escalating. Global risk aversion is at its peak, the crypto market is collectively plunging, and AVAX is also caught in the crossfire, with selling pressure overwhelming it.
On the 4-hour technical chart, the Bollinger Bands are opening downward, the KDJ indicator shows a death cross heading down, indicating a clear bearish trend.
First target: 8.60
Second target: 7.88
Stop loss: 9.67
$btc $ETH
View OriginalThings are heating up again in the Middle East, with the US-Iran conflict escalating. Global risk aversion is at its peak, the crypto market is collectively plunging, and AVAX is also caught in the crossfire, with selling pressure overwhelming it.
On the 4-hour technical chart, the Bollinger Bands are opening downward, the KDJ indicator shows a death cross heading down, indicating a clear bearish trend.
First target: 8.60
Second target: 7.88
Stop loss: 9.67
$btc $ETH
[The user has shared his/her trading data. Go to the App to view more.]
- Reward
- like
- Comment
- Repost
- Share
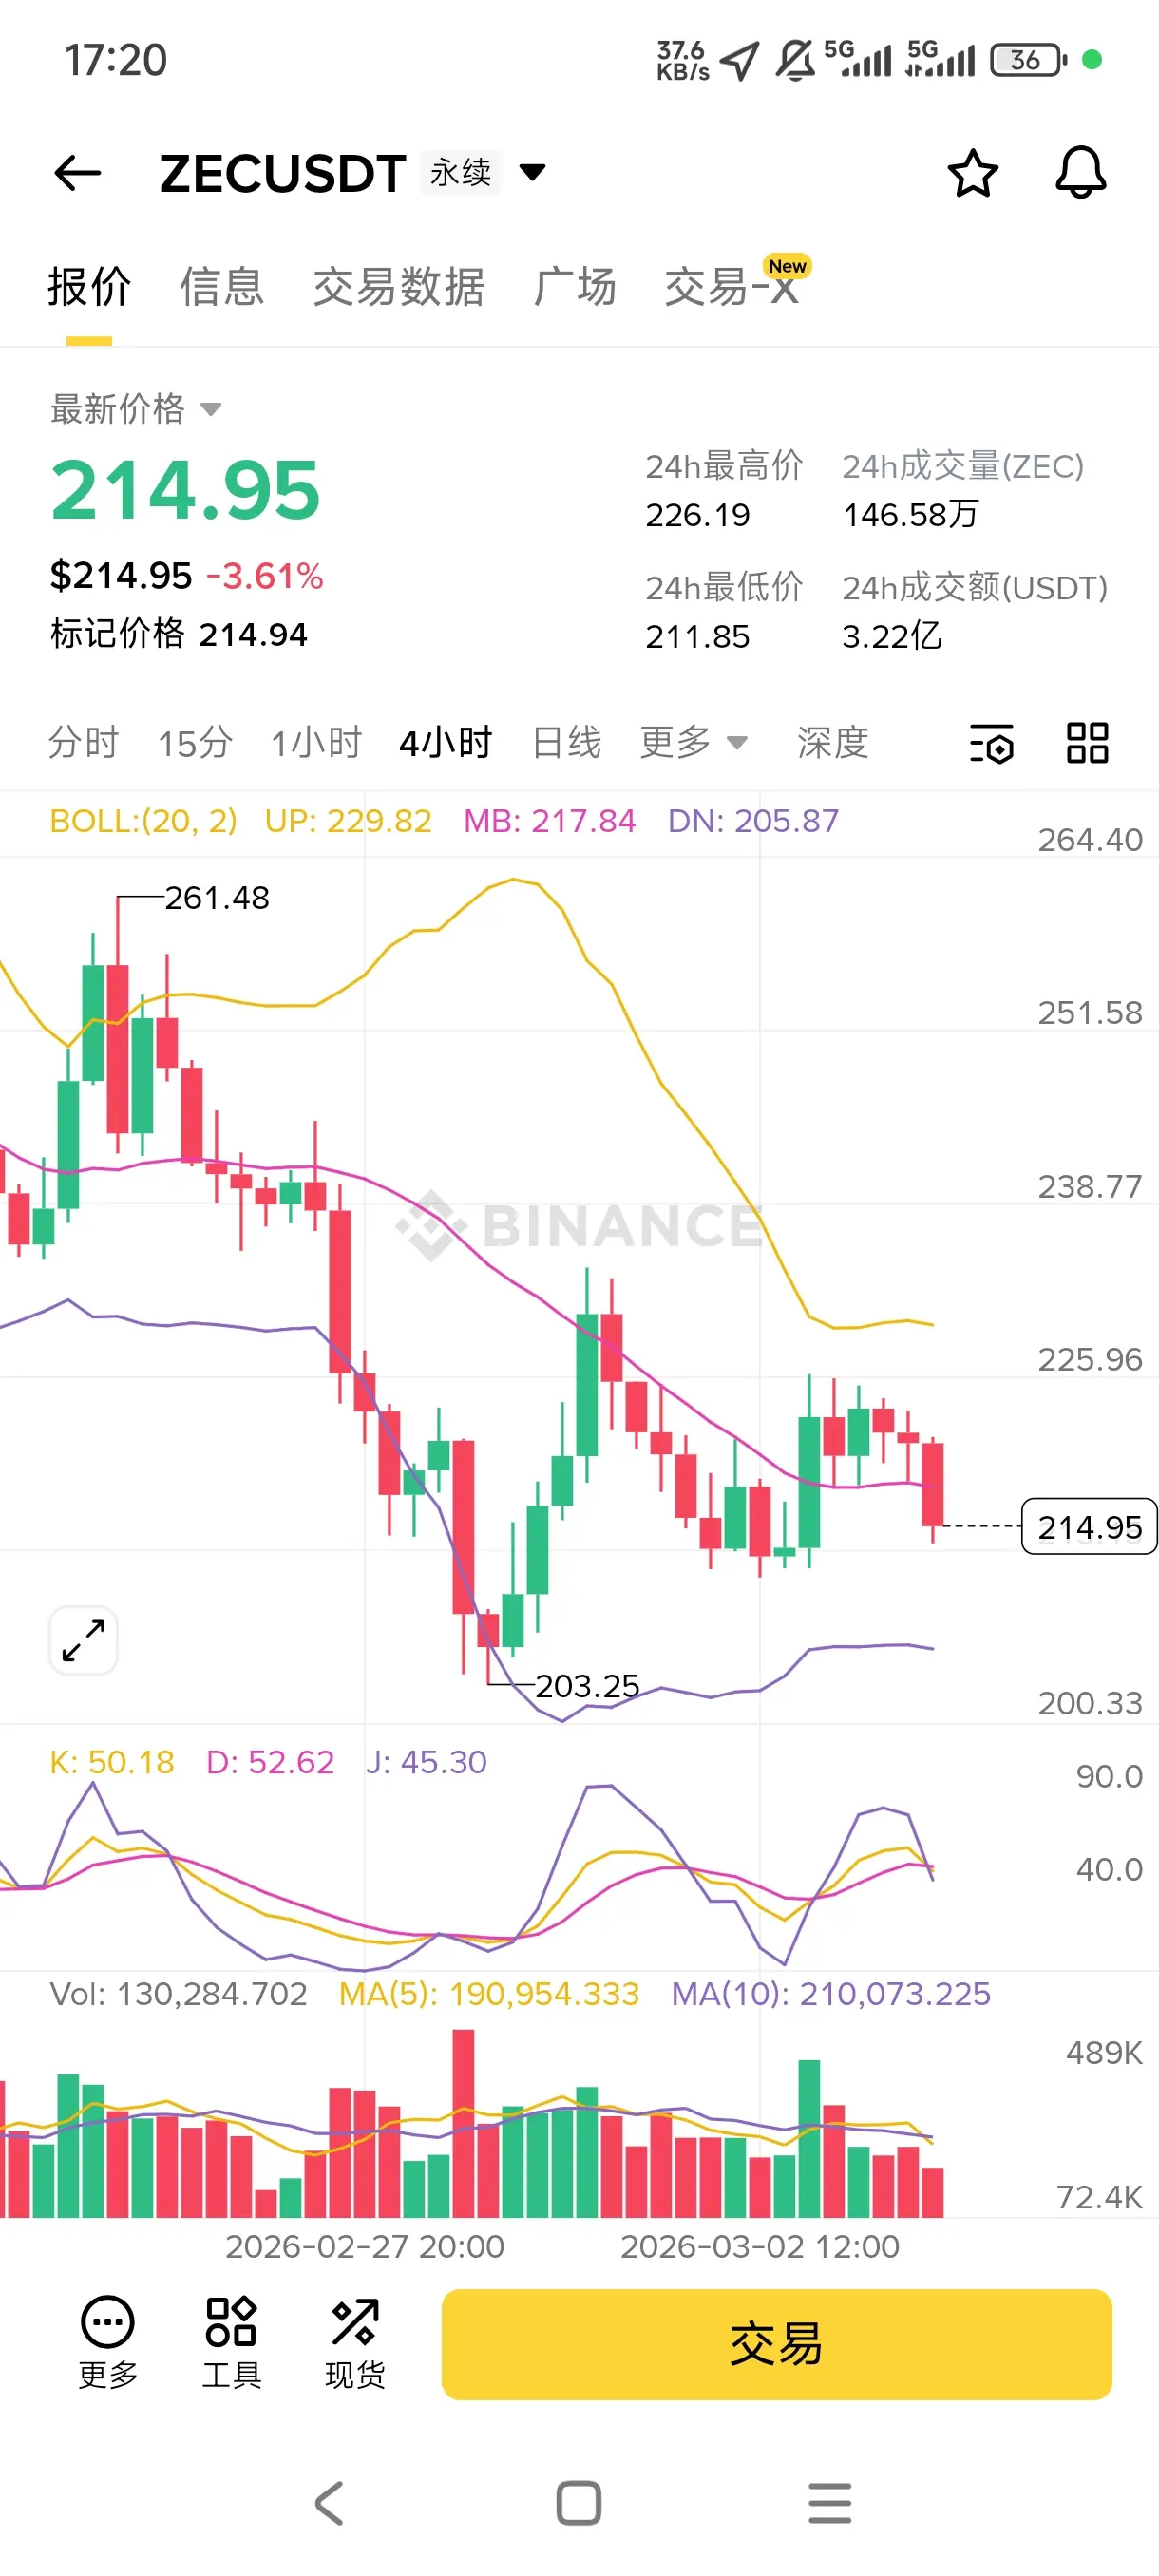
$ZEC Empty Empty Empty📉
The situation is heating up again on the US and Iran sides, global risk aversion is at its peak, the crypto market is collectively plunging, and ZEC is also caught in the crossfire, with selling pressure overwhelming.
On the technical side, the 4-hour chart shows Bollinger Bands opening downward, KDJ forming a death cross downward, indicating a clear bearish trend.
First target: 208.51
Second target: 182.71
Stop loss: 232.15
$btc $ETH
View OriginalThe situation is heating up again on the US and Iran sides, global risk aversion is at its peak, the crypto market is collectively plunging, and ZEC is also caught in the crossfire, with selling pressure overwhelming.
On the technical side, the 4-hour chart shows Bollinger Bands opening downward, KDJ forming a death cross downward, indicating a clear bearish trend.
First target: 208.51
Second target: 182.71
Stop loss: 232.15
$btc $ETH
[The user has shared his/her trading data. Go to the App to view more.]
- Reward
- like
- Comment
- Repost
- Share

- Reward
- like
- Comment
- Repost
- Share
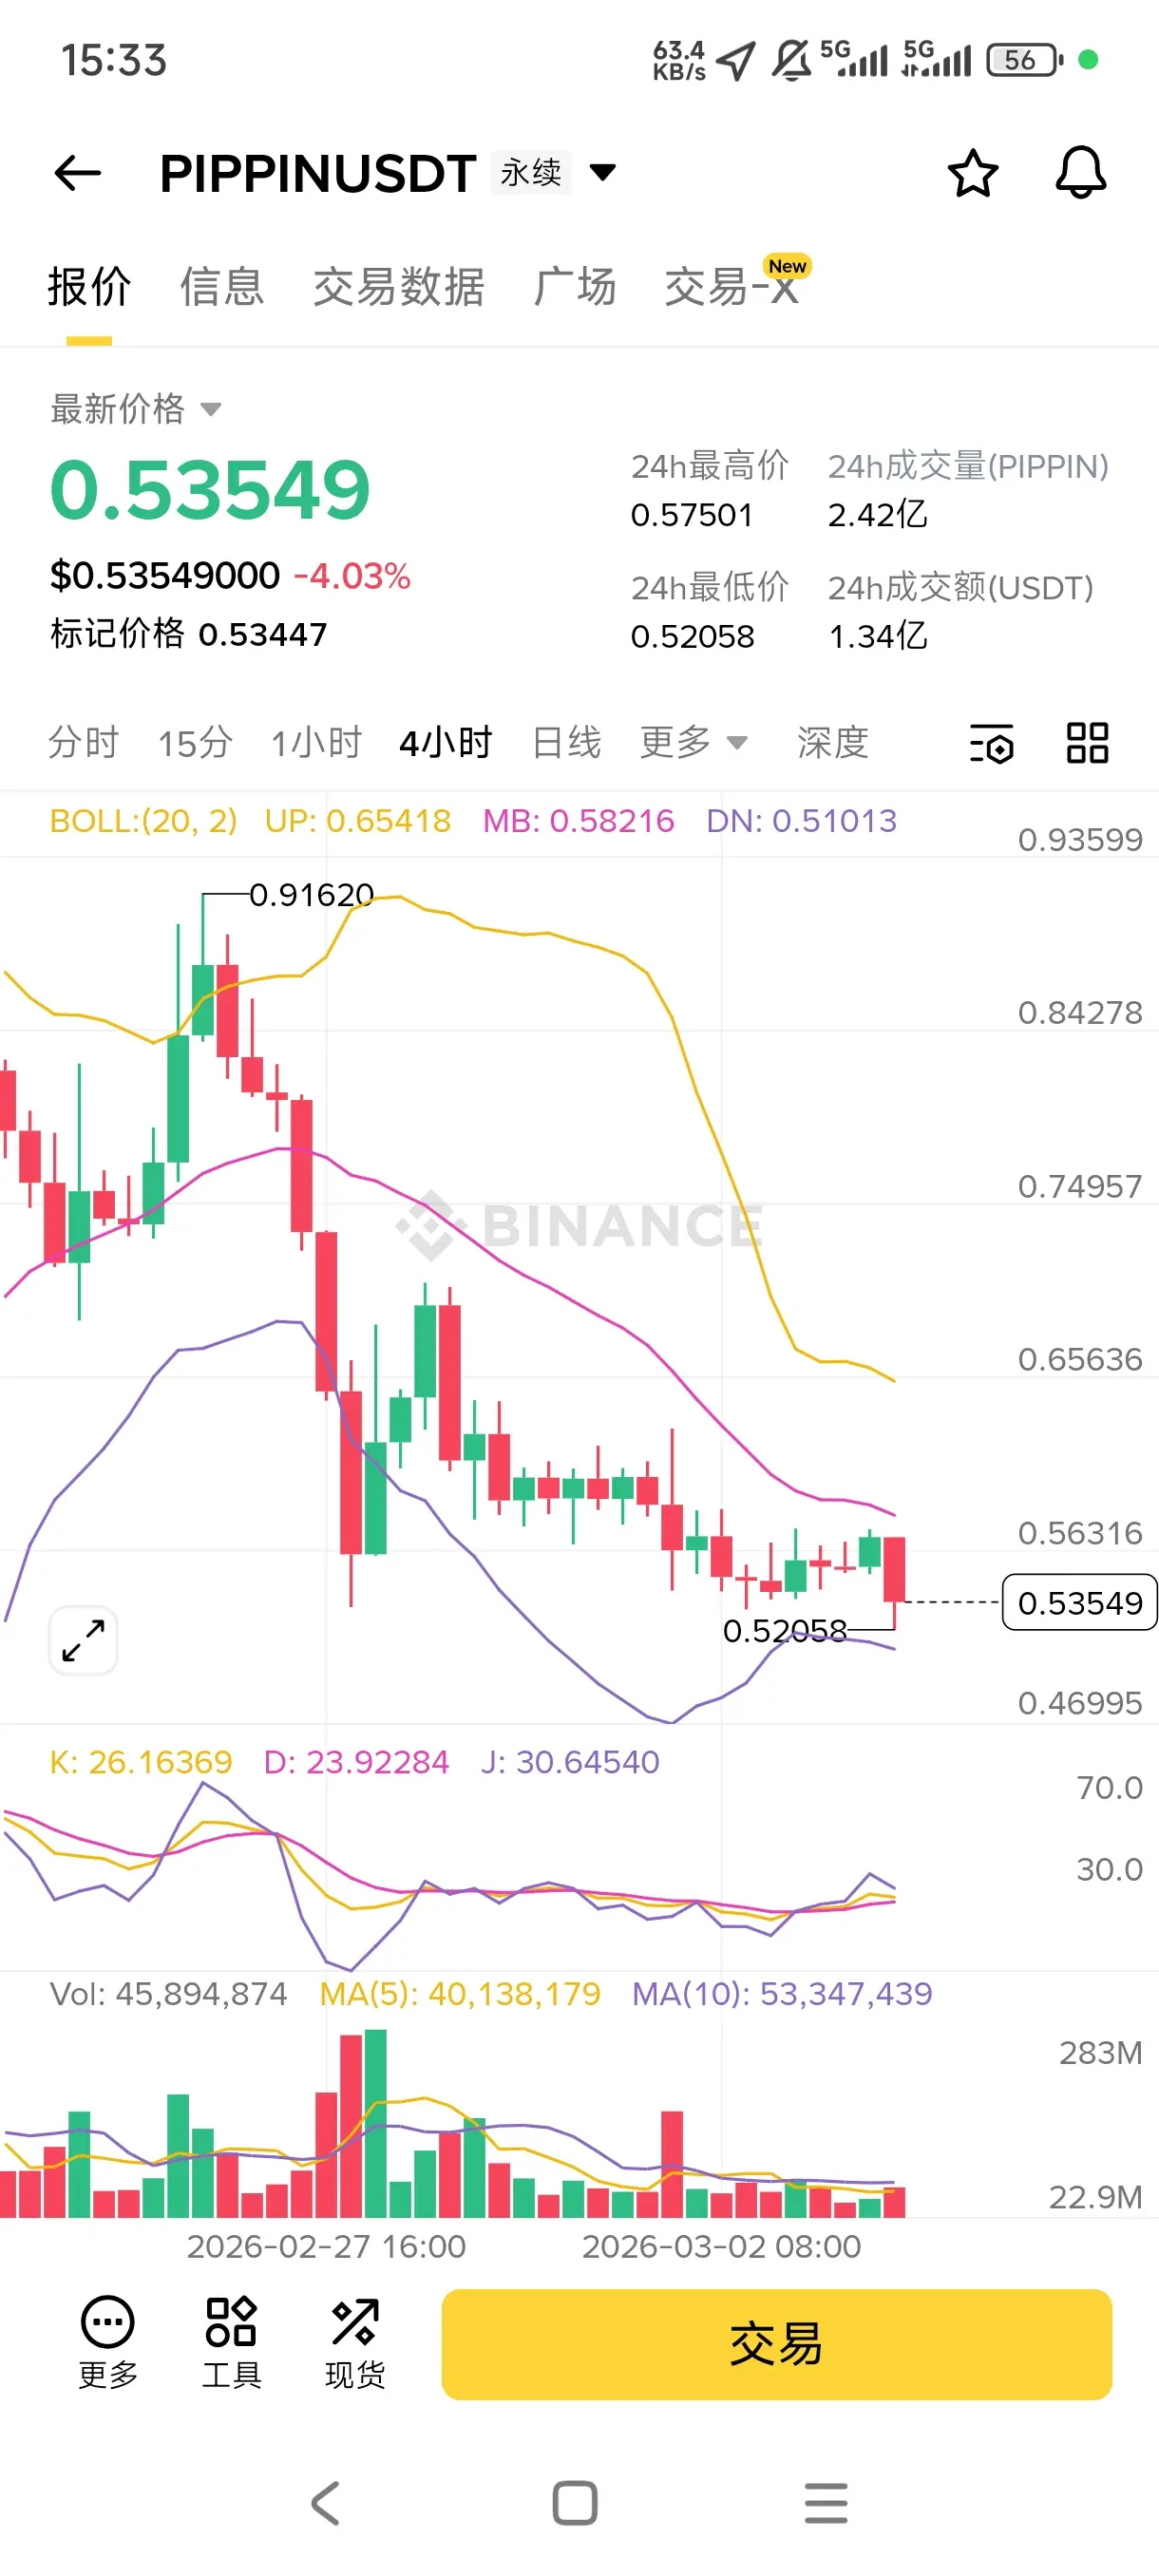
$PIPPIN Empty Empty Empty 📉
PIPPIN is controlled by insiders for 80%. Now smart money is leading a run, and funds are all rushing into BTC and ETH. This drop is well-deserved.
On the technical side, the 4-hour chart shows the price breaking below the middle Bollinger Band, with the KDJ indicator showing a death cross downward, indicating a clear bearish trend.
First target: 0.5147
Second target: 0.4822
Stop loss: 0.5783
$btc $ETH
View OriginalPIPPIN is controlled by insiders for 80%. Now smart money is leading a run, and funds are all rushing into BTC and ETH. This drop is well-deserved.
On the technical side, the 4-hour chart shows the price breaking below the middle Bollinger Band, with the KDJ indicator showing a death cross downward, indicating a clear bearish trend.
First target: 0.5147
Second target: 0.4822
Stop loss: 0.5783
$btc $ETH
[The user has shared his/her trading data. Go to the App to view more.]
- Reward
- like
- Comment
- Repost
- Share
$SAHARA Dodo Dodo Dodo 🚀
Sahara has just launched the Sorin AI Trading Assistant and is also collaborating with Korea's Danal. Funds are flowing in directly to push the price up. This wave truly is driven by the AI concept and has heated up again.
On the technical side, the 4-hour chart shows Bollinger Bands opening upward, KDJ golden cross diverging, indicating a clear bullish trend.
First target: 0.0296
Second target: 0.0327
Stop loss: 0.0261
$btc $ETH
View OriginalSahara has just launched the Sorin AI Trading Assistant and is also collaborating with Korea's Danal. Funds are flowing in directly to push the price up. This wave truly is driven by the AI concept and has heated up again.
On the technical side, the 4-hour chart shows Bollinger Bands opening upward, KDJ golden cross diverging, indicating a clear bullish trend.
First target: 0.0296
Second target: 0.0327
Stop loss: 0.0261
$btc $ETH
[The user has shared his/her trading data. Go to the App to view more.]
- Reward
- like
- Comment
- Repost
- Share
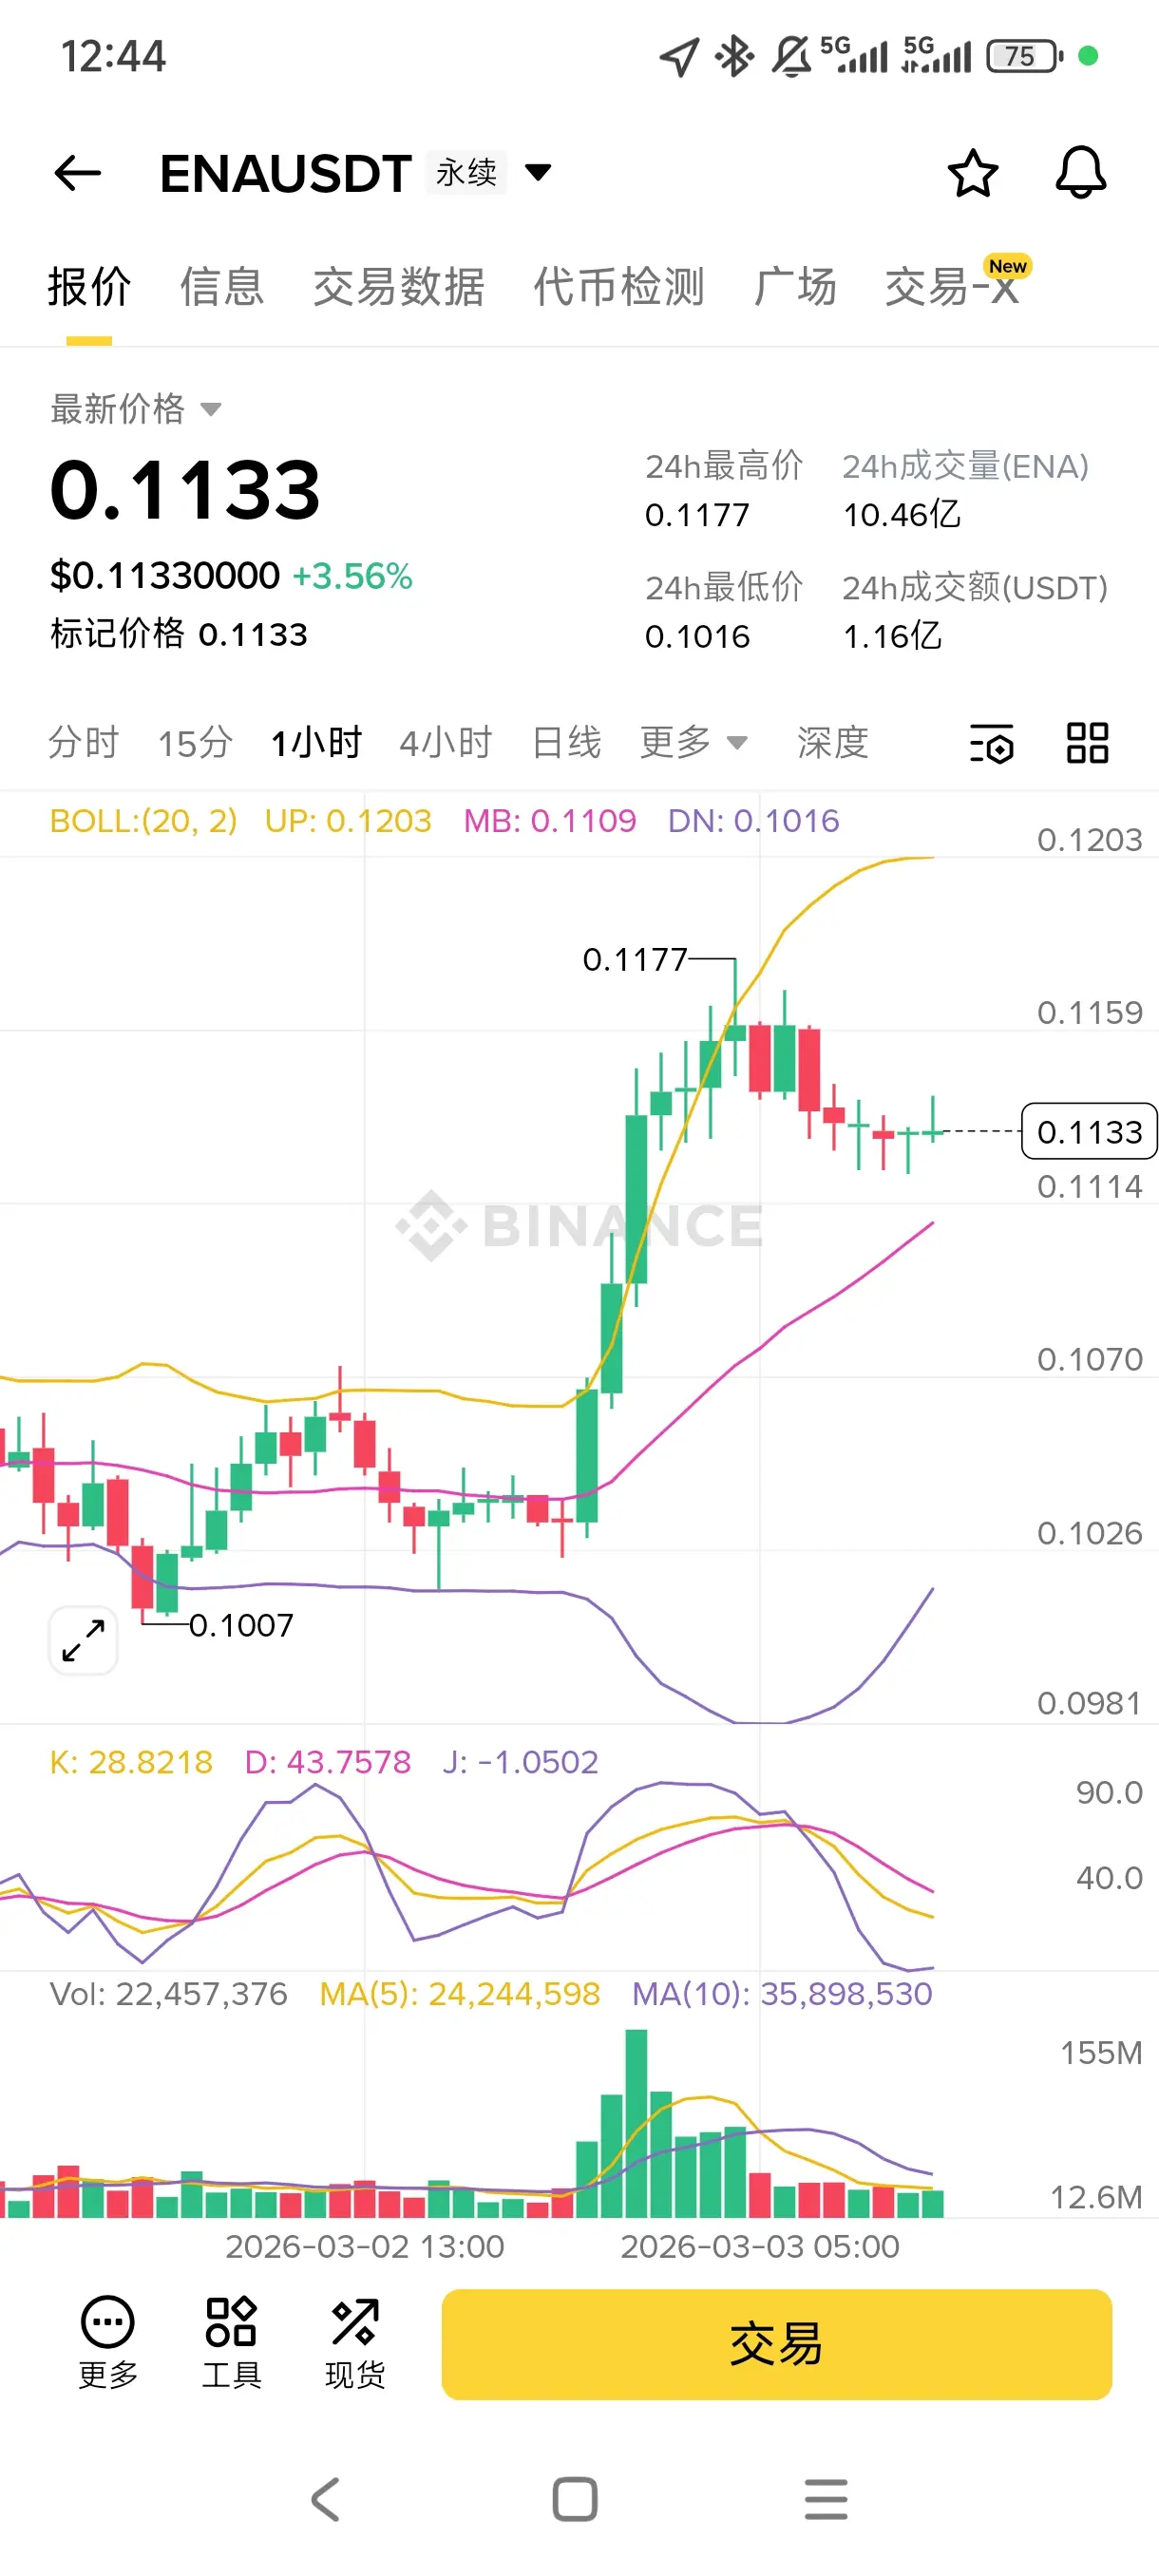
$ENA Empty Empty Empty📉
Q1 revenue exceeded expectations but unlocking and selling pressure are still present. Market sentiment is being held up by expectations of a Federal Reserve rate cut. This rally looks like a dead cat bounce; it’s best to exit quickly.
Technical analysis on the 1-hour chart: The middle band of the Bollinger Bands is under pressure, KDJ shows a death cross downward, indicating a clear bearish trend.
First target: 0.1099
Second target: 0.1019
Stop loss: 0.1224
$btc $ETH
View OriginalQ1 revenue exceeded expectations but unlocking and selling pressure are still present. Market sentiment is being held up by expectations of a Federal Reserve rate cut. This rally looks like a dead cat bounce; it’s best to exit quickly.
Technical analysis on the 1-hour chart: The middle band of the Bollinger Bands is under pressure, KDJ shows a death cross downward, indicating a clear bearish trend.
First target: 0.1099
Second target: 0.1019
Stop loss: 0.1224
$btc $ETH
[The user has shared his/her trading data. Go to the App to view more.]
- Reward
- like
- Comment
- Repost
- Share
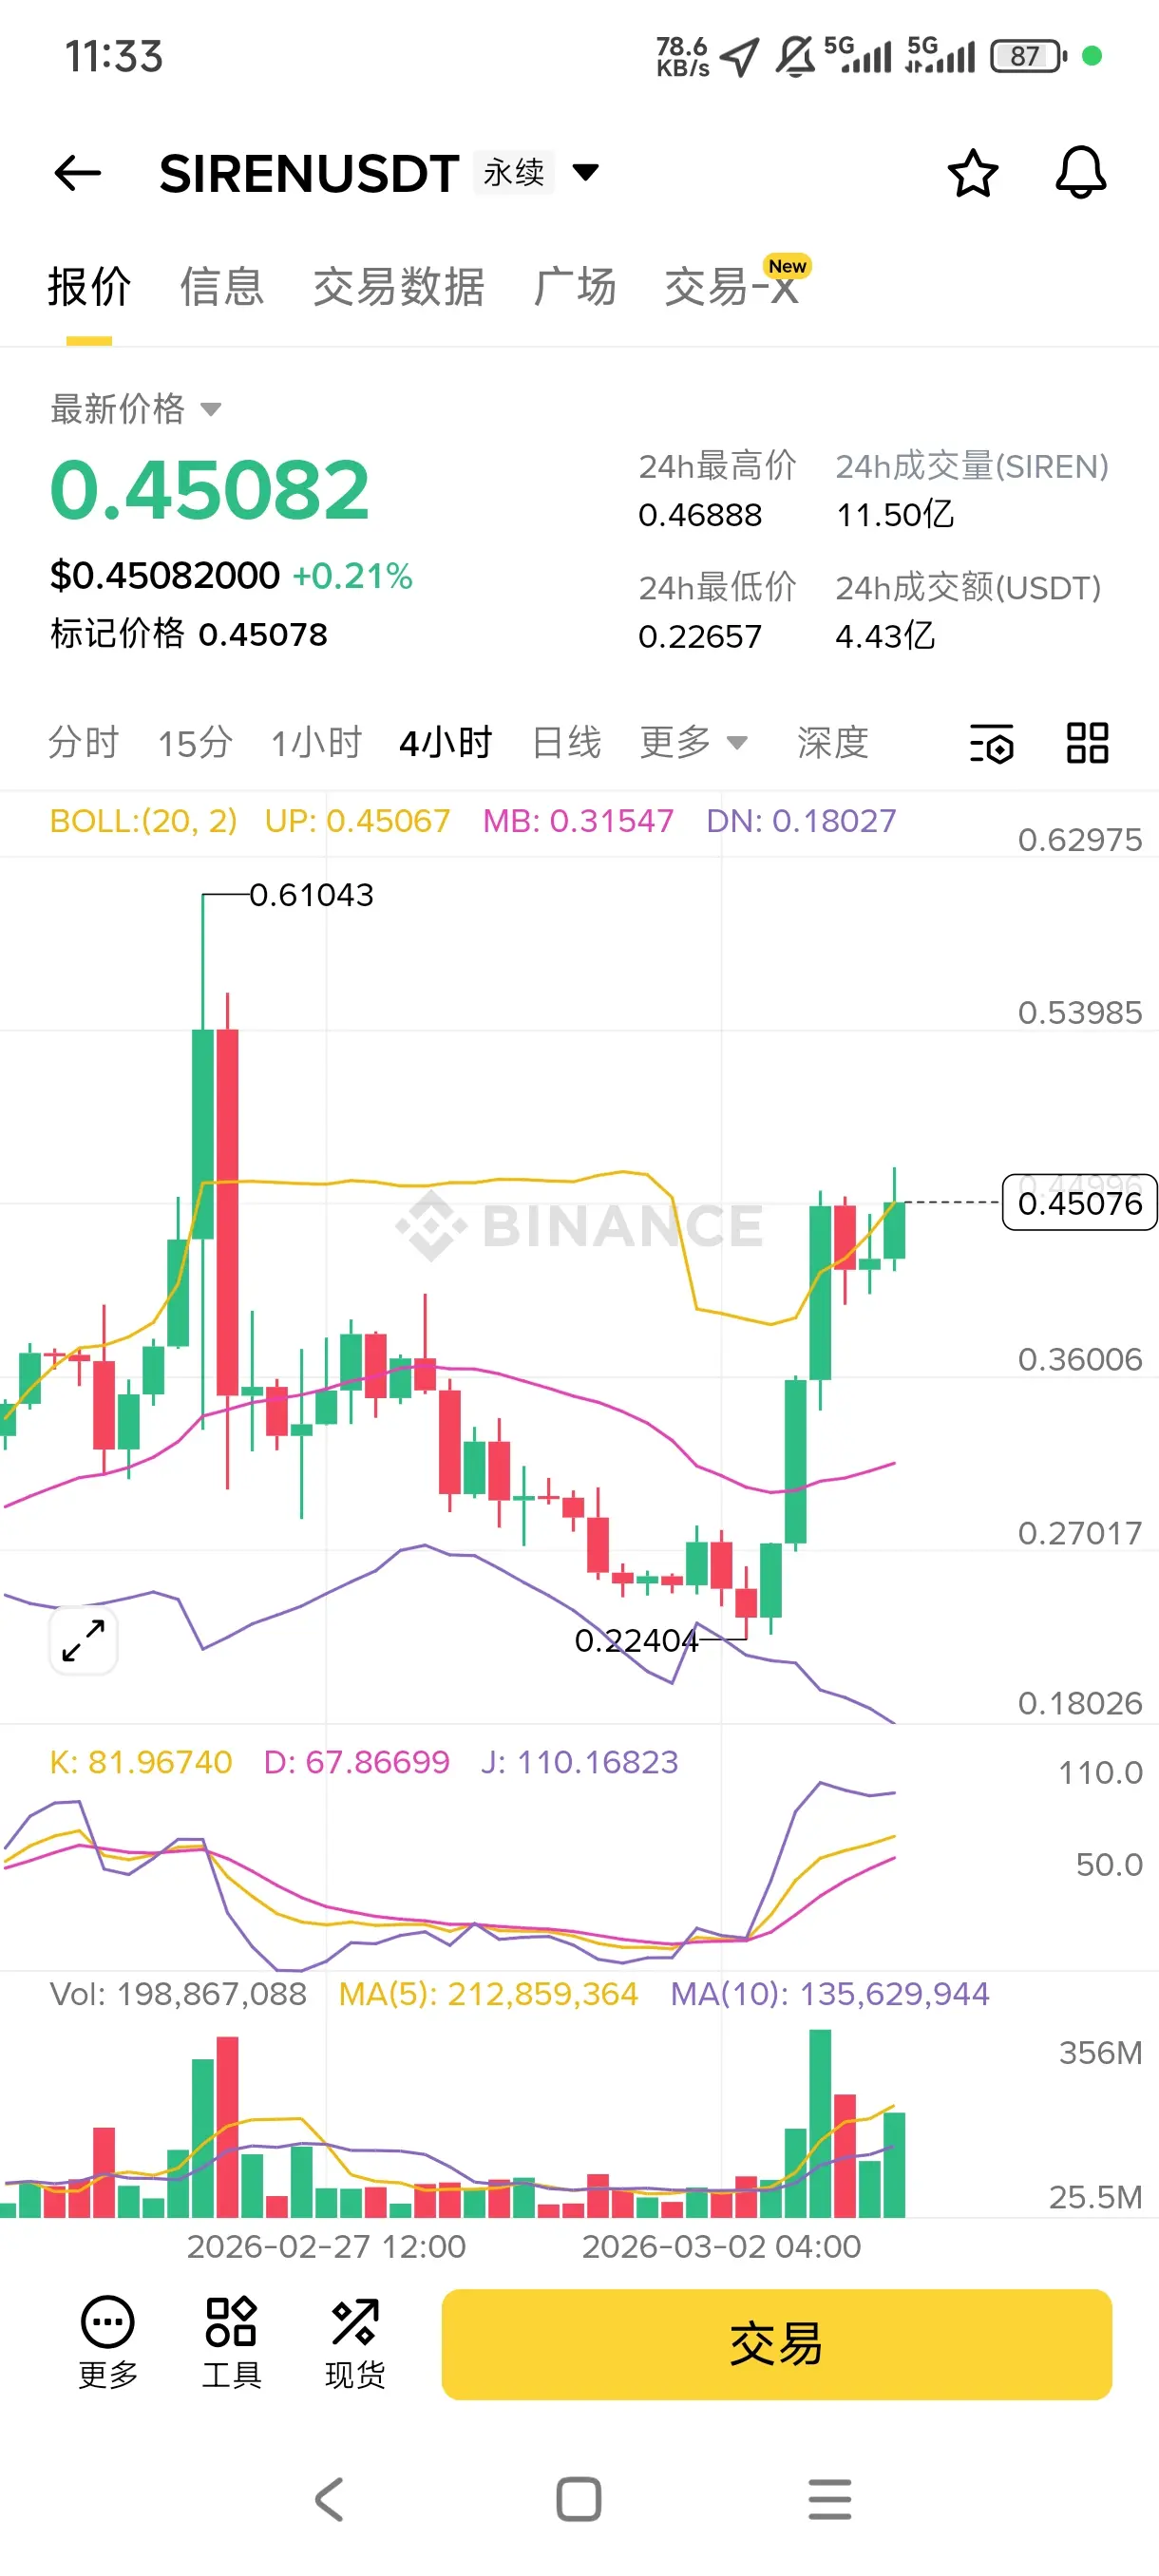
$SIREN Dodo Dodo 📈
SIREN experienced a violent rebound after being oversold, with strong capital inflows. The support at 0.2240 below is extremely solid, and the bullish reversal is clear. Short-term upward momentum remains.
Market hotspots are rotating into niche potential coins. SIREN, with its high volatility, has caught the attention of funds, rising nearly double from the bottom 😂
On the 4-hour technical chart, it is oscillating near the upper Bollinger Band, with KDJ at high levels but no obvious turning point.
First target 0.4689
Second target 0.5200
Stop-loss target 0.3800
$b
View OriginalSIREN experienced a violent rebound after being oversold, with strong capital inflows. The support at 0.2240 below is extremely solid, and the bullish reversal is clear. Short-term upward momentum remains.
Market hotspots are rotating into niche potential coins. SIREN, with its high volatility, has caught the attention of funds, rising nearly double from the bottom 😂
On the 4-hour technical chart, it is oscillating near the upper Bollinger Band, with KDJ at high levels but no obvious turning point.
First target 0.4689
Second target 0.5200
Stop-loss target 0.3800
$b
[The user has shared his/her trading data. Go to the App to view more.]
- Reward
- 1
- Comment
- Repost
- Share
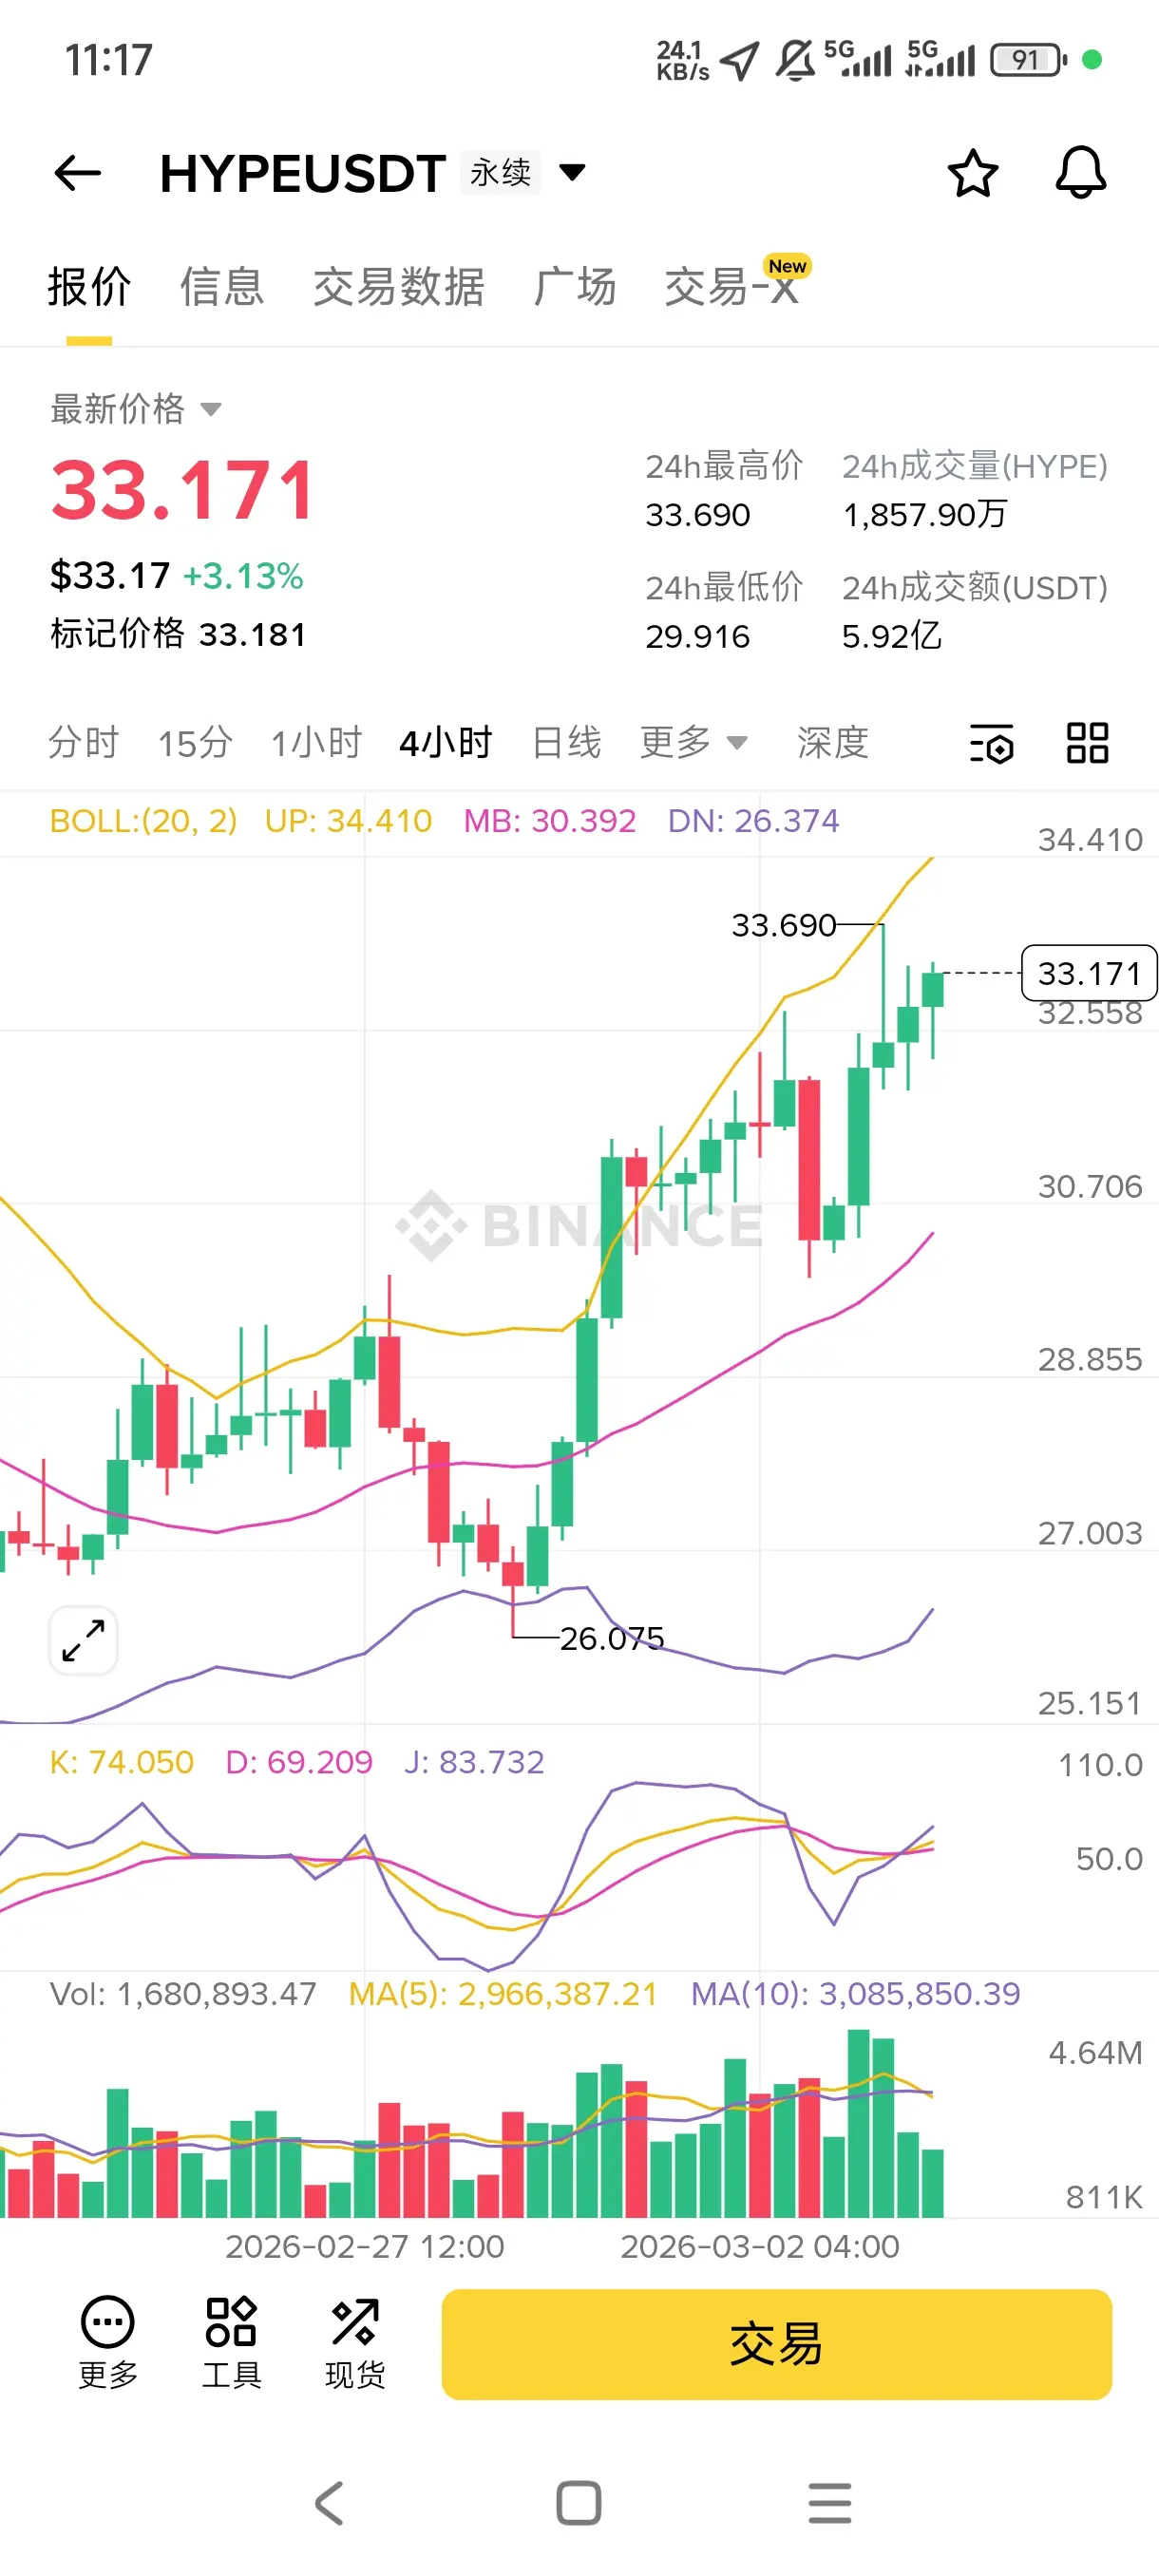
$HYPE DodoDodo 📈
HYPE is surging strongly, with bullish momentum at its peak. The price is stabilizing above the BOLL upper band, and the KDJ indicator shows a continued high-level golden cross. Trading volume is steadily increasing, indicating a clear upward trend. In the short term, it is expected to break previous highs and continue to rise.
The AI sector sentiment continues to ferment. HYPE, as a popular coin in the AI track, is being aggressively bought up by funds, directly pushing the price to explode😂
On the 4-hour technical chart, the BOLL upper band has been broken through, and
View OriginalHYPE is surging strongly, with bullish momentum at its peak. The price is stabilizing above the BOLL upper band, and the KDJ indicator shows a continued high-level golden cross. Trading volume is steadily increasing, indicating a clear upward trend. In the short term, it is expected to break previous highs and continue to rise.
The AI sector sentiment continues to ferment. HYPE, as a popular coin in the AI track, is being aggressively bought up by funds, directly pushing the price to explode😂
On the 4-hour technical chart, the BOLL upper band has been broken through, and
[The user has shared his/her trading data. Go to the App to view more.]
- Reward
- 1
- Comment
- Repost
- Share
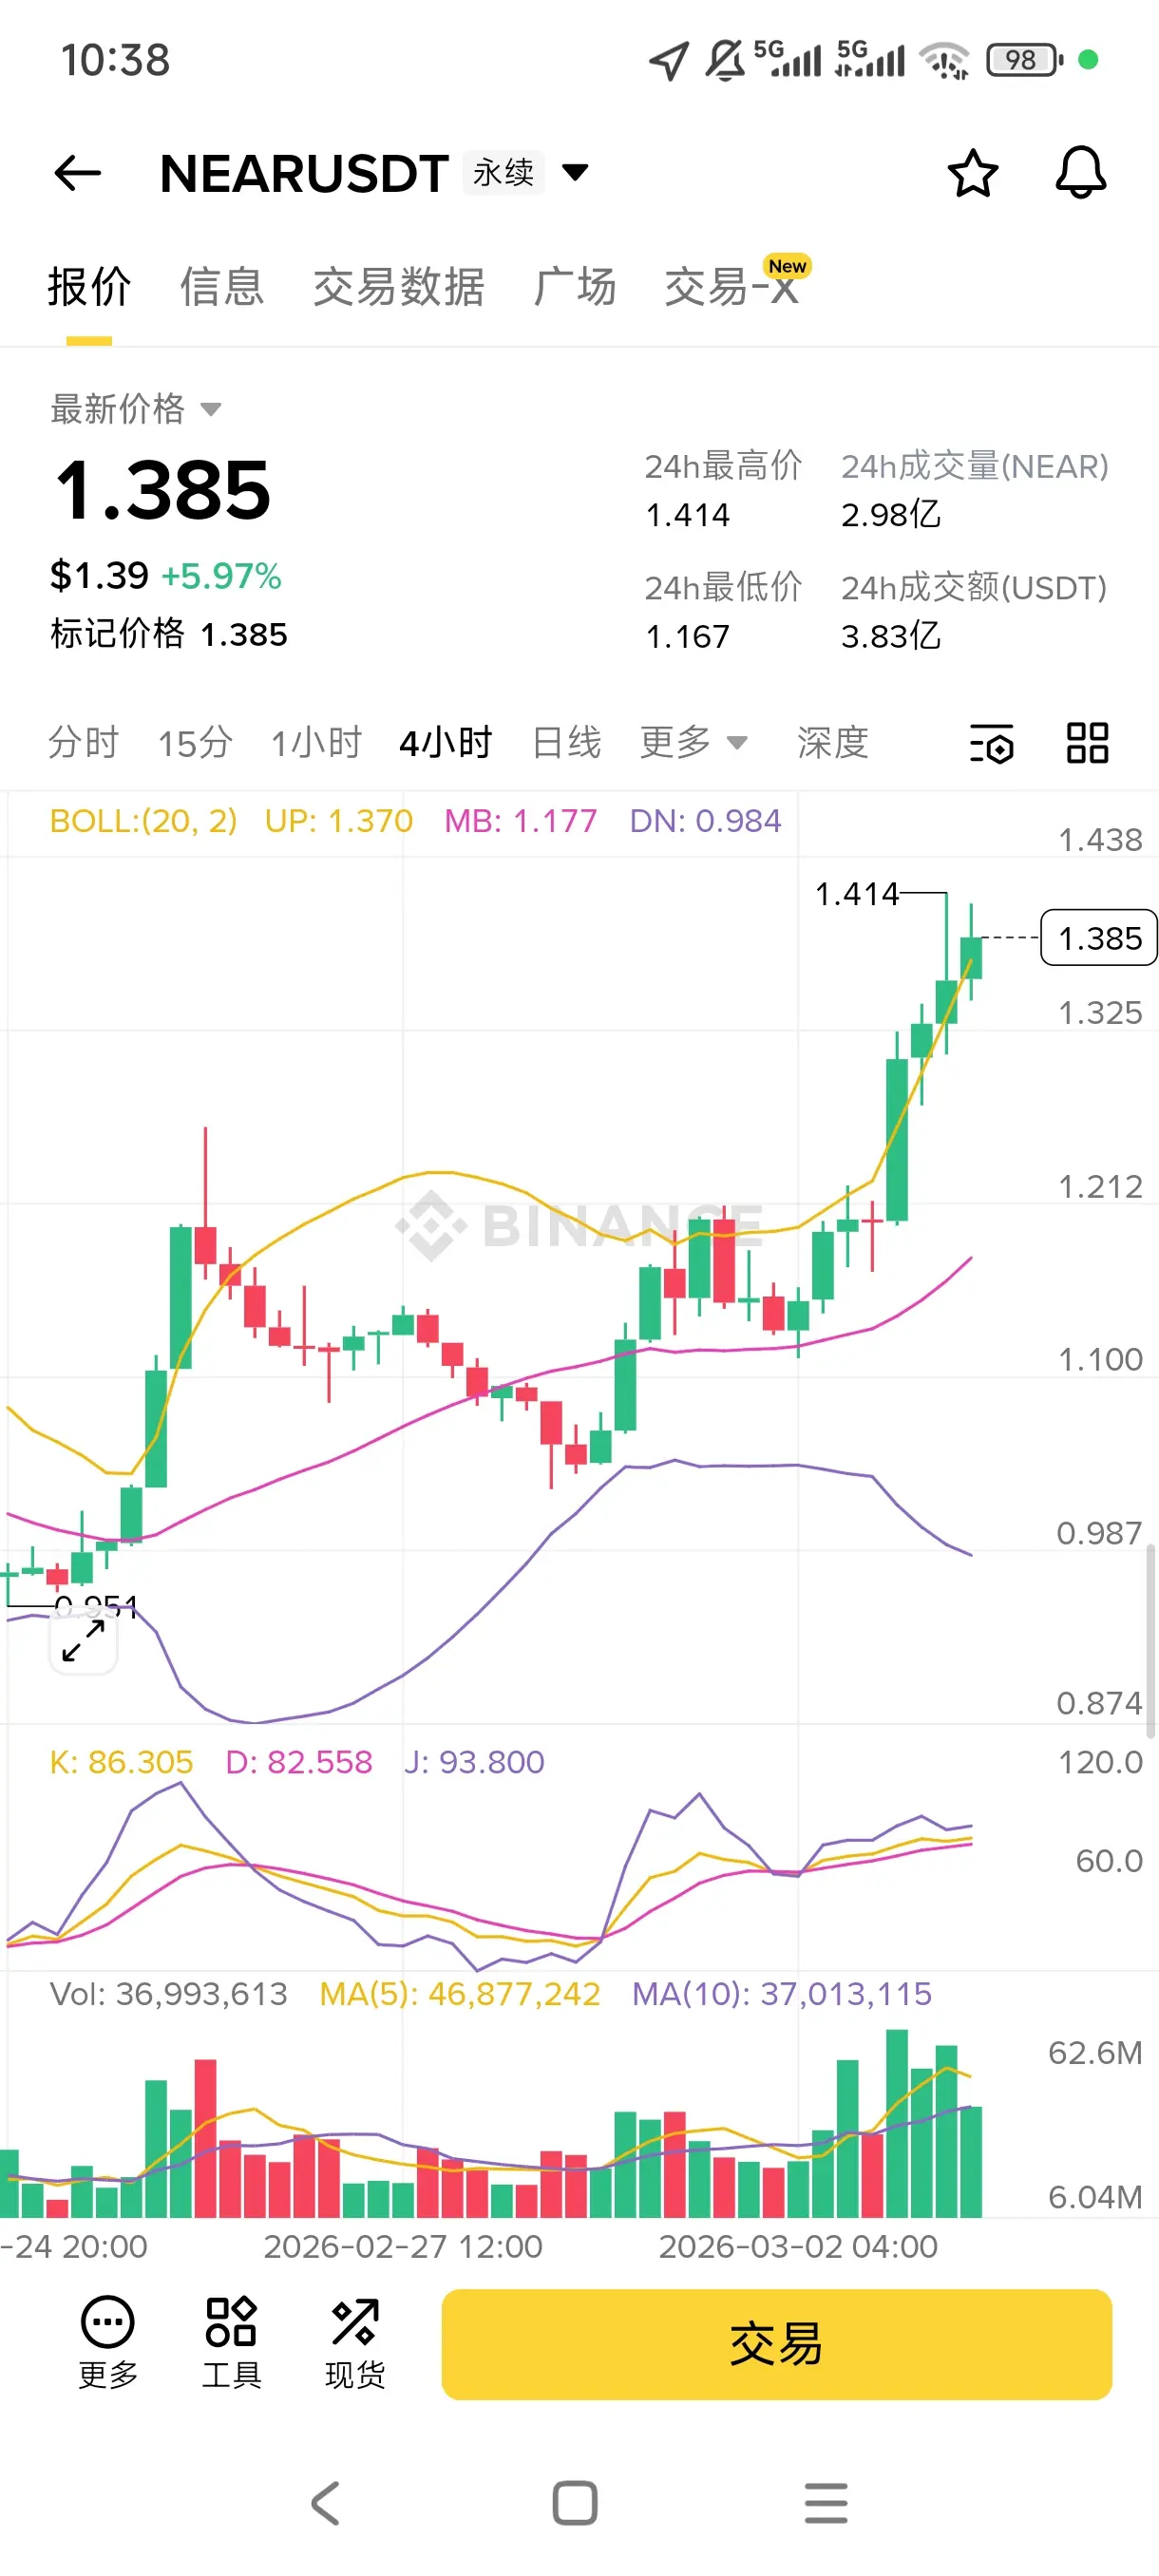
$NEAR DodoDodo 📈
NEAR surges strongly, bullish momentum at its peak, price stabilizes above the BOLL upper band, KDJ remains in a high-level golden cross, trading volume continues to expand, the upward trend is clear, and there is short-term potential to break previous highs and continue rising.
New projects in the NEAR ecosystem are launching rapidly, on-chain activity skyrockets, funds are frantically accumulating, directly pushing the price up 😂
Technical analysis on the 4-hour chart shows the BOLL upper band breakout, and the KDJ remains in a high-level golden cross.
First target 1
View OriginalNEAR surges strongly, bullish momentum at its peak, price stabilizes above the BOLL upper band, KDJ remains in a high-level golden cross, trading volume continues to expand, the upward trend is clear, and there is short-term potential to break previous highs and continue rising.
New projects in the NEAR ecosystem are launching rapidly, on-chain activity skyrockets, funds are frantically accumulating, directly pushing the price up 😂
Technical analysis on the 4-hour chart shows the BOLL upper band breakout, and the KDJ remains in a high-level golden cross.
First target 1
[The user has shared his/her trading data. Go to the App to view more.]
- Reward
- like
- Comment
- Repost
- Share
$DOT Key Data Before DOT Reform:
- Current Circulating Supply: approximately 1.5 billion tokens
- Original Model: No total cap, with an annual issuance of about 120 million tokens (inflation around 10%)
- Projection Based on the Old Model: by 2040, the total supply would inflate to over 3.4 billion tokens
This reform directly locks the cap at 2.1 billion and significantly reduces issuance, which is a strong deflationary positive.
DOT-1,25%
[The user has shared his/her trading data. Go to the App to view more.]
- Reward
- 2
- Comment
- Repost
- Share
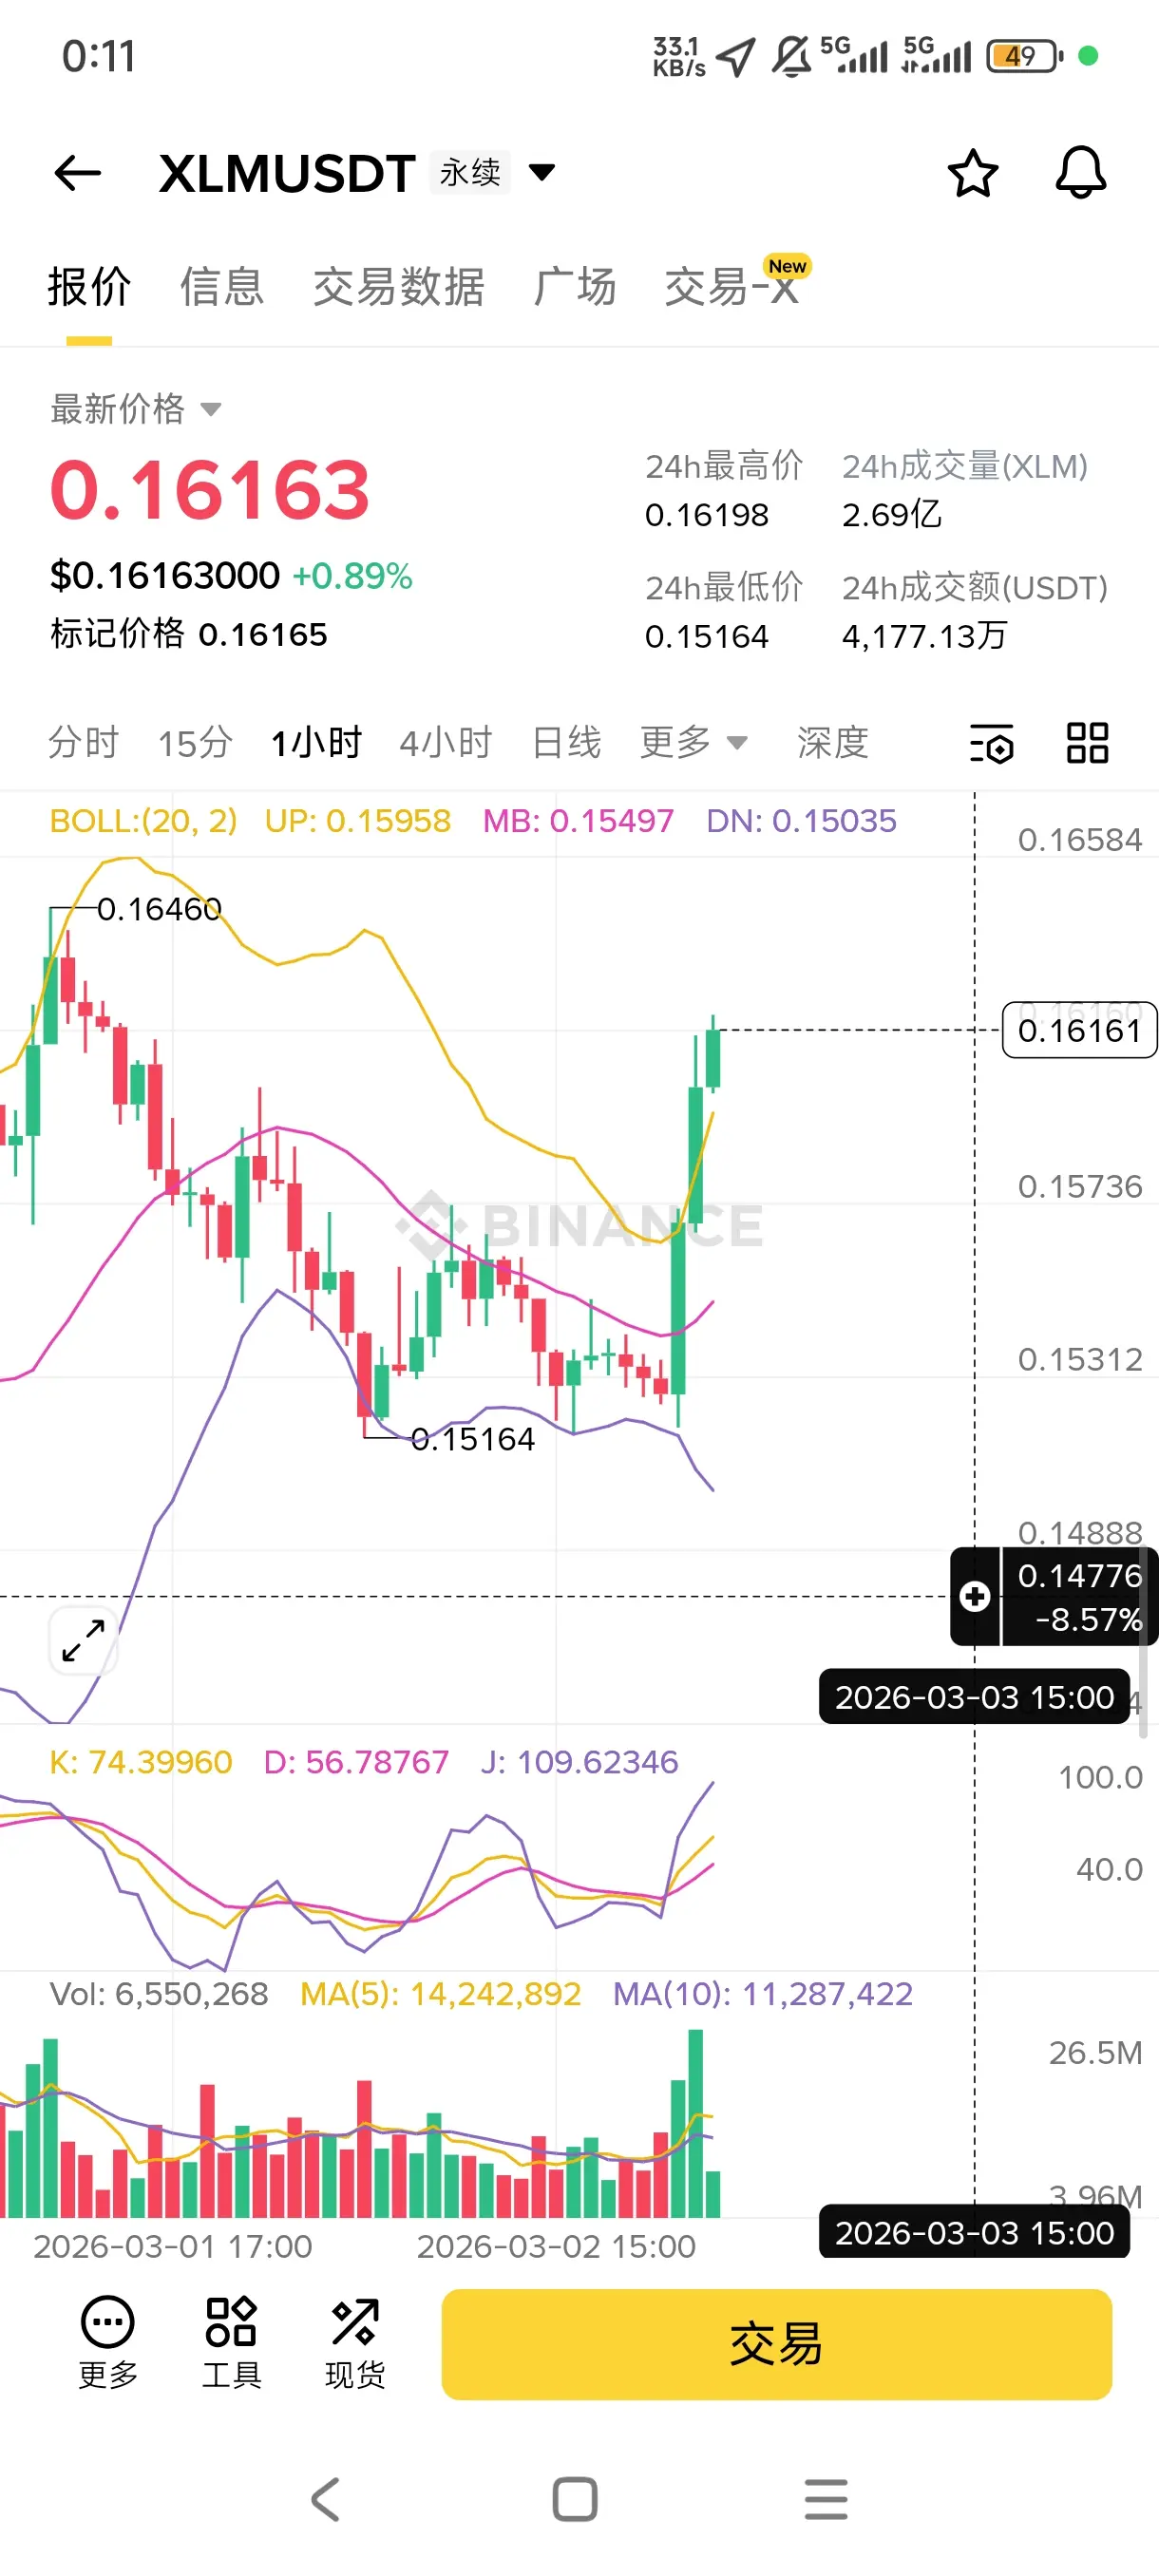
$XLM Dodo Dodo 📈
XLM rebounds from the bottom, funds enter the market to buy the dip, support levels are solid, and the bulls are starting to push back. Short-term rebound space opens up, with potential to continue rising.
The overall crypto market sentiment is warming, with funds flowing back into public chain sectors. As an established coin, XLM is being snatched up by investors 😂
On the technical side, the 1-hour chart shows effective support at the BOLL middle band, with the KDJ indicator forming a golden cross upward.
First target: 0.17
Second target: 0.18
Stop-loss target: 0.15
$btc $E
View OriginalXLM rebounds from the bottom, funds enter the market to buy the dip, support levels are solid, and the bulls are starting to push back. Short-term rebound space opens up, with potential to continue rising.
The overall crypto market sentiment is warming, with funds flowing back into public chain sectors. As an established coin, XLM is being snatched up by investors 😂
On the technical side, the 1-hour chart shows effective support at the BOLL middle band, with the KDJ indicator forming a golden cross upward.
First target: 0.17
Second target: 0.18
Stop-loss target: 0.15
$btc $E
[The user has shared his/her trading data. Go to the App to view more.]
- Reward
- like
- Comment
- Repost
- Share
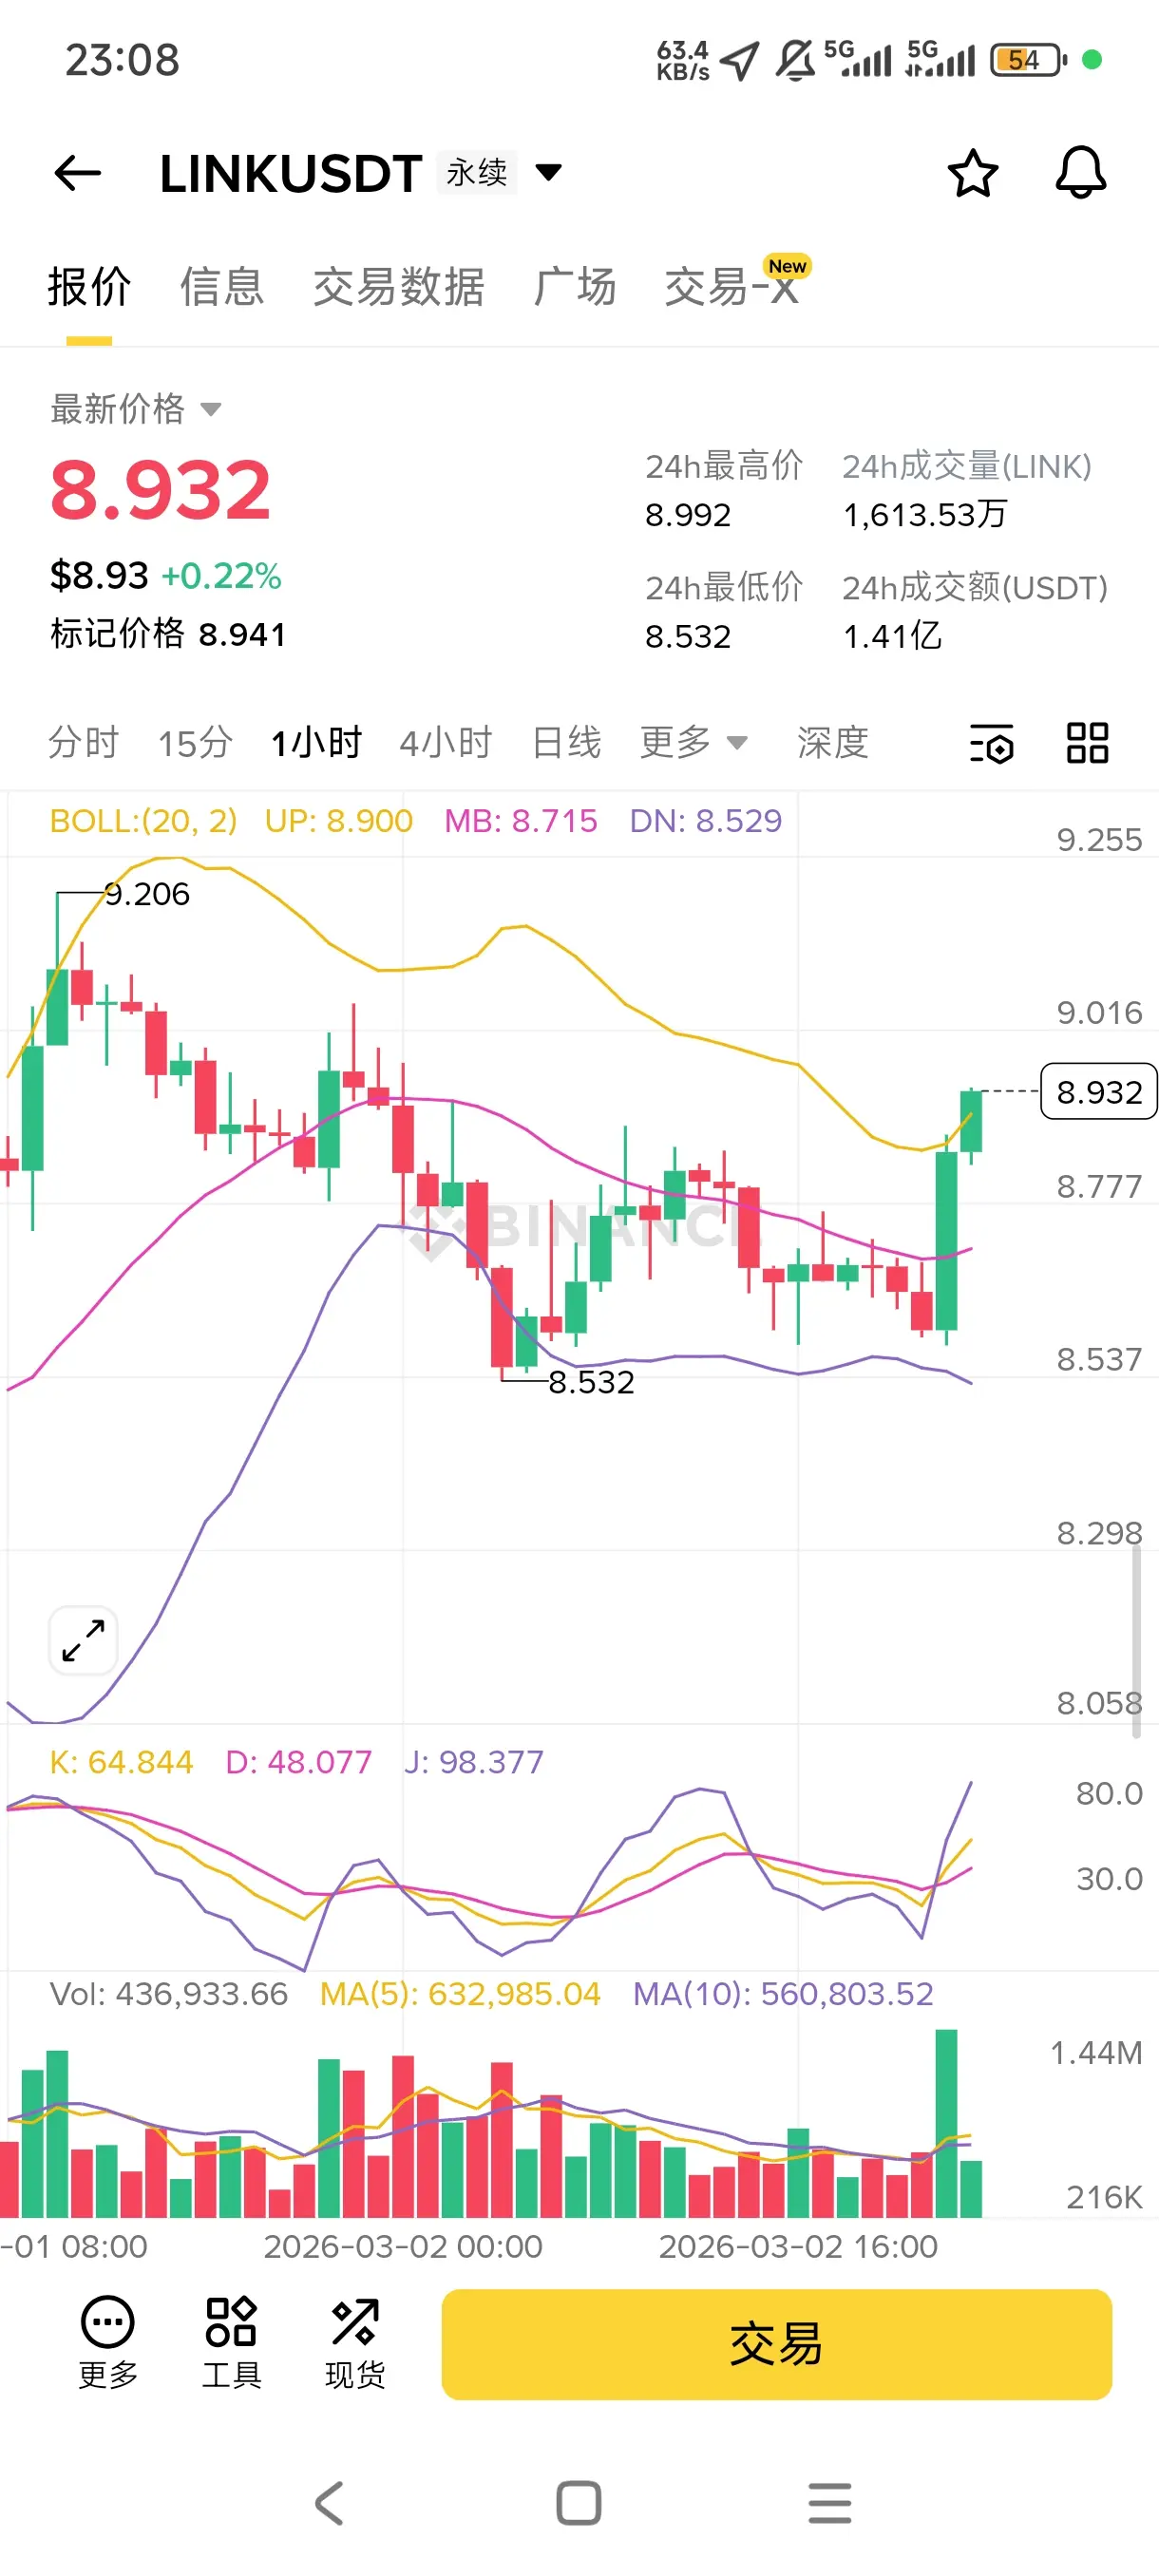
$LINK Dodo Dodo 📈
LINK rebounds from the bottom, funds enter the market to buy the dip, the support below is solid, the bulls begin to counterattack, short-term rebound space opens up, and a continued surge is expected.
The overall bullish sentiment in the crypto market is warming up, funds are flowing back into the oracle sector, and LINK, as a leader, is being snatched up by investors😂
On the technical side, the 1-hour chart shows that the BOLL middle band support is effective, and the KDJ indicator is showing a bullish crossover at low levels.
First target: 9.29
Second target: 9.99
View OriginalLINK rebounds from the bottom, funds enter the market to buy the dip, the support below is solid, the bulls begin to counterattack, short-term rebound space opens up, and a continued surge is expected.
The overall bullish sentiment in the crypto market is warming up, funds are flowing back into the oracle sector, and LINK, as a leader, is being snatched up by investors😂
On the technical side, the 1-hour chart shows that the BOLL middle band support is effective, and the KDJ indicator is showing a bullish crossover at low levels.
First target: 9.29
Second target: 9.99
[The user has shared his/her trading data. Go to the App to view more.]
- Reward
- 1
- Comment
- Repost
- Share
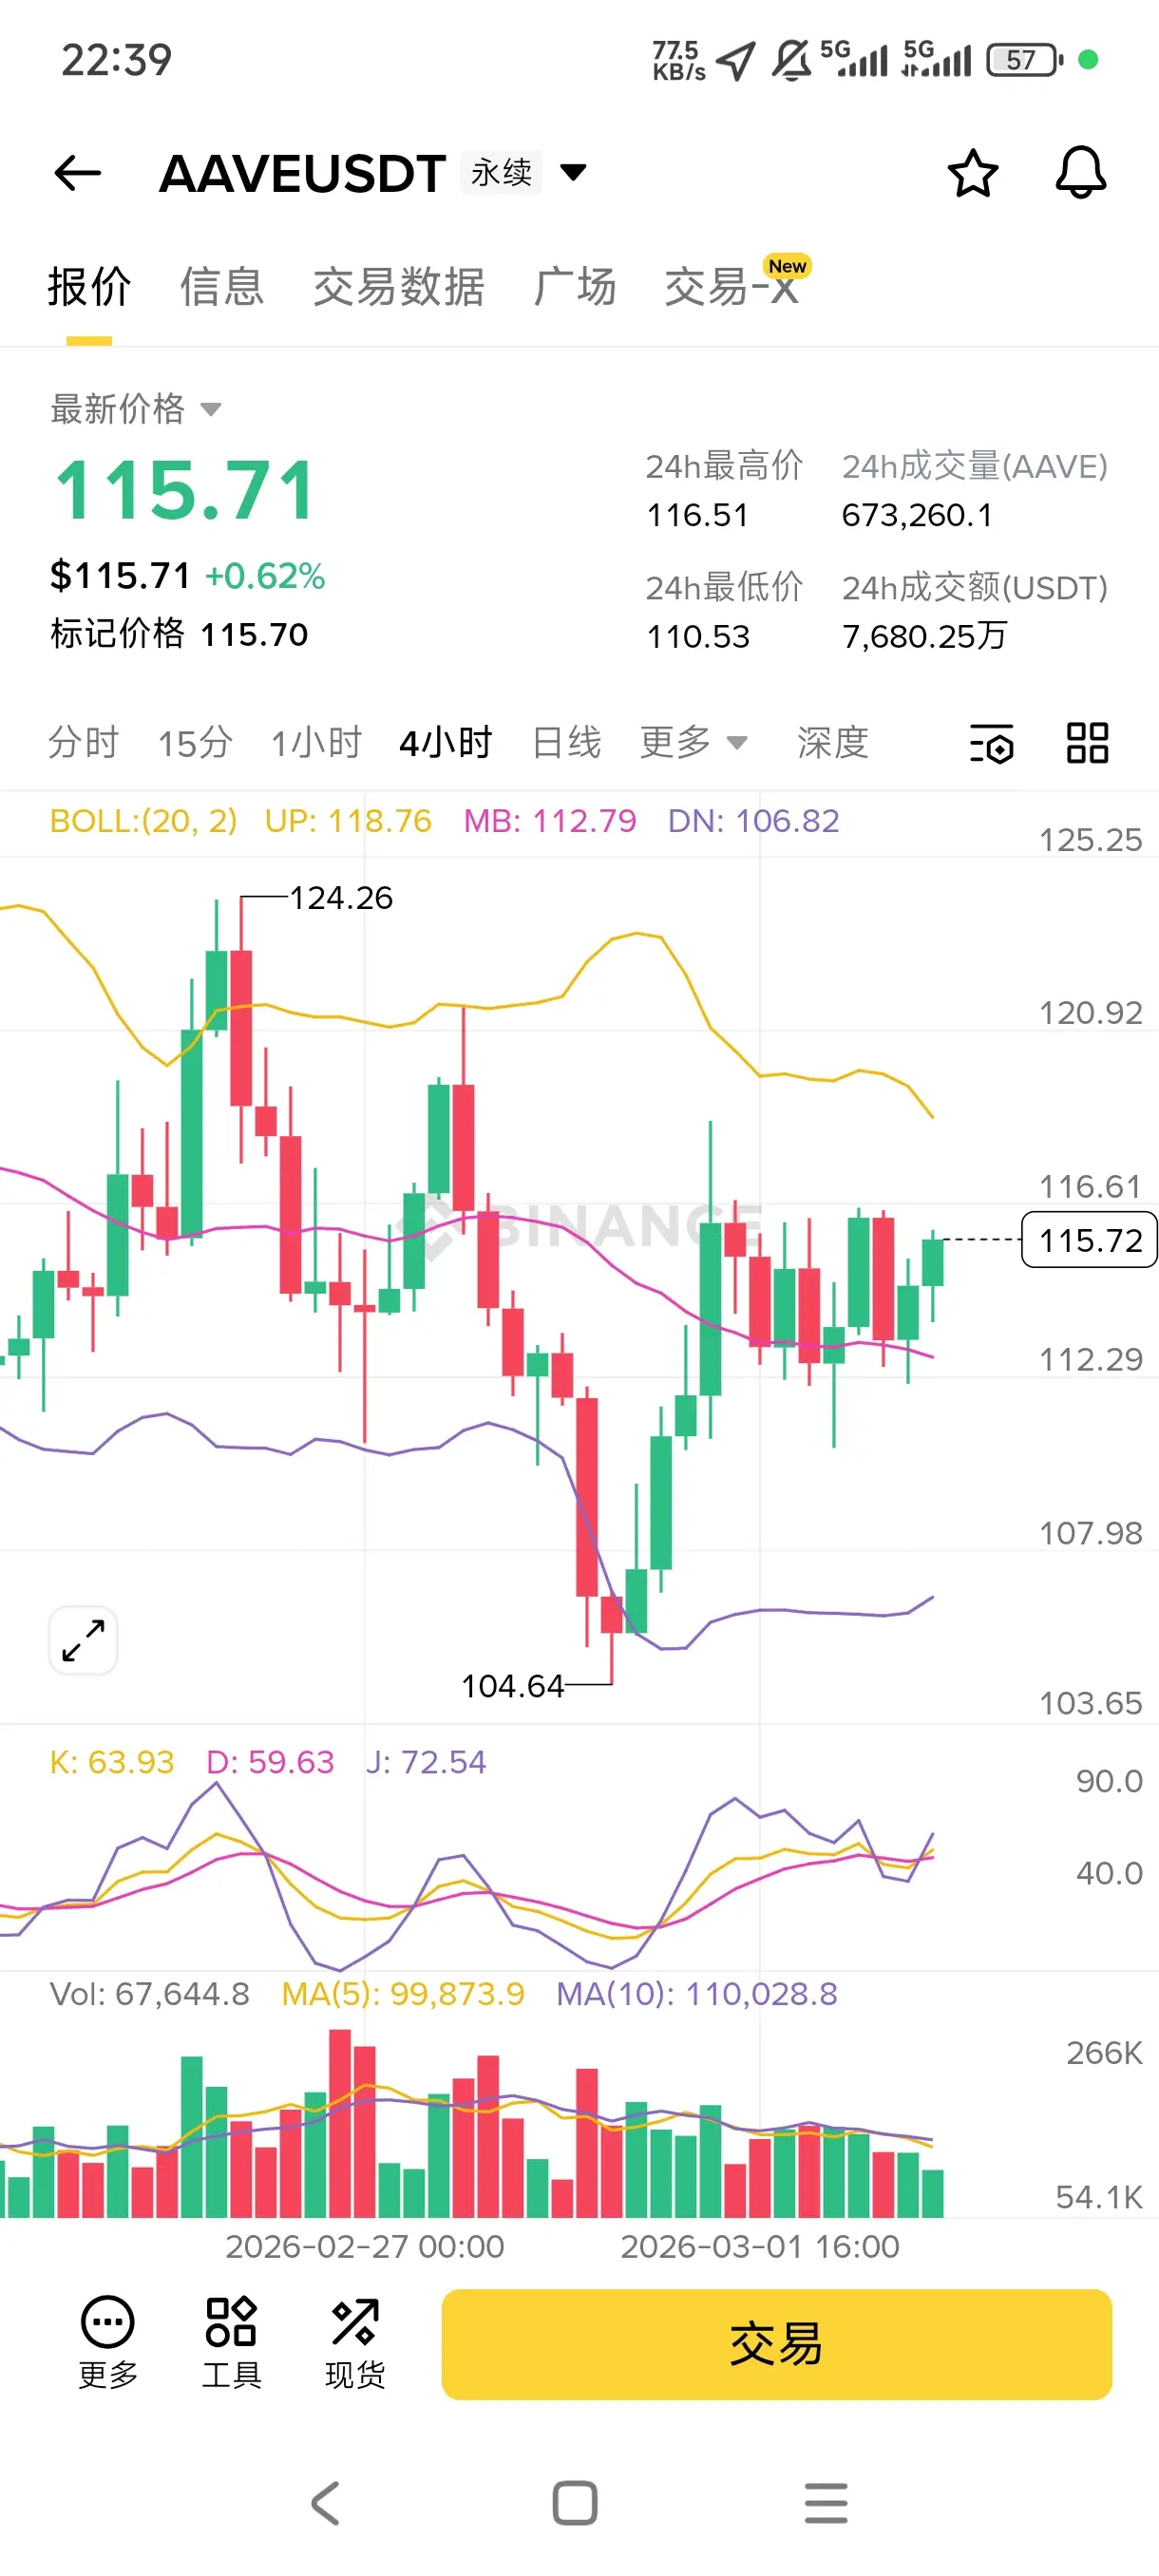
$AAVE DodoDodo 📈
AAVE rebounds strongly after being oversold, with steady capital inflow, solid support below, an obvious oscillating upward trend, and short-term potential for further gains.
The DeFi sector sentiment is warming up, with funds flowing back into leading projects. AAVE, as the leader, takes the lead in rallying 😂
On the 4-hour technical chart, the BOLL middle band support is effective, and the KDJ is showing a golden cross upward from a low position.
First target 120
Second target 127
Stop-loss target 107
$btc $ETH
View OriginalAAVE rebounds strongly after being oversold, with steady capital inflow, solid support below, an obvious oscillating upward trend, and short-term potential for further gains.
The DeFi sector sentiment is warming up, with funds flowing back into leading projects. AAVE, as the leader, takes the lead in rallying 😂
On the 4-hour technical chart, the BOLL middle band support is effective, and the KDJ is showing a golden cross upward from a low position.
First target 120
Second target 127
Stop-loss target 107
$btc $ETH
[The user has shared his/her trading data. Go to the App to view more.]
- Reward
- 1
- Comment
- Repost
- Share
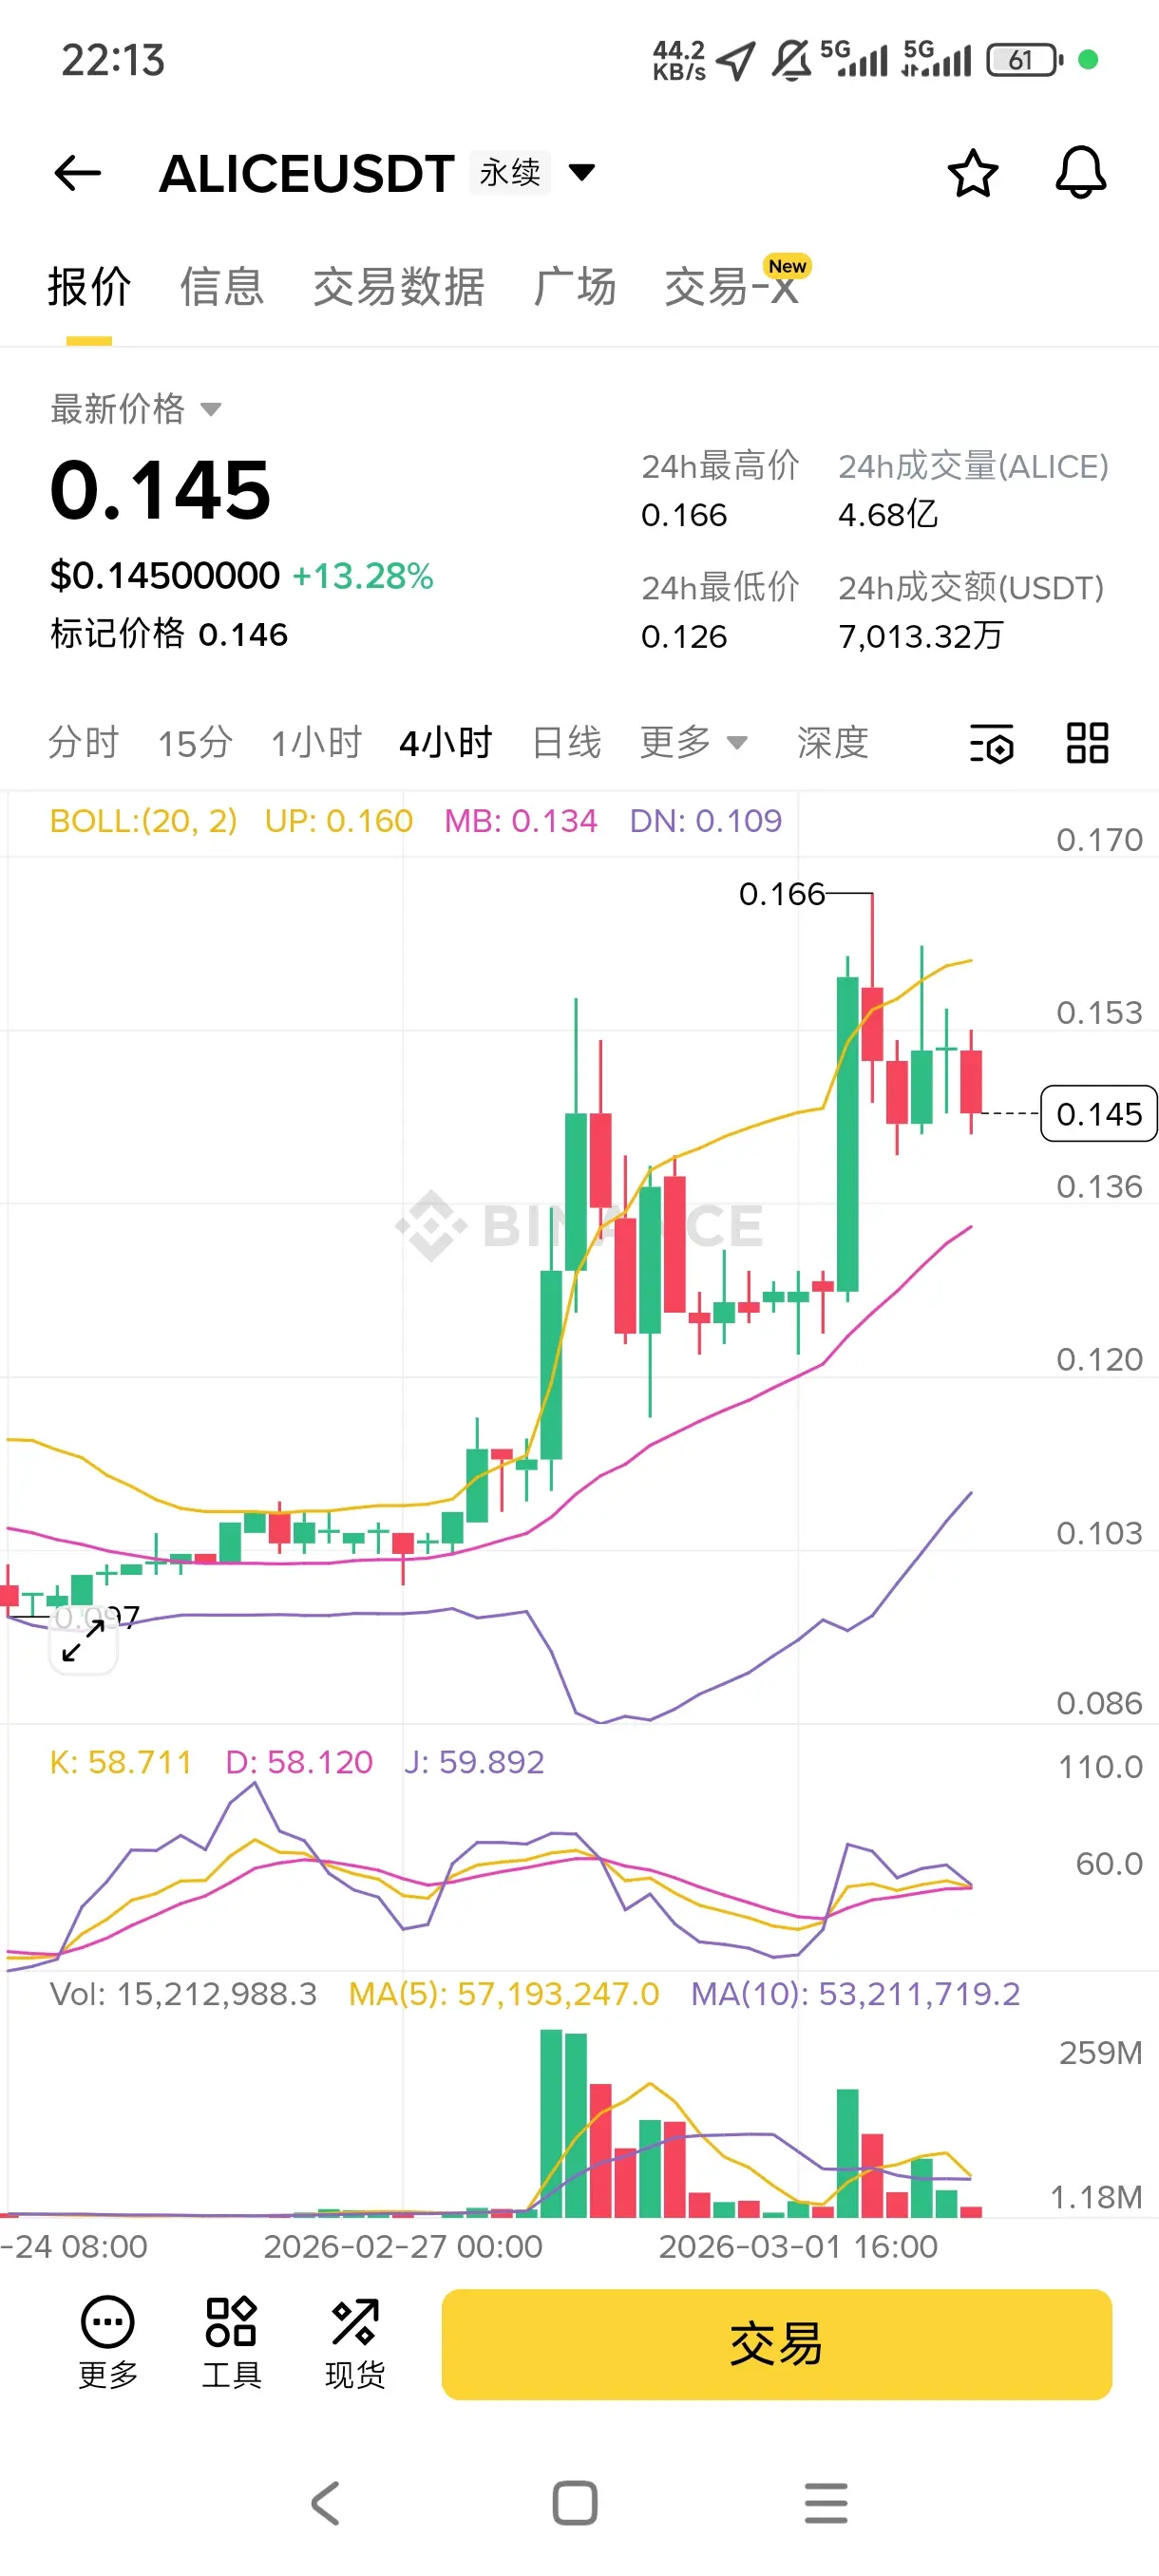
$ALICE Dodo Dodo 📈
ALICE's GameFi hype is surging strongly, with continuous capital inflows. After a pullback, the bulls are rallying again, the upward channel remains intact, and there is momentum for a new high.
The overall crypto market sentiment is extremely bullish, with the GameFi sector collectively taking off. ALICE is being aggressively bought up by funds, causing a sharp surge 😂
On the 4-hour technical chart, the BOLL middle band support is strong, and the MA moving averages are in a bullish alignment.
First target 0.15
Second target 0.16
Stop-loss at 0.13
$btc $ETH
View OriginalALICE's GameFi hype is surging strongly, with continuous capital inflows. After a pullback, the bulls are rallying again, the upward channel remains intact, and there is momentum for a new high.
The overall crypto market sentiment is extremely bullish, with the GameFi sector collectively taking off. ALICE is being aggressively bought up by funds, causing a sharp surge 😂
On the 4-hour technical chart, the BOLL middle band support is strong, and the MA moving averages are in a bullish alignment.
First target 0.15
Second target 0.16
Stop-loss at 0.13
$btc $ETH
[The user has shared his/her trading data. Go to the App to view more.]
- Reward
- 2
- Comment
- Repost
- Share
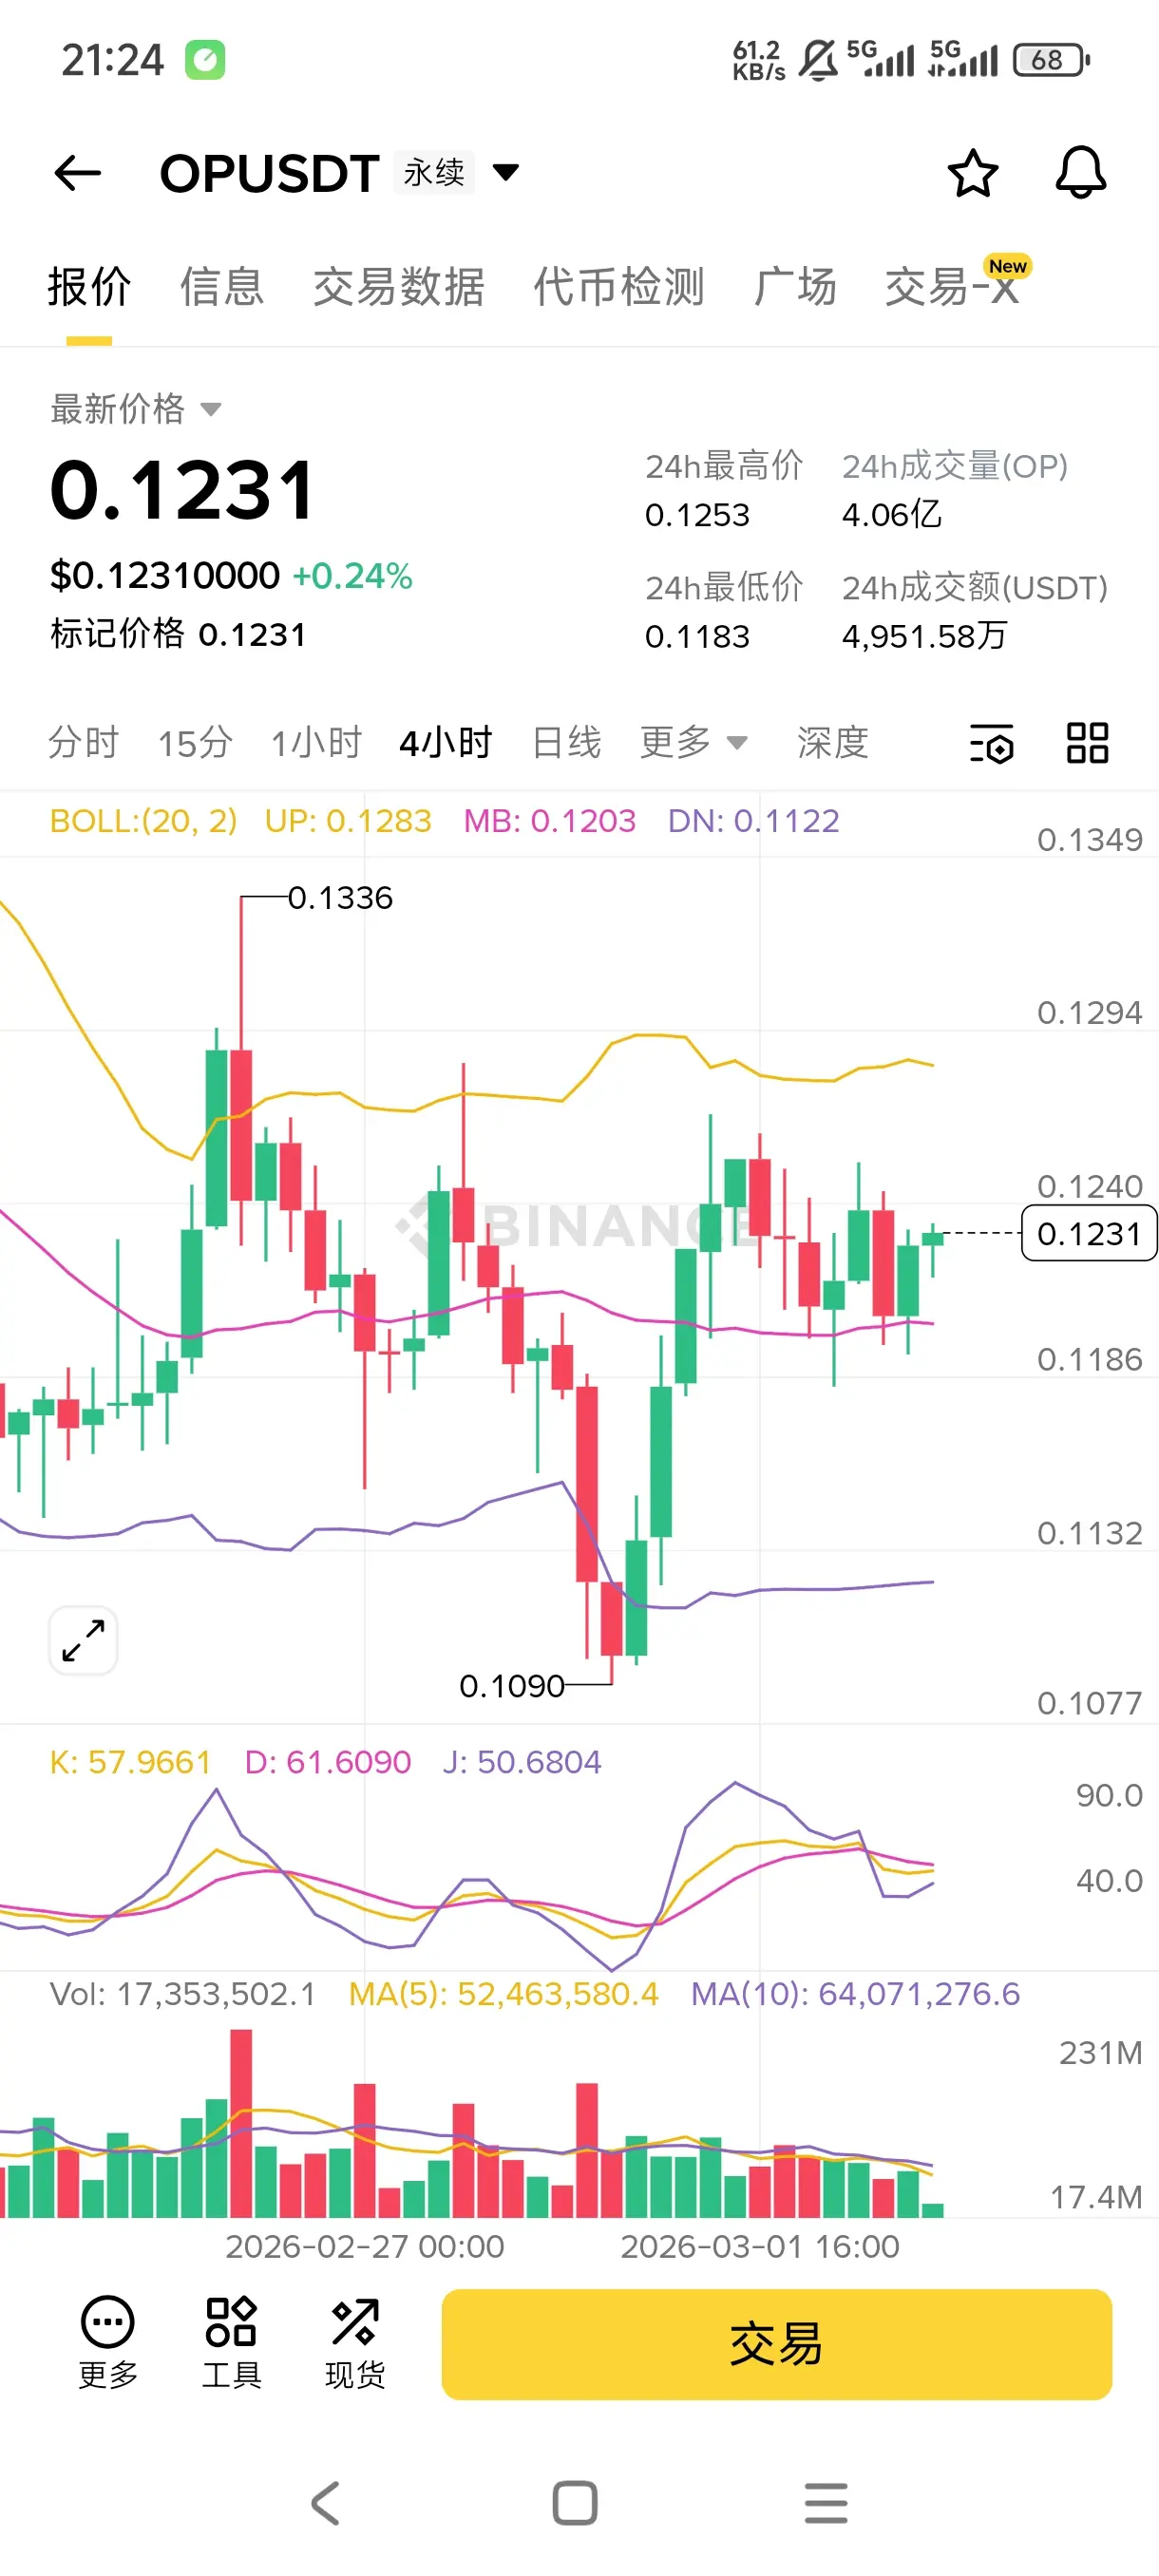
$OP DODO 📈
OP stabilizes and rebounds after a sharp decline, capital begins to flow back in, solid support levels below, and the upward trend with fluctuations is obvious. In the short term, it is expected to break through resistance levels and continue rising.
Ethereum ecosystem benefits continue to grow, Layer2 sector sentiment warms up, and capital inflow drives OP to stop falling and rebound😂
Technical analysis on the 4-hour chart shows that the middle Bollinger Band support is effective, and KDJ is showing a golden cross at low levels.
First target 0.13
Second target 0.14
Stop-los
View OriginalOP stabilizes and rebounds after a sharp decline, capital begins to flow back in, solid support levels below, and the upward trend with fluctuations is obvious. In the short term, it is expected to break through resistance levels and continue rising.
Ethereum ecosystem benefits continue to grow, Layer2 sector sentiment warms up, and capital inflow drives OP to stop falling and rebound😂
Technical analysis on the 4-hour chart shows that the middle Bollinger Band support is effective, and KDJ is showing a golden cross at low levels.
First target 0.13
Second target 0.14
Stop-los
[The user has shared his/her trading data. Go to the App to view more.]
- Reward
- 3
- Comment
- Repost
- Share
Trending Topics
View More806.34K Popularity
306.36K Popularity
141.13K Popularity
402.3K Popularity
31.86K Popularity
Pin