#BTCMarketAnalysis
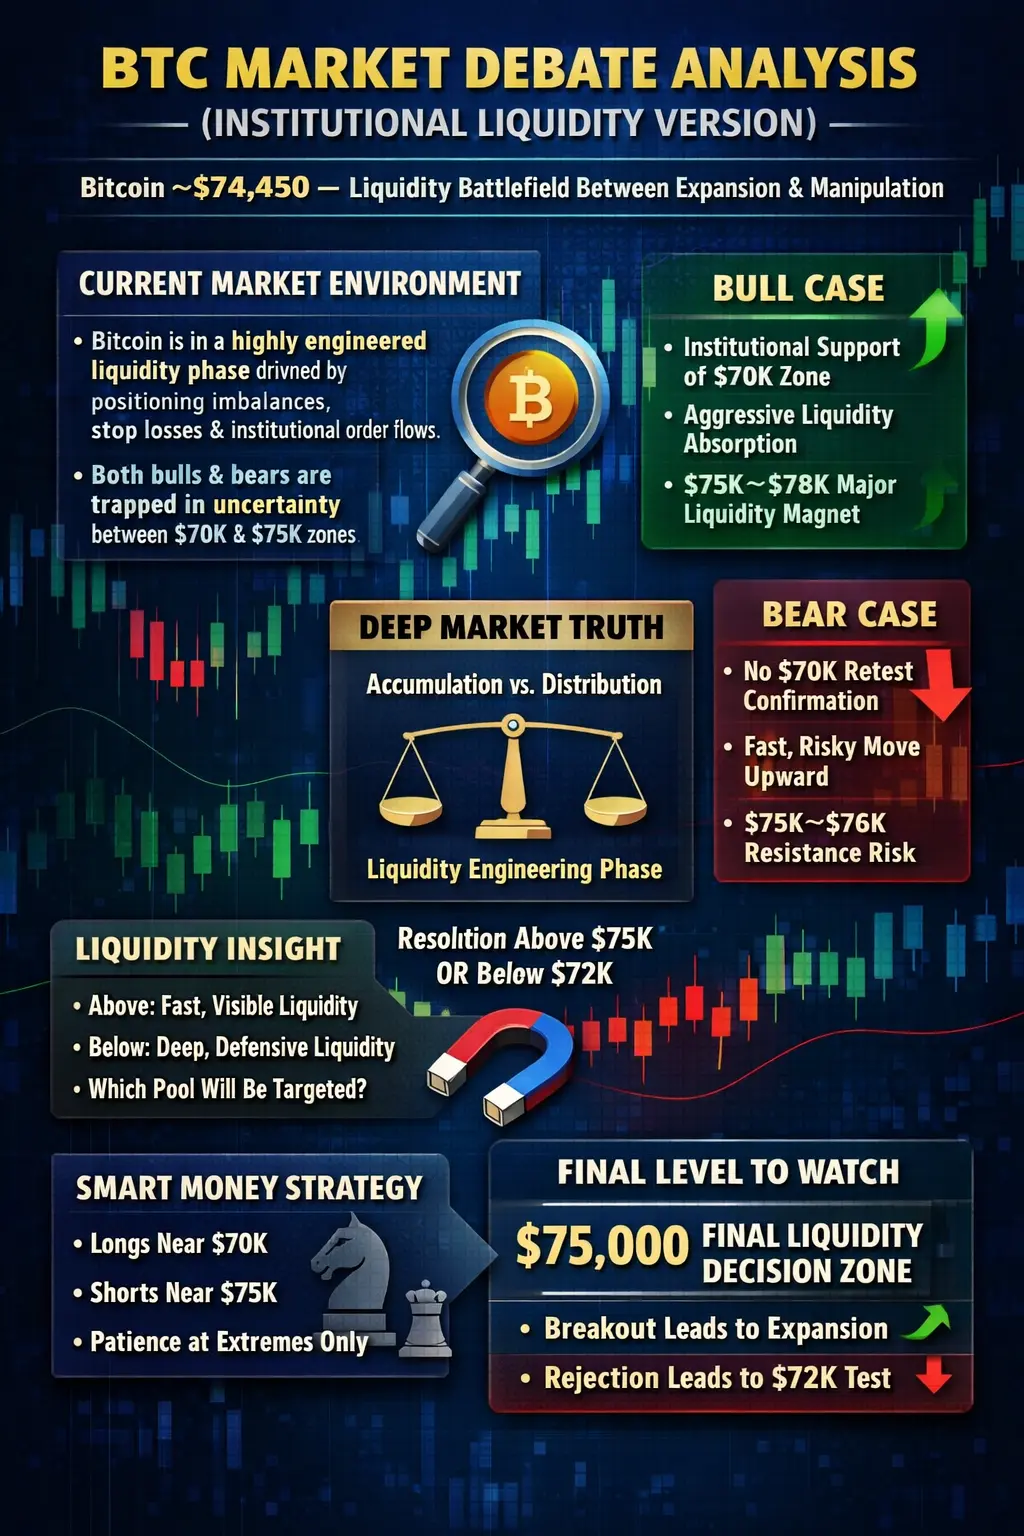
🧠 CURRENT MARKET ENVIRONMENT
At this stage, Bitcoin is no longer simply moving within a traditional technical trend structure. Instead, it is operating inside a highly engineered liquidity environment, where price action is increasingly driven by positioning imbalances, stop-loss clusters, and institutional order flow rather than organic spot demand alone.
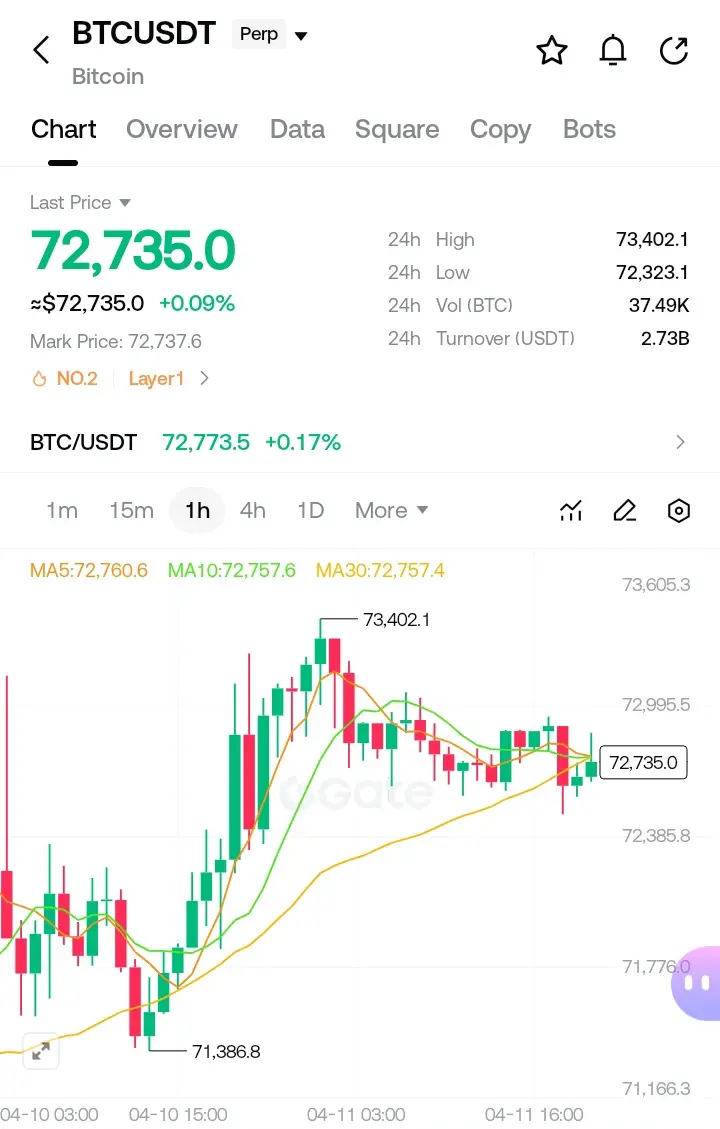
The move from the $70,000 region toward $74,450 has created a critical transitional zone where both bulls and bears are being forced into uncertainty. This is a classic phase seen before major expansion legs — where volatility compresses and then expands violently once liquidity is fully engineered.
Importantly, price is no longer responding purely to visible support and resistance levels. Instead, it is reacting to invisible liquidity layers — including liquidation zones, leveraged positioning, and algorithmic order clustering. In such environments, price movements often appear random to retail participants, but are highly structured from a liquidity execution perspective.
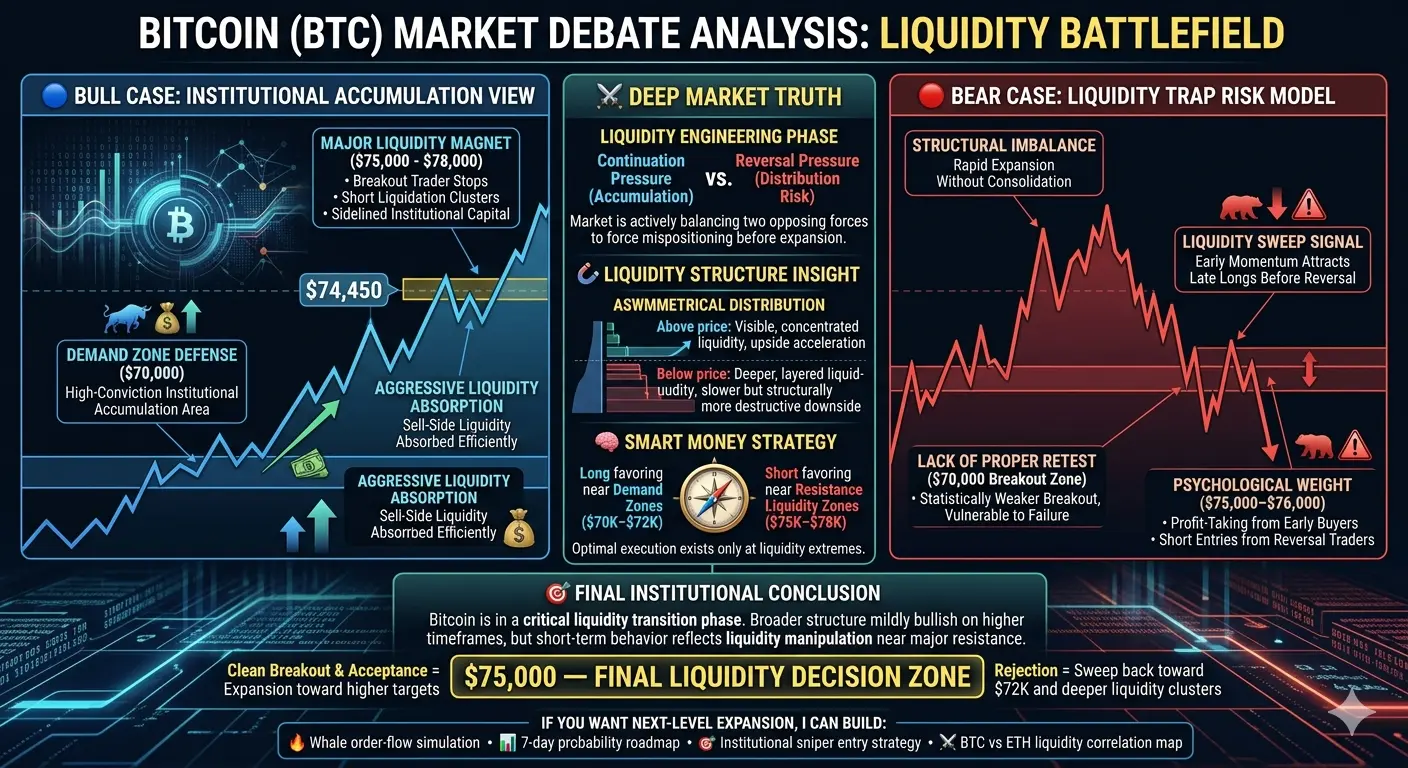
🔵 BULL CASE (INSTITUTIONAL ACCUMULATION VIEW)
From a bullish structural perspective, Bitcoin remains in a broader uptrend continuation framework, as higher timeframe market structure still reflects a sequence of higher lows and higher highs.
The defense of the $70,000 demand zone is particularly significant. This level is not just technical support — it represents a high-conviction institutional accumulation area, where large participants historically scale into positions during volatility.
Additionally, the nature of the recent upward move suggests aggressive liquidity absorption on the buy side. Instead of multiple rejections or prolonged consolidation, price has moved in a relatively clean and impulsive manner, which typically indicates that sell-side liquidity is being absorbed efficiently rather than overpowering demand.
Above current levels, the $75,000 to $78,000 zone becomes a major liquidity magnet. This region contains:
breakout trader stop orders
short liquidation clusters
sidelined institutional capital waiting for confirmation
In liquidity-driven markets, these zones often act as attractors rather than resistance, meaning price naturally gravitates toward them when momentum aligns with structure.
🔴 BEAR CASE (LIQUIDITY TRAP RISK MODEL)
From the bearish perspective, the primary concern is the speed and efficiency of the upward move, which has created a structural imbalance.
When price expands rapidly without sufficient retesting or consolidation, it often signals a liquidity sweep rather than a sustainable breakout. In such cases, early momentum is used to attract late long positions before a reversal phase begins.
Another key concern is the lack of a proper retest of the $70,000 breakout zone. In classical market structure, retests serve as confirmation of acceptance above a level. Without this validation, the breakout remains statistically weaker and more vulnerable to failure.
Additionally, the $75,000–$76,000 region carries strong psychological weight. Historically, such zones attract profit-taking from early buyers while simultaneously triggering short entries from reversal traders. If price enters this region without strong continuation volume, the probability of rejection increases significantly.
⚔️ DEEP MARKET TRUTH (INSTITUTIONAL VIEW)
When both bullish and bearish structures are analyzed together, the most accurate interpretation is that Bitcoin is currently inside a liquidity engineering phase, not a directional trend phase.
This means the market is actively balancing two opposing forces:
continuation pressure from accumulation
reversal pressure from distribution risk
The purpose of this phase is not to move cleanly in one direction, but to force mispositioning on both sides before expansion.
Such equilibrium phases do not last long. They typically resolve through a liquidity expansion event, either above $75,000 or below $72,000.
🧲 LIQUIDITY STRUCTURE INSIGHT (ADDITIONAL LAYER)
Liquidity is currently asymmetrically distributed:
Above price: liquidity is visible and concentrated, meaning upside moves can accelerate rapidly once triggered
Below price: liquidity is deeper and more layered, meaning downside moves may be slower but structurally more destructive if activated
This imbalance increases the probability of sharp liquidity grabs in both directions, depending on which side is targeted first by large players.
Ultimately, the next major move will not be driven by sentiment or news flow — but by which liquidity pool gets consumed first.
🧠 SMART MONEY STRATEGY (REFINED POSITIONING MODEL)
Professional market participants are not currently committed to directional bias. Instead, they operate in a probabilistic framework, positioning on both sides of key liquidity zones.
This means:
Long exposure is favored near demand zones ($70K–$72K region)
Short exposure is favored near resistance liquidity zones ($75K–$78K region)
The most important principle in this environment is patience. Mid-zone trading exposes participants to manipulation risk and false breakouts.
Optimal execution exists only at liquidity extremes, not in the middle of the range.
🎯 FINAL INSTITUTIONAL CONCLUSION
Bitcoin is currently in a critical liquidity transition phase, where short-term direction is being determined by institutional order flow rather than retail sentiment or simple technical analysis.
The broader structure remains mildly bullish on higher timeframes, but short-term behavior reflects liquidity manipulation dynamics near major resistance zones.
The single most important level in the current structure is:
🟡 $75,000 — FINAL LIQUIDITY DECISION ZONE
A clean breakout and acceptance above $75K confirms expansion toward higher liquidity targets
A rejection from this zone increases probability of a sweep back toward $72K and deeper liquidity clusters
Until this level is resolved, Bitcoin remains in a high-volatility equilibrium state, where both bullish continuation and bearish reversal scenarios remain equally valid.
🧠 CURRENT MARKET ENVIRONMENT
At this stage, Bitcoin is no longer simply moving within a traditional technical trend structure. Instead, it is operating inside a highly engineered liquidity environment, where price action is increasingly driven by positioning imbalances, stop-loss clusters, and institutional order flow rather than organic spot demand alone.
The move from the $70,000 region toward $74,450 has created a critical transitional zone where both bulls and bears are being forced into uncertainty. This is a classic phase seen before major expansion legs — where volatility compresses and then expands violently once liquidity is fully engineered.
Importantly, price is no longer responding purely to visible support and resistance levels. Instead, it is reacting to invisible liquidity layers — including liquidation zones, leveraged positioning, and algorithmic order clustering. In such environments, price movements often appear random to retail participants, but are highly structured from a liquidity execution perspective.
🔵 BULL CASE (INSTITUTIONAL ACCUMULATION VIEW)
From a bullish structural perspective, Bitcoin remains in a broader uptrend continuation framework, as higher timeframe market structure still reflects a sequence of higher lows and higher highs.
The defense of the $70,000 demand zone is particularly significant. This level is not just technical support — it represents a high-conviction institutional accumulation area, where large participants historically scale into positions during volatility.
Additionally, the nature of the recent upward move suggests aggressive liquidity absorption on the buy side. Instead of multiple rejections or prolonged consolidation, price has moved in a relatively clean and impulsive manner, which typically indicates that sell-side liquidity is being absorbed efficiently rather than overpowering demand.
Above current levels, the $75,000 to $78,000 zone becomes a major liquidity magnet. This region contains:
breakout trader stop orders
short liquidation clusters
sidelined institutional capital waiting for confirmation
In liquidity-driven markets, these zones often act as attractors rather than resistance, meaning price naturally gravitates toward them when momentum aligns with structure.
🔴 BEAR CASE (LIQUIDITY TRAP RISK MODEL)
From the bearish perspective, the primary concern is the speed and efficiency of the upward move, which has created a structural imbalance.
When price expands rapidly without sufficient retesting or consolidation, it often signals a liquidity sweep rather than a sustainable breakout. In such cases, early momentum is used to attract late long positions before a reversal phase begins.
Another key concern is the lack of a proper retest of the $70,000 breakout zone. In classical market structure, retests serve as confirmation of acceptance above a level. Without this validation, the breakout remains statistically weaker and more vulnerable to failure.
Additionally, the $75,000–$76,000 region carries strong psychological weight. Historically, such zones attract profit-taking from early buyers while simultaneously triggering short entries from reversal traders. If price enters this region without strong continuation volume, the probability of rejection increases significantly.
⚔️ DEEP MARKET TRUTH (INSTITUTIONAL VIEW)
When both bullish and bearish structures are analyzed together, the most accurate interpretation is that Bitcoin is currently inside a liquidity engineering phase, not a directional trend phase.
This means the market is actively balancing two opposing forces:
continuation pressure from accumulation
reversal pressure from distribution risk
The purpose of this phase is not to move cleanly in one direction, but to force mispositioning on both sides before expansion.
Such equilibrium phases do not last long. They typically resolve through a liquidity expansion event, either above $75,000 or below $72,000.
🧲 LIQUIDITY STRUCTURE INSIGHT (ADDITIONAL LAYER)
Liquidity is currently asymmetrically distributed:
Above price: liquidity is visible and concentrated, meaning upside moves can accelerate rapidly once triggered
Below price: liquidity is deeper and more layered, meaning downside moves may be slower but structurally more destructive if activated
This imbalance increases the probability of sharp liquidity grabs in both directions, depending on which side is targeted first by large players.
Ultimately, the next major move will not be driven by sentiment or news flow — but by which liquidity pool gets consumed first.
🧠 SMART MONEY STRATEGY (REFINED POSITIONING MODEL)
Professional market participants are not currently committed to directional bias. Instead, they operate in a probabilistic framework, positioning on both sides of key liquidity zones.
This means:
Long exposure is favored near demand zones ($70K–$72K region)
Short exposure is favored near resistance liquidity zones ($75K–$78K region)
The most important principle in this environment is patience. Mid-zone trading exposes participants to manipulation risk and false breakouts.
Optimal execution exists only at liquidity extremes, not in the middle of the range.
🎯 FINAL INSTITUTIONAL CONCLUSION
Bitcoin is currently in a critical liquidity transition phase, where short-term direction is being determined by institutional order flow rather than retail sentiment or simple technical analysis.
The broader structure remains mildly bullish on higher timeframes, but short-term behavior reflects liquidity manipulation dynamics near major resistance zones.
The single most important level in the current structure is:
🟡 $75,000 — FINAL LIQUIDITY DECISION ZONE
A clean breakout and acceptance above $75K confirms expansion toward higher liquidity targets
A rejection from this zone increases probability of a sweep back toward $72K and deeper liquidity clusters
Until this level is resolved, Bitcoin remains in a high-volatility equilibrium state, where both bullish continuation and bearish reversal scenarios remain equally valid.