Trade
Basic
Futures
Futures
Hundreds of contracts settled in USDT or BTC
TradFi
Gold
Trade global traditional assets with USDT in one place
Options
Hot
Trade European-style vanilla options
Unified Account
Maximize your capital efficiency
Demo Trading
Futures Kickoff
Get prepared for your futures trading
Futures Events
Participate in events to win generous rewards
Demo Trading
Use virtual funds to experience risk-free trading
Earn
Launch
CandyDrop
Collect candies to earn airdrops
Launchpool
Quick staking, earn potential new tokens
HODLer Airdrop
Hold GT and get massive airdrops for free
Launchpad
Be early to the next big token project
Alpha Points
Trade on-chain assets and enjoy airdrop rewards!
Futures Points
Earn futures points and claim airdrop rewards
Investment
Simple Earn
Earn interests with idle tokens
Auto-Invest
Auto-invest on a regular basis
Dual Investment
Buy low and sell high to take profits from price fluctuations
Soft Staking
Earn rewards with flexible staking
Crypto Loan
0 Fees
Pledge one crypto to borrow another
Lending Center
One-stop lending hub
VIP Wealth Hub
Customized wealth management empowers your assets growth
Private Wealth Management
Customized asset management to grow your digital assets
Quant Fund
Top asset management team helps you profit without hassle
Staking
Stake cryptos to earn in PoS products
Smart Leverage
New
No forced liquidation before maturity, worry-free leveraged gains
GUSD Minting
Use USDT/USDC to mint GUSD for treasury-level yields
More
# 培训
901
NoMore
#培训
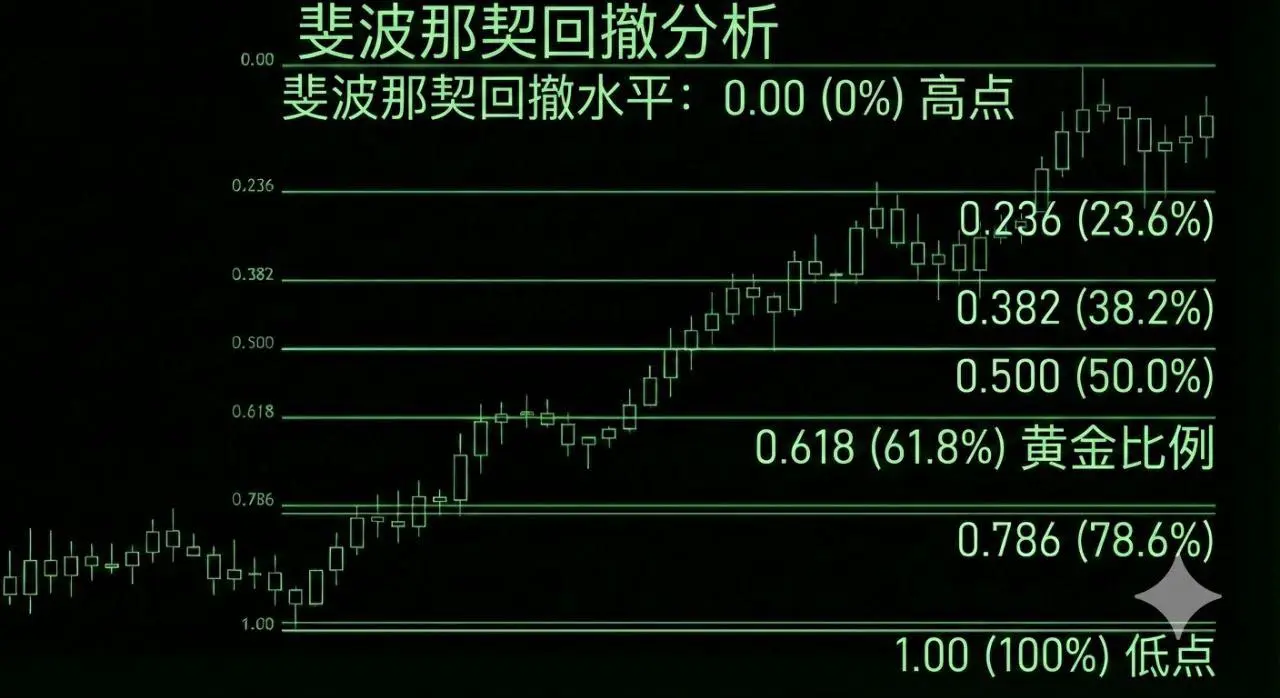
Fibonacci Levels and How to Use Them
Drawing Fibonacci levels on a price chart follows these rules: each level represents a portion of the previous complete move. Therefore, when marking levels, you need to:
- Identify a complete trend (or a wave before a correction within the trend) on the chart.
- Calculate the difference between the highest and lowest prices of that move.
- Determine the specific level values.
- Using a selected extreme point as the starting point, draw the level on the chart.
Since Fibonacci retracements are symmetrical, choosing the highest or lowest point of the ran
View OriginalFibonacci Levels and How to Use Them
Drawing Fibonacci levels on a price chart follows these rules: each level represents a portion of the previous complete move. Therefore, when marking levels, you need to:
- Identify a complete trend (or a wave before a correction within the trend) on the chart.
- Calculate the difference between the highest and lowest prices of that move.
- Determine the specific level values.
- Using a selected extreme point as the starting point, draw the level on the chart.
Since Fibonacci retracements are symmetrical, choosing the highest or lowest point of the ran
[The user has shared his/her trading data. Go to the App to view more.]
- Reward
- like
- Comment
- Repost
- Share
Load More
Join 40M users in our growing community
⚡️ Join 40M users in the crypto craze discussion
💬 Engage with your favorite top creators
👍 See what interests you
Trending Topics
42.47M Popularity
167.12K Popularity
148.39K Popularity
1.68M Popularity
531.84K Popularity
16.16K Popularity
15.53K Popularity
28.48K Popularity
10.45K Popularity
376.25K Popularity
50.93K Popularity
196.68K Popularity
21.5K Popularity
76.88K Popularity
15.33K Popularity
News
View MoreTraditional Finance Drop Alert: XTIUSD Falls Over 2%
18 m
U.S. Federal Funds Futures December Contract Falls by 3 Basis Points
19 m
U.S. stock index futures open lower, Nasdaq and Dow Jones drop over 1%
32 m
Traditional Finance Alert: AUDJPY rises over 0.5%
1 h
The US Dollar Index (DXY) rose above 98, with an intraday increase of 0.34%.
1 h
Pin