


[Where is the bottom: 57,000 or 54,000? Multiple support levels are about to see a major rebound]
After the four-hour divergence appeared, Bitcoin has not been able to organize an effective rebound, instead moving sideways with a horizontal trend. This is the most frustrating situation—no rise when it should, and after exhausting rebound momentum, it can only continue downward to seek support!
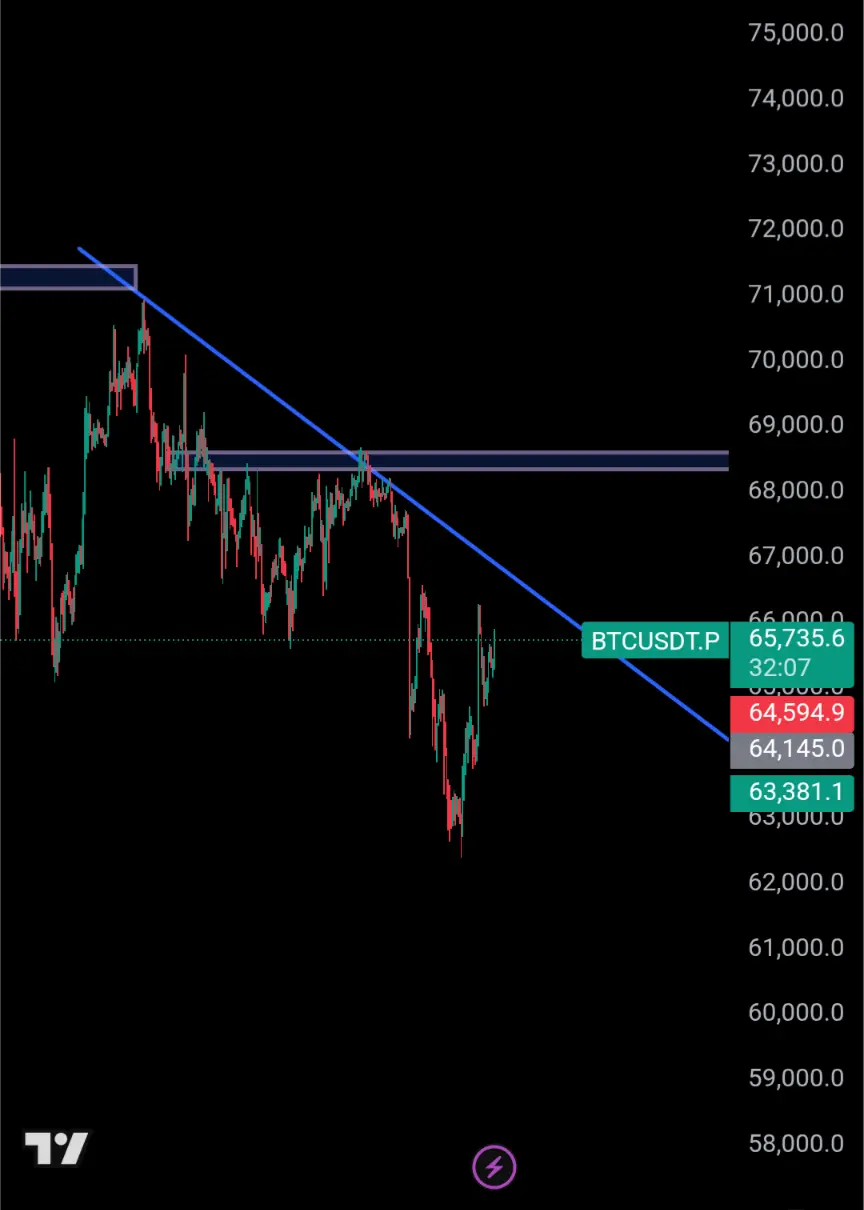
Currently, after Bitcoin briefly dipped below the previous small low, a minor divergence appeared. Therefore, the small support at 62,500 can serve as a clear defensive position (stop-loss below 61,600). The market will rely on this level for a rebound. Pay close attention to the 8 o'clock daily close; if it can recover above 65,000, the rebound will continue. The first resistance level is around 70,000.
If not, then after weak consolidation, a new low is highly probable! At that point, we need to observe whether a quick dip to a new low results in a secondary daily divergence, which could be a trading opportunity. If it’s a decline with bearish momentum, then we will need to wait further.
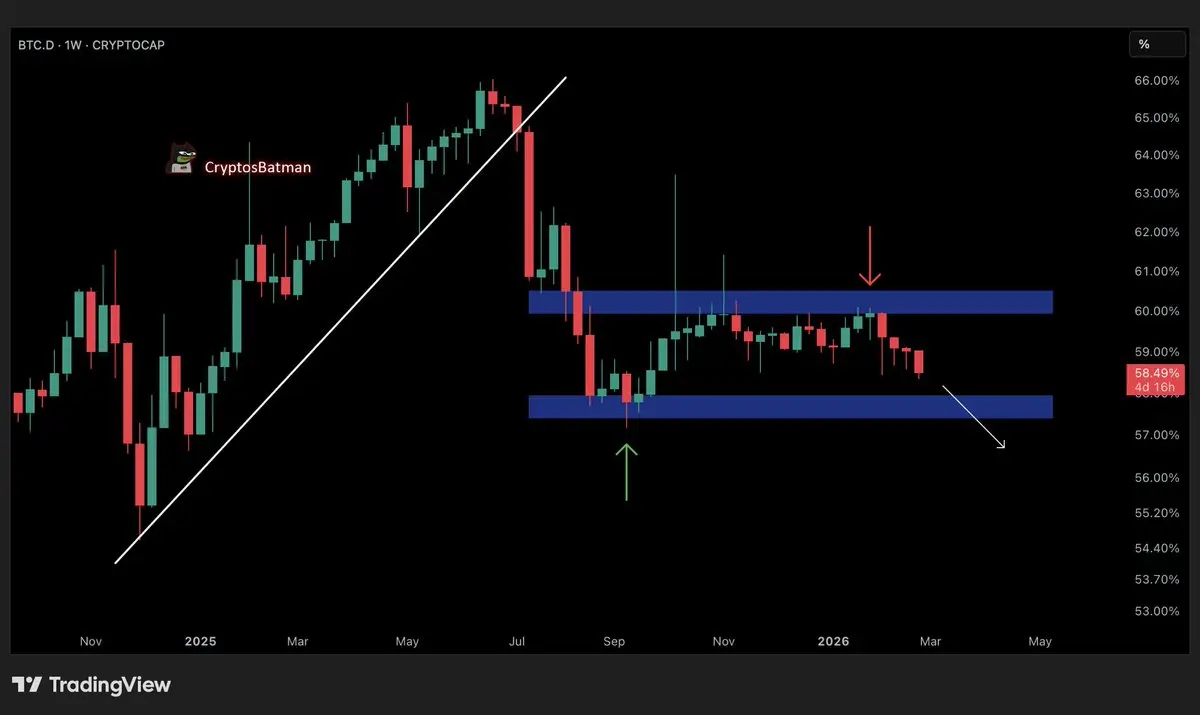
In terms of levels, the 57,000-58,000 range and around 54,000 are potential support zones, especially 54,000. This level is where multiple supports converge: the Fibonacci 0.236 level of the 25-year bullish candle body, the 7-day moving average, and the lower boundary of the upward channel since the last bear market low of 15,476. A major rebound is expected here, making it a key area to watch!
After the four-hour divergence appeared, Bitcoin has not been able to organize an effective rebound, instead moving sideways with a horizontal trend. This is the most frustrating situation—no rise when it should, and after exhausting rebound momentum, it can only continue downward to seek support!
Currently, after Bitcoin briefly dipped below the previous small low, a minor divergence appeared. Therefore, the small support at 62,500 can serve as a clear defensive position (stop-loss below 61,600). The market will rely on this level for a rebound. Pay close attention to the 8 o'clock daily close; if it can recover above 65,000, the rebound will continue. The first resistance level is around 70,000.
If not, then after weak consolidation, a new low is highly probable! At that point, we need to observe whether a quick dip to a new low results in a secondary daily divergence, which could be a trading opportunity. If it’s a decline with bearish momentum, then we will need to wait further.
In terms of levels, the 57,000-58,000 range and around 54,000 are potential support zones, especially 54,000. This level is where multiple supports converge: the Fibonacci 0.236 level of the 25-year bullish candle body, the 7-day moving average, and the lower boundary of the upward channel since the last bear market low of 15,476. A major rebound is expected here, making it a key area to watch!