Decred (DCR) is signaling a breakout amid a weakening market
Decred (DCR) is maintaining an impressive breakout momentum, increasing by an additional 5% at the time of writing on Monday, marking its fifth consecutive rally. This upward trend occurs amid bullish efforts to challenge a key resistance zone in the market.
Notably, the limited circulating supply—stemming from continuous user staking and persistent treasury accumulation—is creating significant upward pressure on DCR’s price. From a technical perspective, Decred is at a critical juncture, as increasing buying pressure could determine the next direction of the trend.
Limited Supply Drives DCR Demand
On-chain data shows that 10.9 million DCR are currently staked, accounting for 67.4% of the total mined supply (16.2 million DCR) and locked for 142 days. Additionally, the treasury holds over 873,000 DCR, removing another 5.4% from the circulating supply and reducing actual market liquidity to approximately 4.40 million DCR. This scarcity of supply is significantly boosting demand, attracting increasing investor interest in this privacy-focused coin.
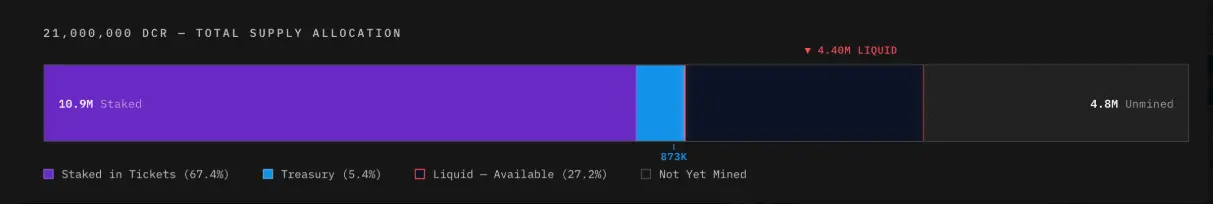 DCR Supply Distribution | Source: Decred.supply## Technical Outlook: Will Decred Continue Its Uptrend?
Decred has gained about 5% at the time of writing on Monday, breaking above the $25.00 level. The short-term recovery is currently challenging the 38.2% Fibonacci retracement at $26.13, calculated from the November 4 high of $70 down to the December 23 low of $14.21. This is a key resistance zone that has repeatedly halted upward attempts since late November, reflecting ongoing significant selling pressure.
If the price can convincingly close above the $26.13 level, the bullish trend may be reinforced, opening the door toward higher Fibonacci retracement levels at $31.54 (50%) and $38.07 (61.8%).
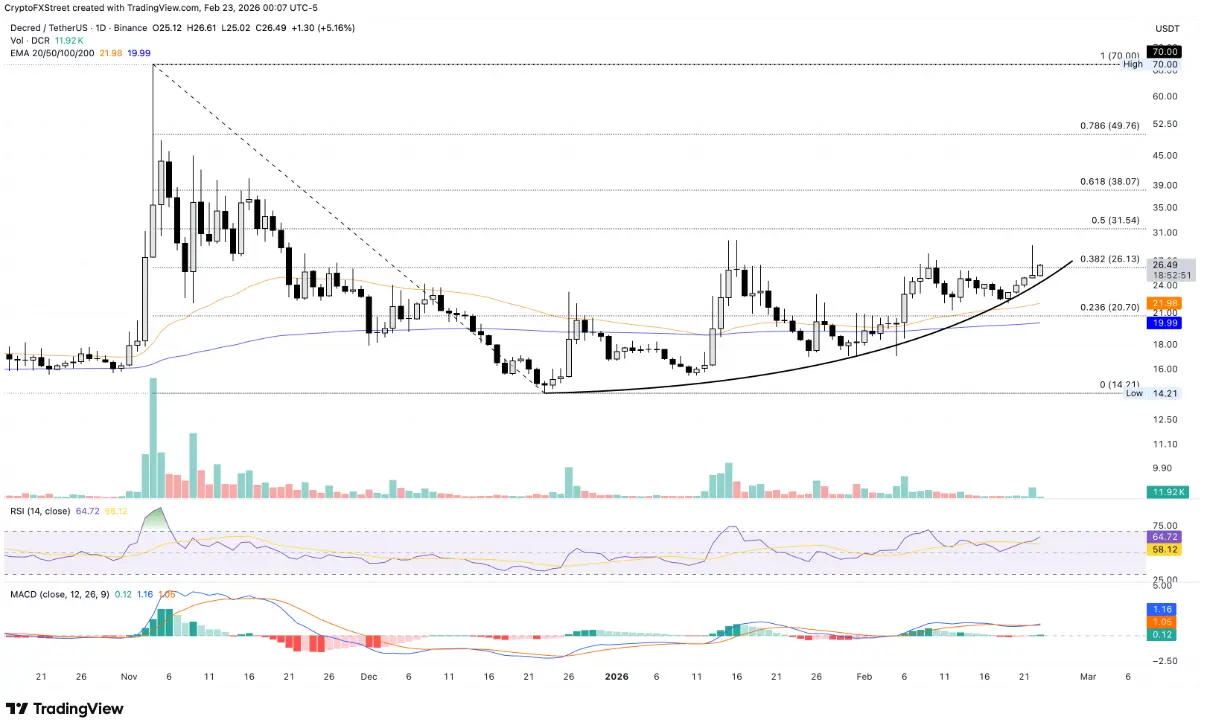 Daily DCR/USDT Chart (Logarithmic) | Source: TradingView In terms of momentum, the Relative Strength Index (RSI) on the daily timeframe is around 63 and continues to rise, indicating increasing buying strength and a sustained recovery from the neutral zone. More importantly, the RSI still has room to grow before entering overbought territory, supporting the scenario of continued price advancement. Additionally, the MACD line has crossed above the signal line, signaling positive momentum and the potential formation of a new bullish impulse.
Conversely, if the price fails to break above and reverses from the $26.13 zone, a correction scenario could unfold, with Decred retreating to test the 50-day Exponential Moving Average (EMA) around $21.96.
Related Articles
PIPPIN Surges Past $0.76 — $0.8472 Break or Pullback to $0.6715 Next?
PEPE Holds $0.053796 Support After 12% Drop Amid $580M Trading Spike
VIRTUAL Surges 23% After Channel Break — Can $0.7168 Turn Support?
Breakout Pushes $0.09656 DOGE Above Converging Trendlines as Price Trades Between Key Levels
HBAR Consolidates at $0.095 as Critical $0.094–$0.096 Zone Draws Focus