Bitcoin whale buys an additional 200,000 BTC in one month — but short-term demand weakens
Bitcoin’s recent weakening is no longer solely explained by bad news or negative sentiment but increasingly reflects the impact of market structure: leverage, cost basis by holder groups, defensive behaviors, and reflexive supply–demand mechanisms. These factors can prolong a downtrend even when selling pressure has decreased in intensity.
According to data from CoinPhoton, BTC is still about 46% below the nearly $126,000 peak set in early October 2025, currently trading around $67,000. Such a deep correction not only results in nominal losses but also transforms the entire behavioral structure of market participants.
On-chain analysis from Glassnode shows this correction occurred following a “multi-step deleverage” pattern. The initial phase was a rapid fall toward the True Market Mean around $79,000—reflecting the average holding cost adjusted for liquidity. This was followed by a sideways absorption phase until the end of January. When this support zone was broken, the market shifted into an accelerated decline, pushing the price close to $60,000. Each stage was accompanied by a change in the dominant selling group.
Notably, the proportion of investors who bought within the last 3–6 months is in a negative equity position. In actual trading, these cost basis zones often form a “hanging supply ceiling.” When the price approaches the breakeven point, demand to exit positions surges to reduce risk, causing the rebound to be quickly broken. This mechanism gives the market a weak recovery impression and a lack of durability.
Data on cost basis ranges by UTXO age from CryptoQuant confirms that BTC prices are below the realized price of short-term holders. This indicates most new capital is in a loss. Not only is this an accounting figure, but it also reduces the market’s “pain tolerance”: short-term investors react faster, locking in losses or exiting positions immediately when a bounce occurs, rather than holding on.
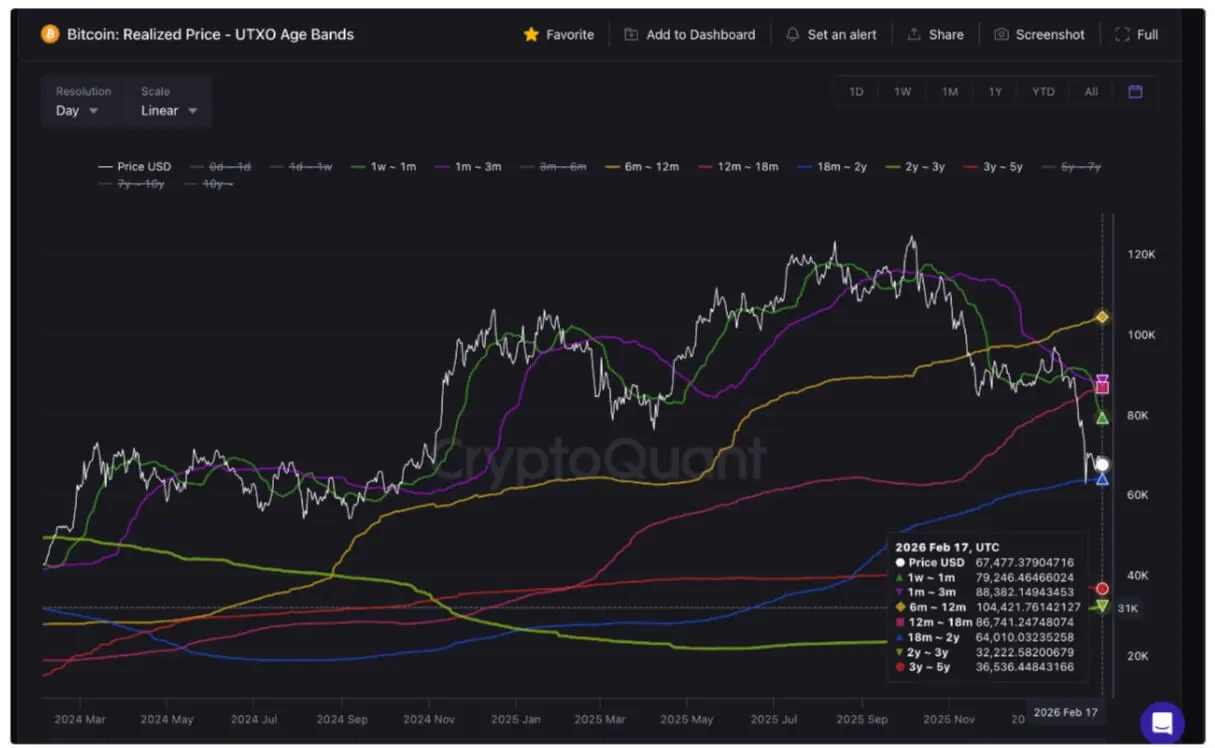 *Actual Bitcoin Price (Source: CryptoQuant)*At the same time, the SOPR indicator for long-term holders—measuring whether coins are spent at a profit or loss—has fallen below 1. This is a significant signal because holdings over 155 days are generally considered a stable supply layer. When long-term SOPR drops below 1, it implies some of the “aged” supply is being sold at a loss, reflecting financial pressure or portfolio reallocation. While not yet a broad capitulation signal, it indicates structural resilience is weakening.
Another behavioral signal is the increasing flow of BTC from long-term holders to Binance. Since Binance has high liquidity depth, large wallets often transfer coins there when ready to sell, hedge, or restructure positions. Increased deposits do not necessarily mean immediate selling but do increase the “put option” premium hanging over the market.
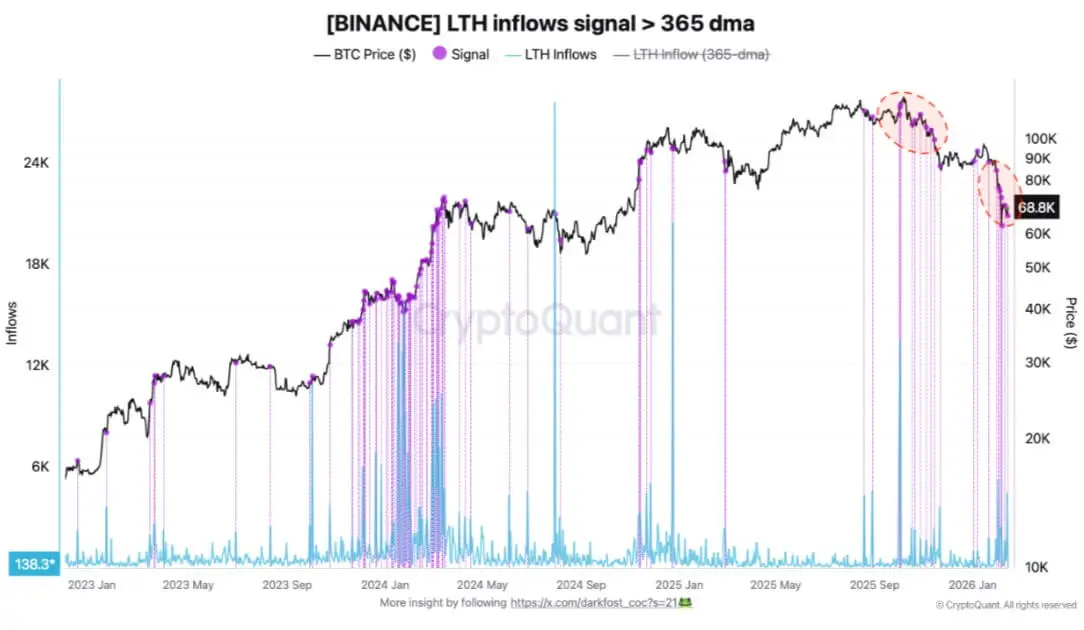 *Flow of Bitcoin from Long-term Holders to Binance (Source: CryptoQuant)*Conversely, institutional and whale buying activity still exists but is selective. Strategy—previously MicroStrategy—continues to add thousands of BTC, raising total reserves to over 717,000 BTC. This is spot buying, without leverage, helping absorb some supply. Additionally, data shows whale-held BTC has increased by about 200,000 coins in a month, similar to accumulation phases before past strong rebounds.
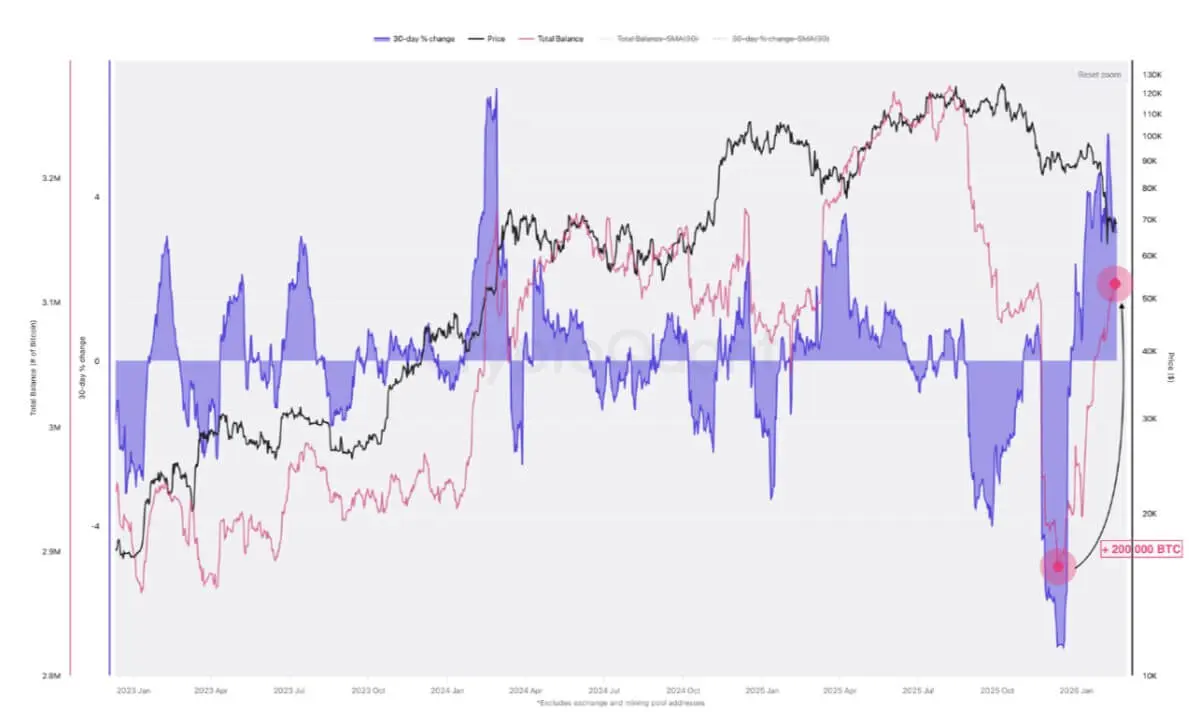 *Whale Accumulation of Bitcoin (Source: CryptoQuant)*However, data from Alphractal indicates that short-term holder accumulation momentum is declining rapidly. Although the 90-day net position remains positive, the growth rate has slowed significantly. History shows that when the most “top-timing” group reduces participation, the market often enters a consolidation phase, prolonged accumulation, or trend transition.
Combining these signals, the current structure can be described as follows: above is a thick resistance layer from short-term holder cost basis and hanging supply; below is the market’s structural cost zone. A stable scenario is only reinforced if the price breaks above and sustains above the short-term cost basis, weakening the selling motivation during rebounds. Conversely, if the price continues to be rejected at these levels while long-term holder stress indicators worsen, downward pressure may amplify and extend the correction cycle.
Shach Sanh
Related Articles
Willy Woo Warns Liquidity Breakdown Could Cap Bitcoin’s Rally Despite Short-Term Relief
Data: If BTC breaks through $69,195, the total liquidation strength of long positions on mainstream CEXs will reach $1.521 billion.
Bitcoin treasury company EmperyDigital's third-largest shareholder requests to sell 3,723 BTC and return cash
SlovakBitcoin developer releases a proof-of-concept transaction embedding a 66kB image, challenging the BIP-110 data size limit proposal