Glassnode: Bitcoin enters a period of fluctuation and bottoming out, with $55,000 to $79,000 becoming a critical support level
Bitcoin remains defended within the $60,000 to $72,000 range, while sell pressure in the $82,000 to $97,000 zone is limiting rebounds. Capital outflows, subdued spot trading volume, and cooling futures all indicate insufficient demand, causing prices to react passively and struggle to break out actively.
Summary
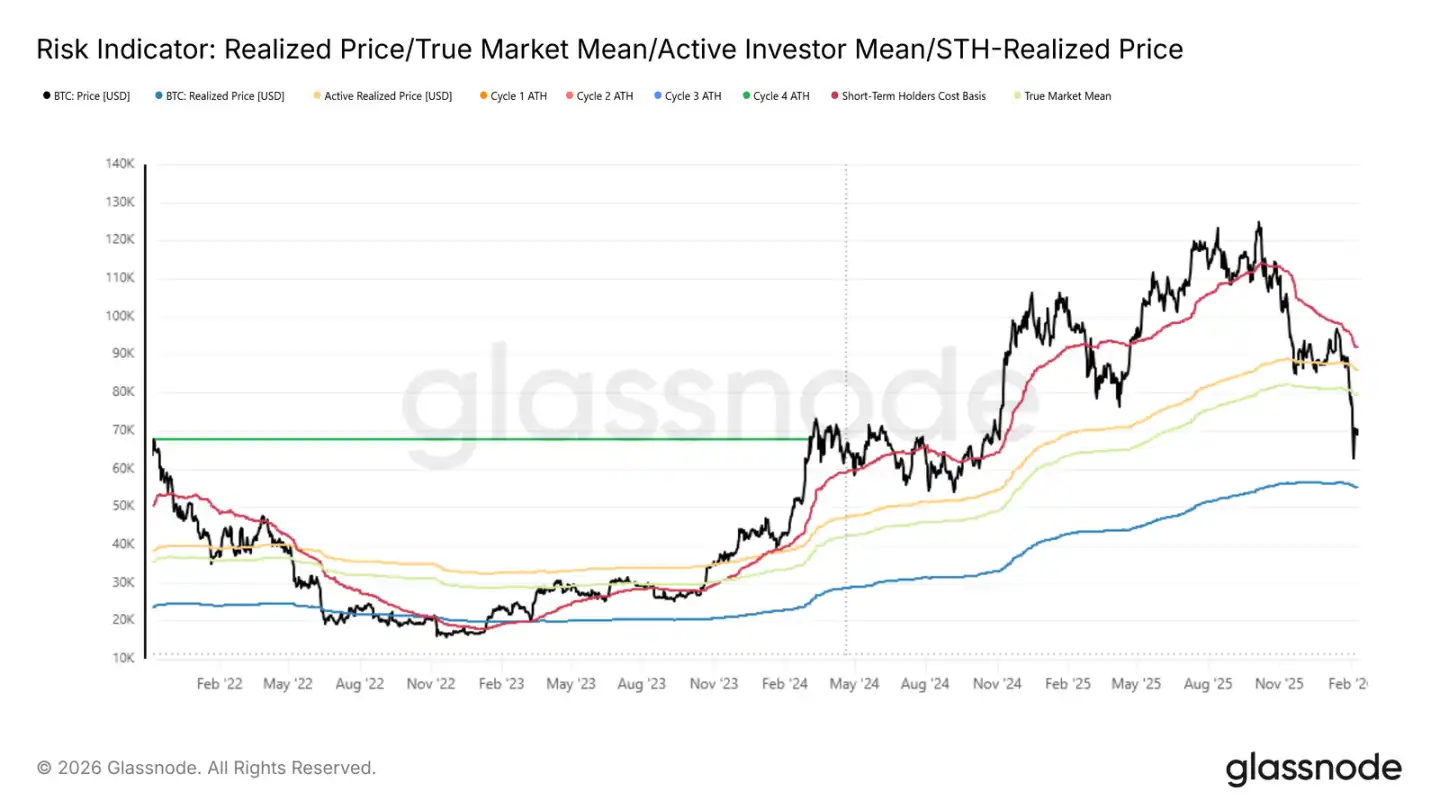
· Bitcoin is trapped between the true market mean (about $79,200) and the realized price (around $55,000). Since the structural weakening, the market has been on the defensive, with the $60,000 to $72,000 zone still absorbing sell orders.
· Large positions are accumulated in the $82,000 to $97,000 and $100,000 to $117,000 ranges, both currently at unrealized losses. Rebound to these levels will face significant resistance.
· Short-term holders are generally at a loss; new entrants lack confidence, making sustained upward momentum unlikely.
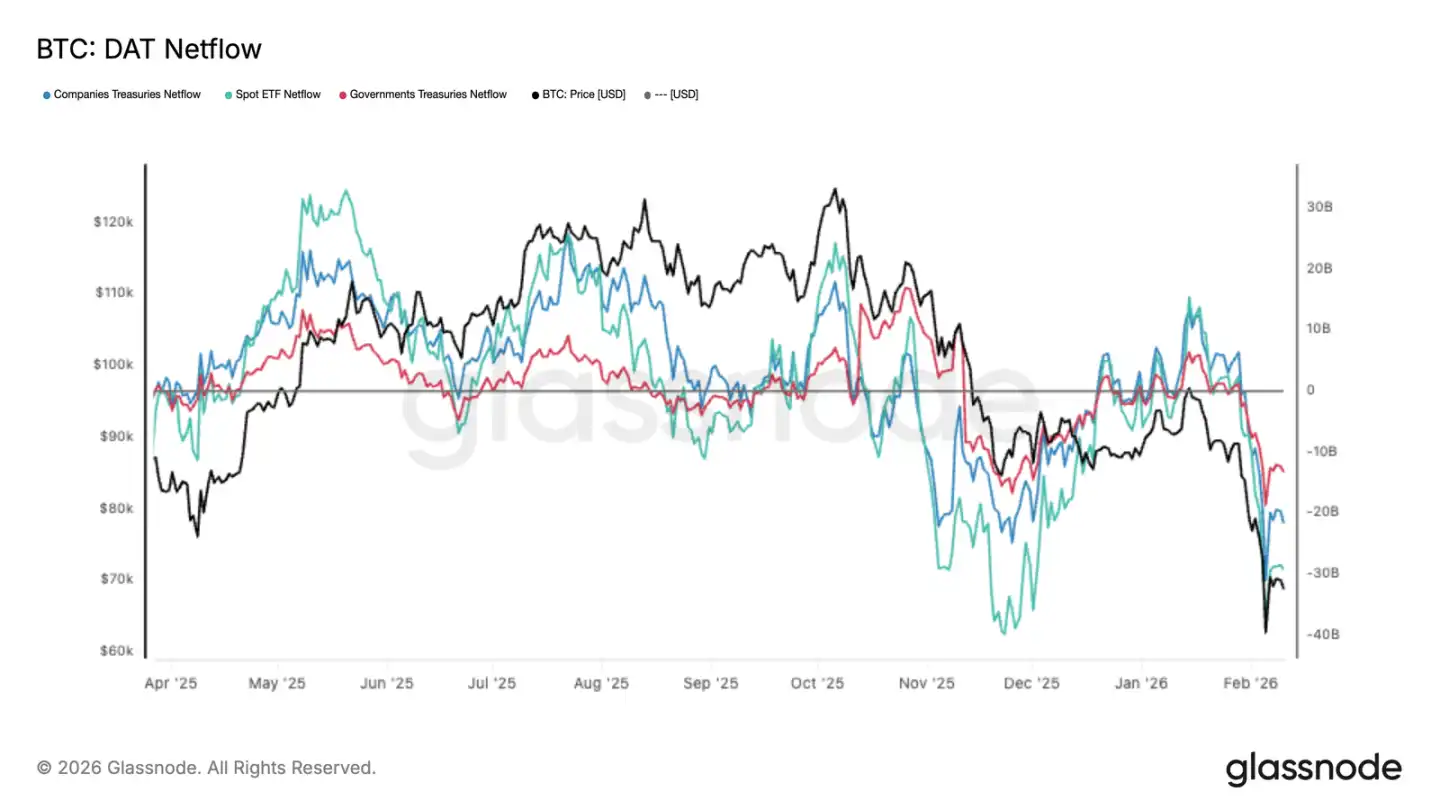
· Digital asset holdings across various institutions are simultaneously net outflows, not isolated behavior but a broad risk reduction across the market, with insufficient spot support.
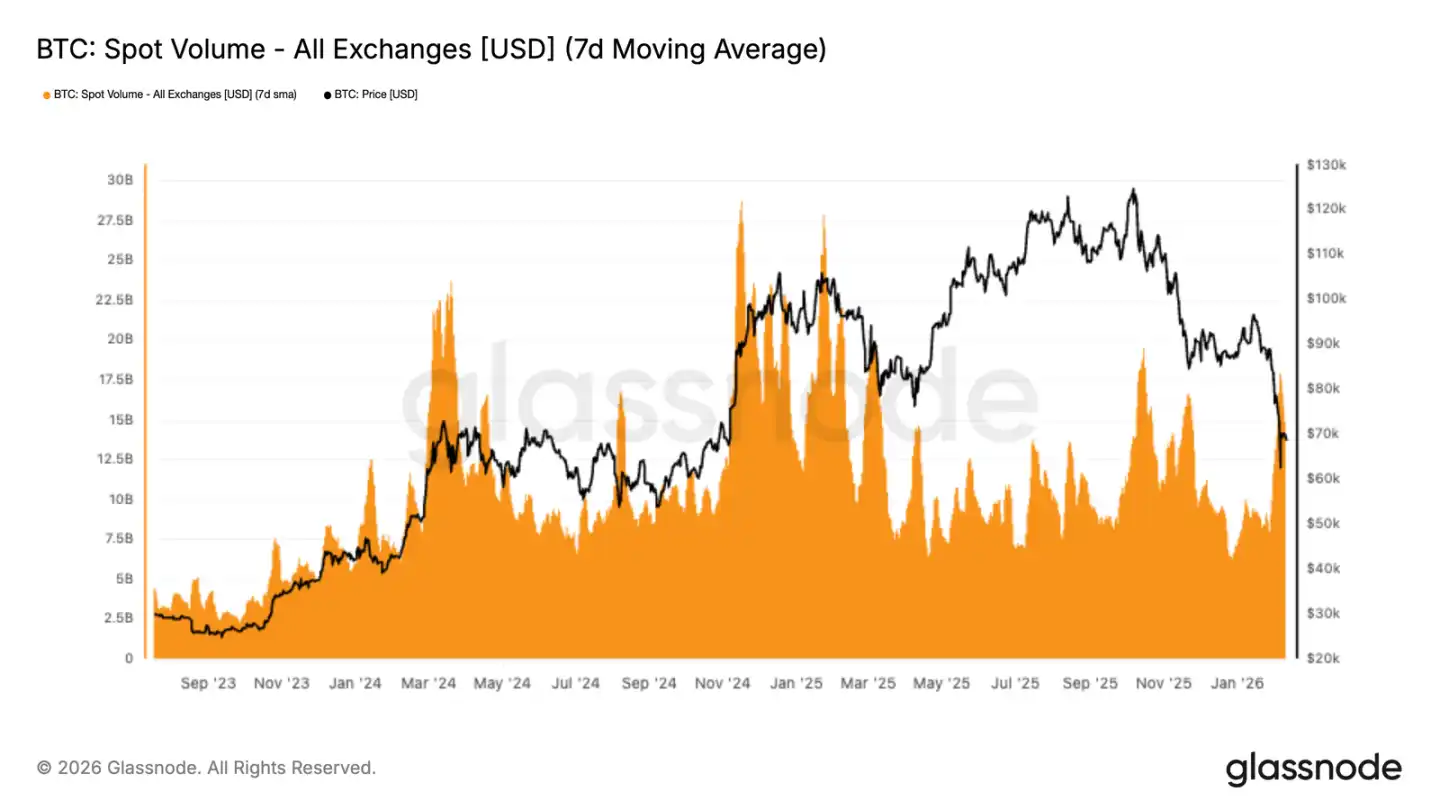
· Spot trading volume only spiked during downward moves, then quickly declined, indicating passive responses rather than active bottom-fishing.
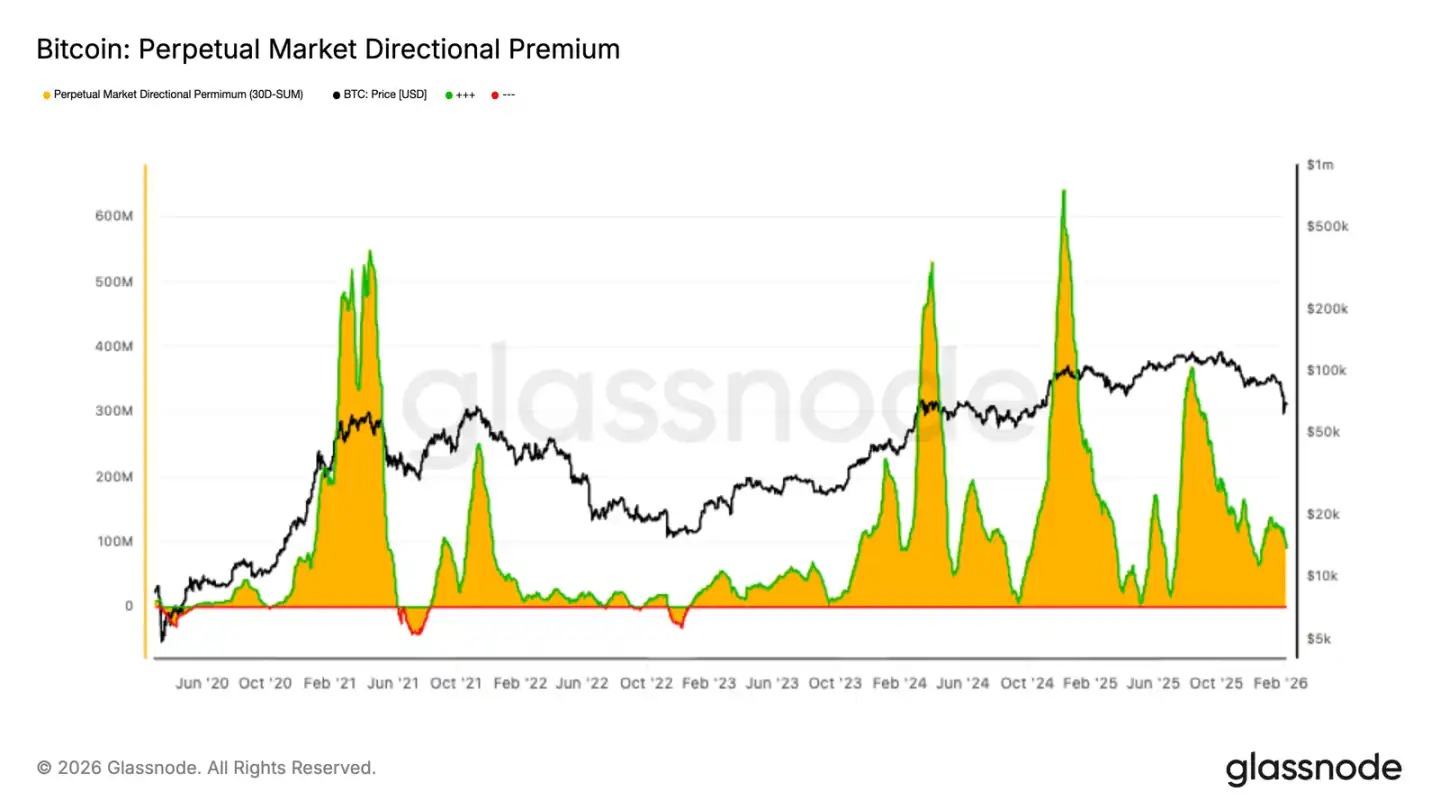
· Perpetual contract premiums have cooled, narrowing back to neutral levels, signaling that leverage traders are pulling back and speculative sentiment has eased.
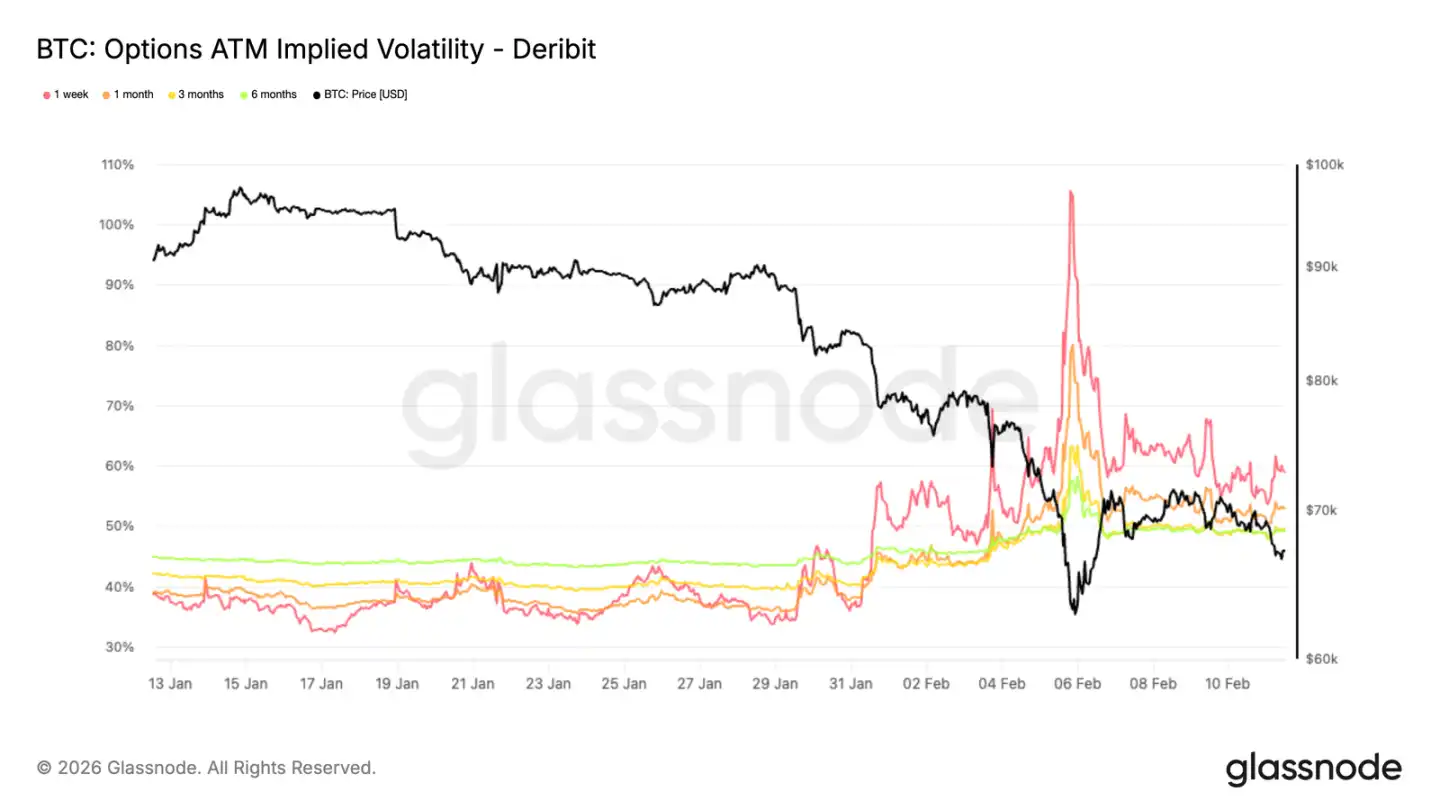
· Implied volatility shows the market is still buying protection, reflecting a defensive stance.
· The options market’s position structure also favors price swings within a limited range, with liquidity remaining tight.
On-Chain Insights
Since reaching a new high last October, Bitcoin has gone through three phases: a sharp decline testing the true market mean; sideways consolidation until late January; and recently, a third phase—breaking below the true mean and accelerating toward $60,000.
New Trading Range
The third phase’s upper boundary is the true market mean at $79,200, and the lower boundary is the realized price at $55,000, resembling the structure seen in the first half of 2022.
Like Q2 2022, prices are likely to oscillate within this range, requiring time to grind, as new buyers gradually enter and accumulate.
To break this pattern in the short term, either a strong recovery—recapturing the true mean at $79,200 and regaining strength—or a severe event—similar to LUNA or FTX—breaking below $55,000, would be needed. Absent these extremes, the most probable path is continued range-bound consolidation.
Range Support
So far, the $60,000 to $72,000 zone continues to absorb selling pressure. This range was a dense trading zone in the first half of 2024, and holding it again indicates active support.
Ideally, sustained buying and accumulation here would lay a solid foundation for the next rally.
However, this depends on buyer conviction. How much real capital buyers are willing to deploy in this range determines whether the market stabilizes or breaks downward.
Selling Pressure
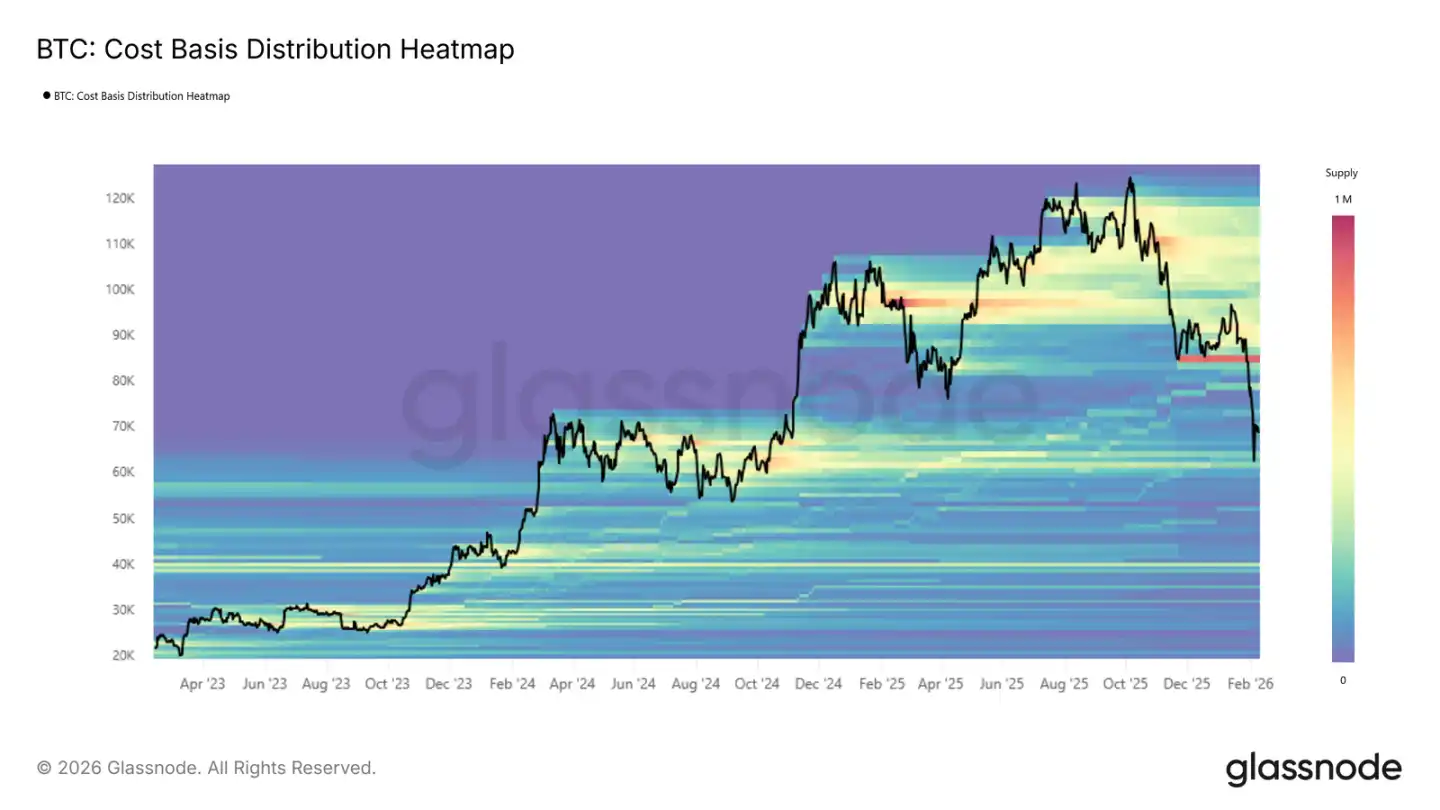
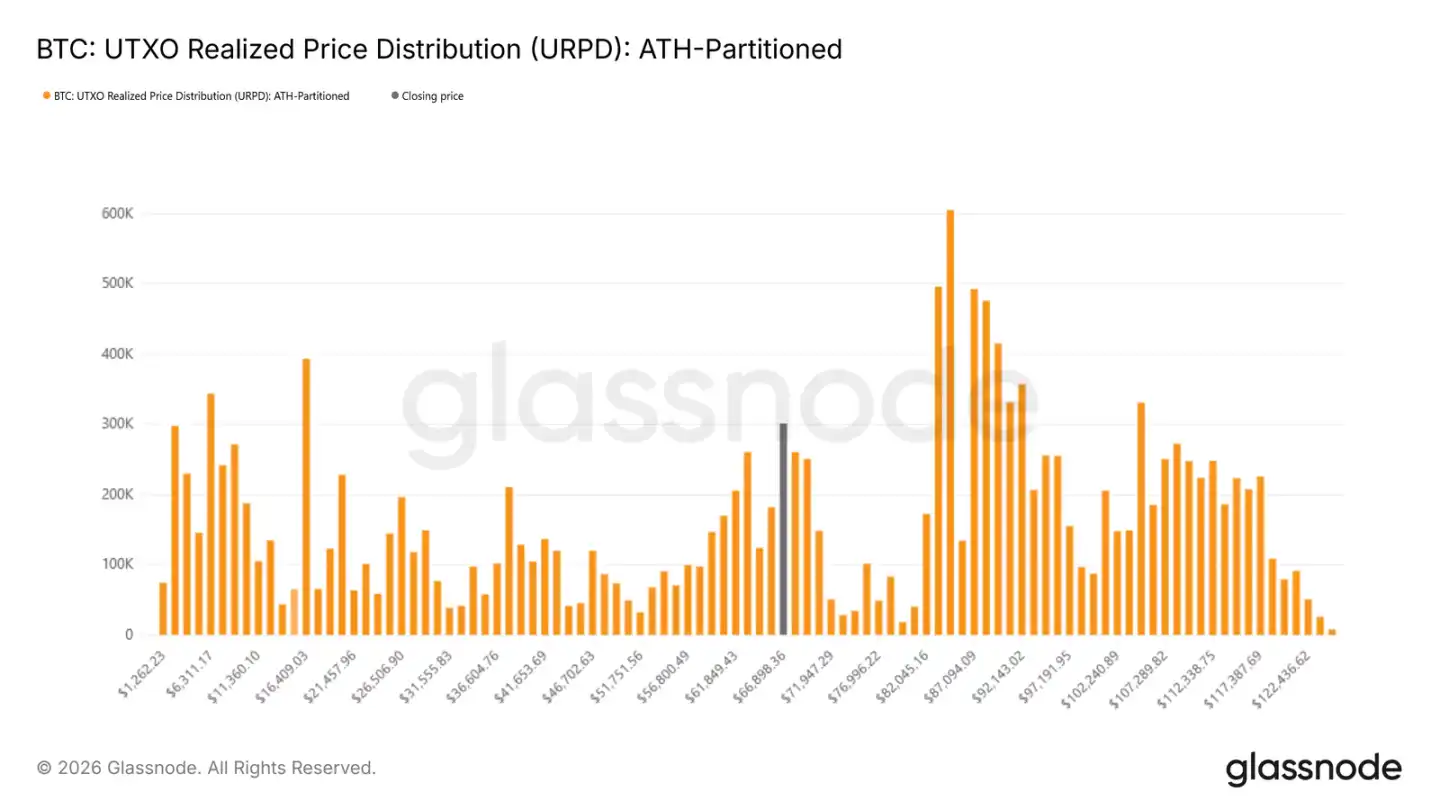
The strength of support in the $60,000 to $72,000 range can be assessed via cost basis distribution. UTXO realized price distribution shows the concentration of coins at various prices. Currently, the dense zone formed in early 2024—$60,000 to $72,000—is holding, indicating buyers at that level are still holding.
But selling pressure remains heavy. Large trapped positions in the $82,000 to $97,000 and $100,000 to $117,000 ranges could become a problem if prices stay stagnant or decline further, potentially forcing these holders to sell, creating new sell pressure.
Where Is the Top of the Bear Market Rebound?
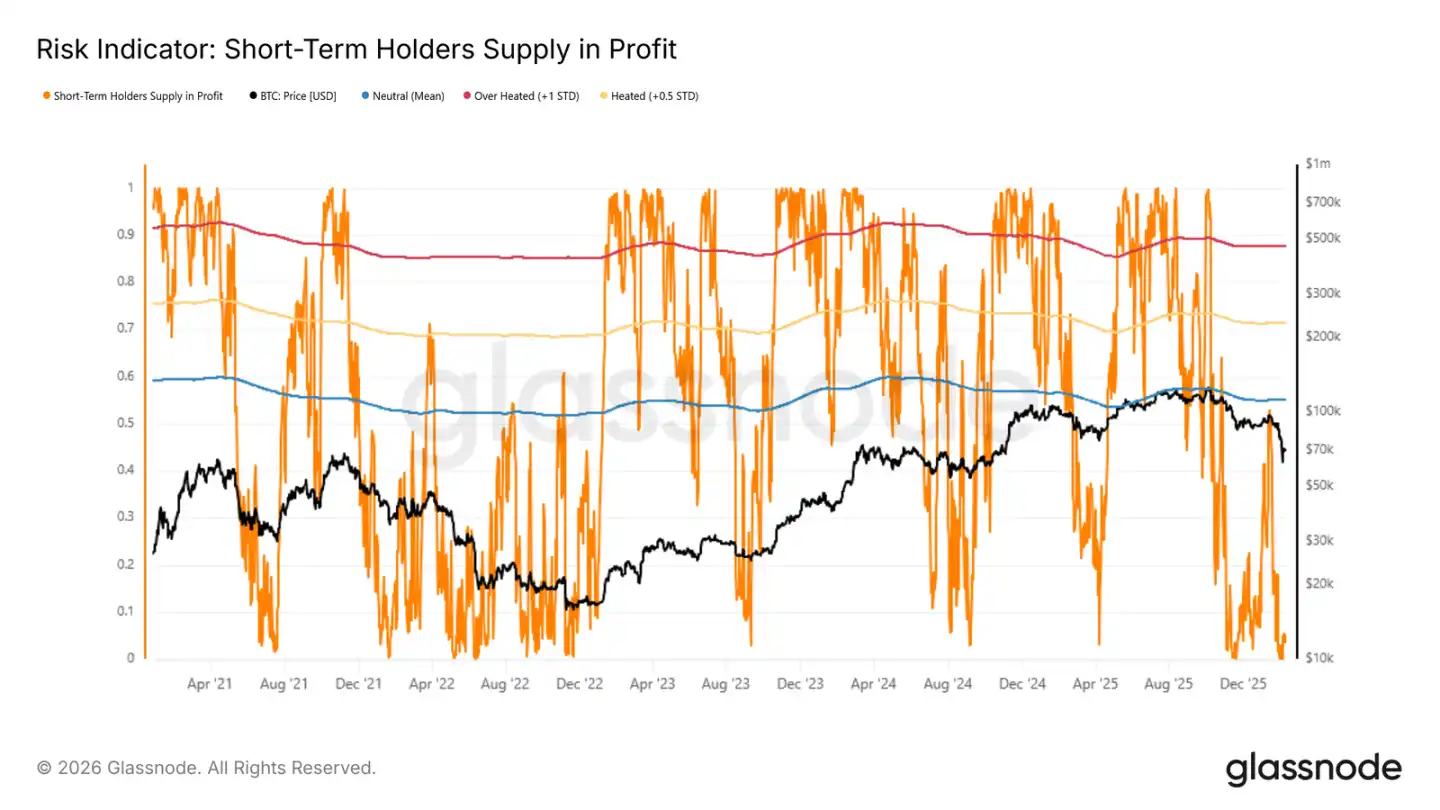
Since the market is likely to grind within the range, identifying local tops and bottoms is crucial. In bear markets, rebounds are often seen as exit points by recent buyers. When these traders realize profits, a local top may be near.
The short-term holder profit ratio indicator is useful here. Historically, when the rebound reaches the mean plus half a standard deviation of this indicator, upward momentum often stalls. Currently, this ratio is only 4.9%, meaning most recent entrants are still underwater. Few are in profit, making it hard to push the market higher, and indicating weak market strength with little new money entering.
Off-Chain Insights
Institutional Capital Is Withdrawing
Recent fund flows into digital assets have turned significantly negative, with ETFs, corporations, and governments all net outflows, pushing Bitcoin to new lows. ETFs are the main force, with corporate and government outflows also substantial. This isn’t a single entity adjusting positions but a broad contraction across institutions.
Large outflows mean spot buying cannot keep up. It’s not a rotation among different funds but a general reduction of exposure. Unless these outflows stabilize, selling pressure will persist, and the extent of decline depends on when buyers step in.
Spot Trading Volume Is Low
When Bitcoin dipped toward $70, spot volume spiked briefly, and the 7-day moving average rose. But this volume was a result of forced reactions, not active bottom-fishing. After the spike, volume quickly declined again, indicating buyers are hesitant or passive.
This shows buying support is insufficient to absorb selling. Current volume reflects panic reactions rather than stabilization, and without sustained buying, prices are vulnerable to further declines.
Futures Premium Has Receded
Perpetual contract premiums have returned to neutral levels, indicating that leverage traders are pulling back. When premiums are high, it signals strong directional consensus; now, with premiums compressed, market sentiment is uncertain.
The cooling of derivatives markets reflects overall risk aversion, with volatility-driven risk appetite declining. No one is opening new longs or shorts confidently; directional capital is thin. Derivatives no longer provide momentum signals; the market is now driven by spot price action. The key message: caution, no active trading.
Implied Volatility—Risk Pricing Has Changed
Post-drop, the volatility term structure has shifted noticeably. The 1-month at-the-money implied volatility has increased significantly, with 6-months up 5 points and 3-months up 9 points.
The front end saw the sharpest jump, with 1-week implied volatility soaring over 20 points. Implied volatility reflects market expectations of future volatility; such a large jump indicates a reassessment of risk across all maturities.
Although some decline has occurred, all tenors remain elevated, suggesting persistent uncertainty and that the market doesn’t believe the decline is over.
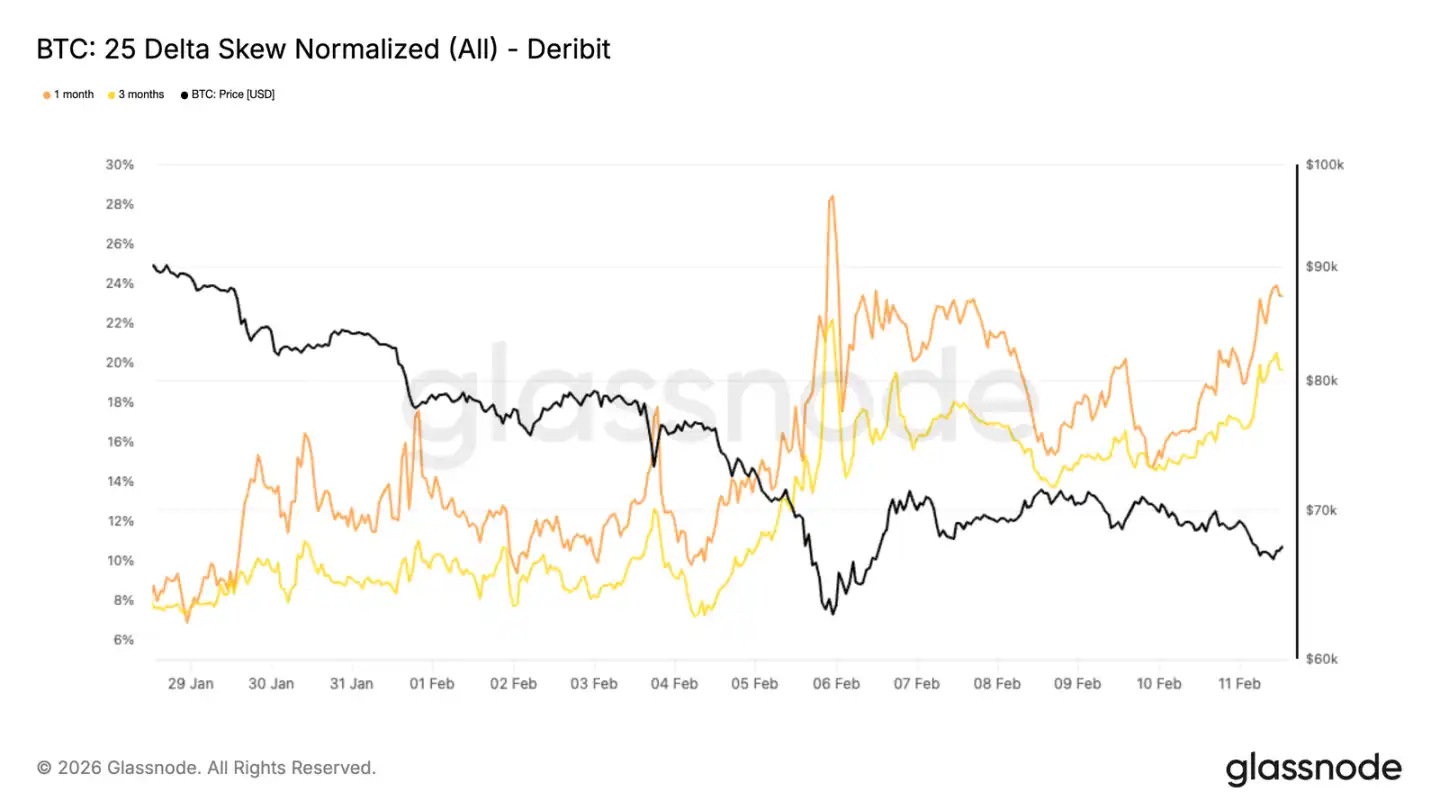
25 Delta Skew Indicates Persistent Downside Demand
Overall volatility has risen, but the flow of money depends on skew. The 25 delta skew for 1- and 3-month options plummeted during the recent dip, indicating heavy put buying.
Friday’s rebound saw put premiums remain high, roughly returning to the levels seen during the worst sell-off days. The 25 delta skew compares implied volatilities of out-of-the-money puts and calls; a negative skew means puts are more expensive, reflecting a market preference for protection. On January 28, the 1- and 3-month skew was around 8%, now it’s 23% and 19%.
The entire surface remains put-biased, and despite rebounds, fear persists.
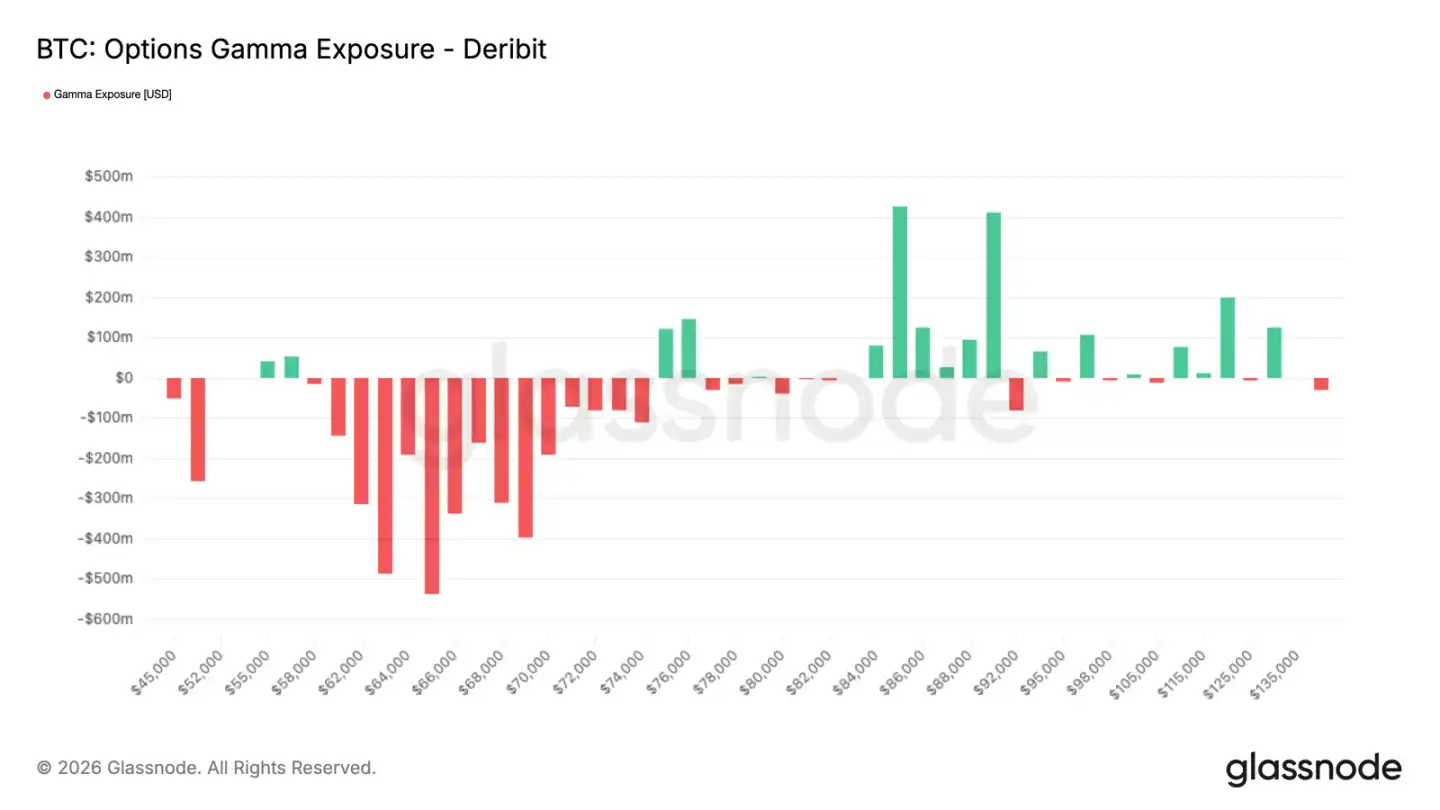
Market Maker Gamma—Price Rebounds
This defensive options flow leaves traces in market maker positions. When market makers are short gamma, rising prices force them to buy, and falling prices force them to sell, amplifying volatility.
The recent heavy put buying has kept market maker gamma structures skewed. Although prices rebounded for a few days, this didn’t alleviate the gamma sensitivity. As a result, the market remains fragile, with potential for accelerated moves in either direction, especially downward.
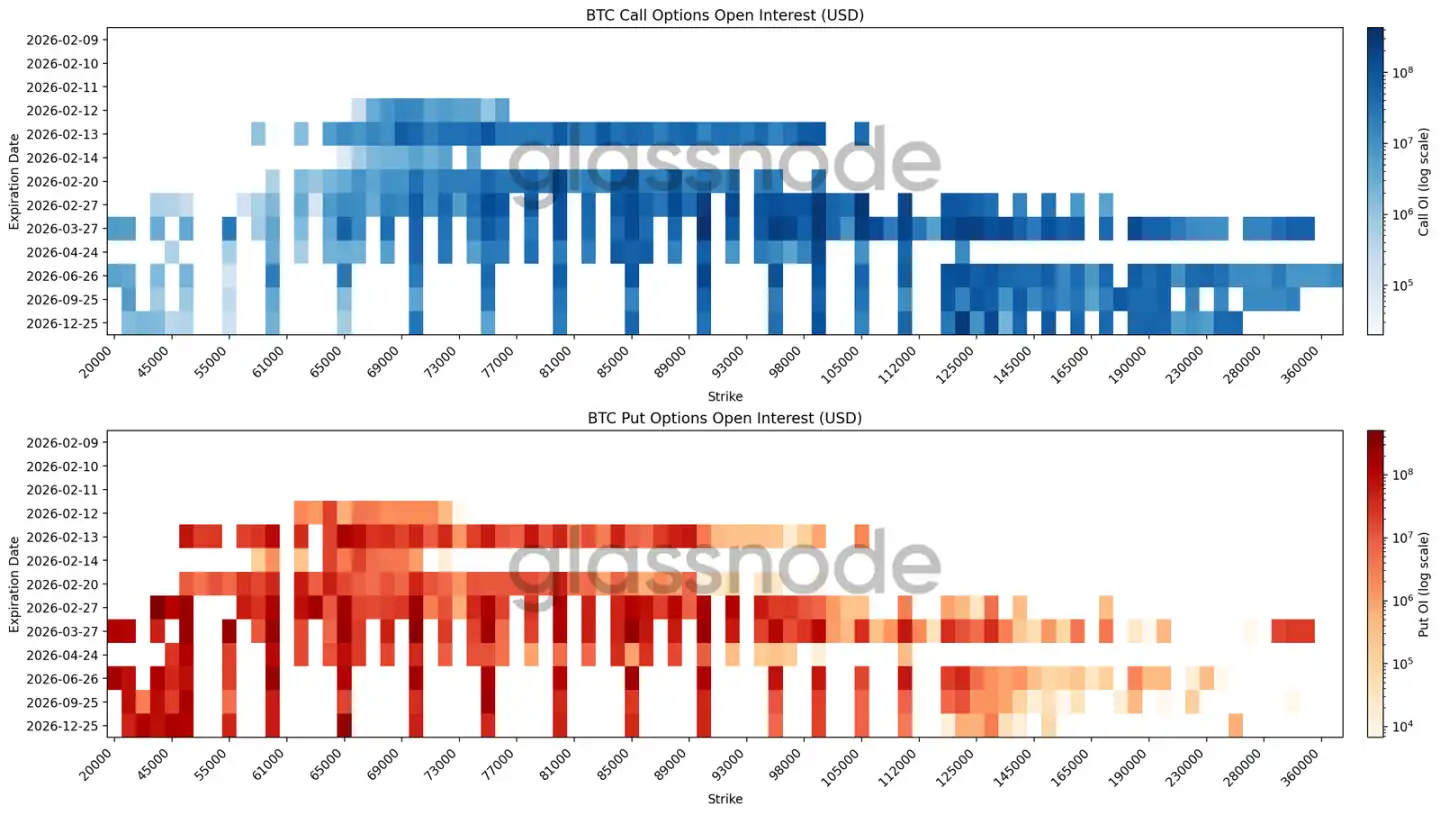
Open Interest Heatmap Shows Broad Hedging
The latest heatmap overlays open interest across strike prices and expirations, revealing where the money is concentrated and potential pressure points.
In February, the largest open interest is between $60,000 and $70,000. Longer-term, end-of-year and beyond, open interest is concentrated above $120,000 and below $30,000.
This isn’t a bet on a specific event but broad protection across multiple maturities. The call open interest is mainly above $120,000, while puts are heavily concentrated below $50,000, indicating a defensive posture with long-term downside hedging and short-term bullish positioning. The deep negative skew reflects this.
Overall, the position structure is defensive, not betting on a reversal.
Conclusion
Bitcoin remains in a defensive structure, with prices sandwiched between key cost levels, repeatedly testing support zones. The $60,000 to $72,000 range still sees sell orders, but overhead pressure is heavy, and short-term holders are mostly at a loss with weak confidence. In this environment, rebounds are easily suppressed, and sustained stabilization requires persistent buying.
Off-chain data confirms this cautious outlook. Institutions are withdrawing, spot volume is passive, and derivatives sentiment has cooled. The market’s structure remains fragile, with limited liquidity and a defensive stance.
To trigger a trend reversal, either spot support must strengthen significantly, or risk appetite must return. Until then, short-term positions dominate volatility, not a clear trend.