Bitcoin recovers the $70,000 mark; summarize the fragile logic behind the rebound that some analysts believe in
Bitcoin surged from below $60,000 to above $70,000 in less than 24 hours, a move exceeding 15%. However, the bearish protection positions in the derivatives market suggest this may not be the true bottom.
(Background: Bitcoin recovers to $70K! MicroStrategy MSTR pulls back 20%, crypto sector stocks all rebound)
(Additional context: JPMorgan: Crypto market sell-off nearing end, signs of Bitcoin bottoming out emerging)
Table of Contents
- Forced liquidations amid macro headwinds
- Cross-asset reversal triggers short squeeze
- Can $70,000 hold? Three key conditions
- On-chain data reveals critical support zone
Bitcoin skyrocketed from below $60,000 to above $70,000 in less than 24 hours, erasing the previous roughly 14% decline. Yet, the underlying mechanisms behind this rebound reveal deeper warning signs.
CryptoSlate analyst Gino Matos believes that the sharp 12% intraday rebound, recovering 17% from the low, appears to be a post-liquidation settling. Reuters reports that this bounce is more a result of cross-asset price stabilization and forced position rebalancing rather than large-scale spot buying.
Meanwhile, the derivatives market remains heavily skewed toward put protection positions, with pricing indicating that $70,000 may be just a transitional level rather than a genuine support bottom.
Forced Liquidations and Macro Headwinds
Looking back at the market movement on February 5: Bitcoin opened near $73,100, briefly surged, then declined throughout the day, closing at $62,600. CoinGlass data shows about $1 billion in leveraged long positions were forcibly liquidated that day.
This figure illustrates the chain reaction triggered by forced selling. More notably, CoinGlass data shows Bitcoin futures open interest had already decreased from about $61 billion to $49 billion the week prior, indicating the market was actively deleveraging before the final shock.
The trigger for this sell-off was not intrinsic to the crypto industry. Reuters highlights that a broad tech stock sell-off and volatile precious metals were primary drivers—silver once plunged 18% to around $72.21, dragging down all risk assets.
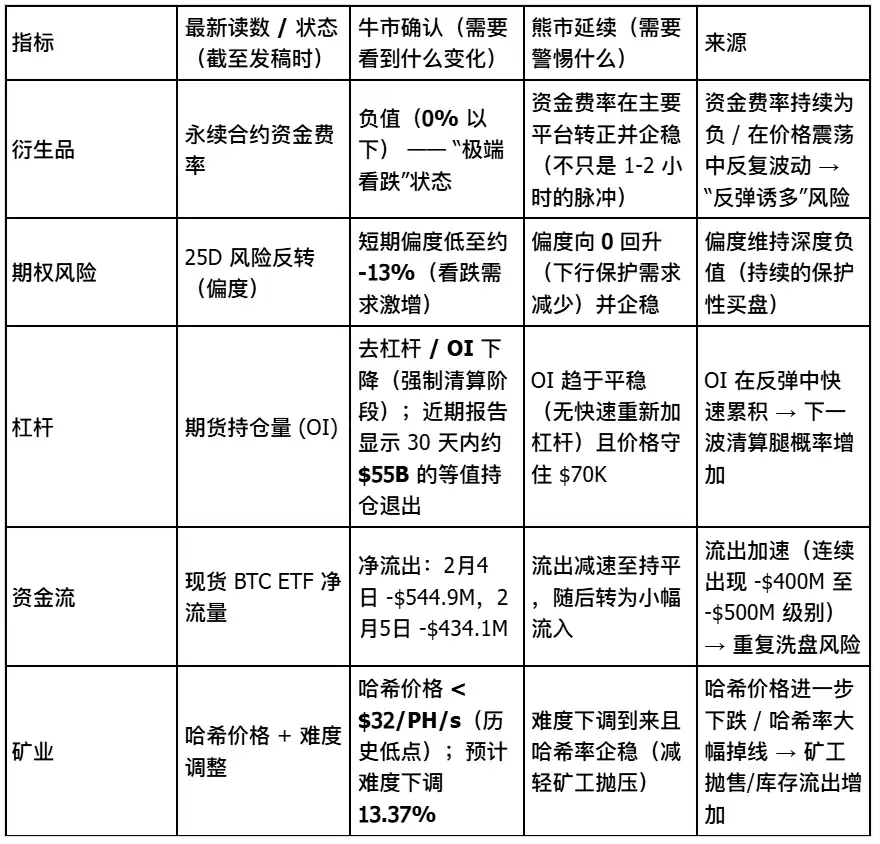
Deribit’s data further confirms this cross-market spillover effect. Market sentiment in derivatives has turned extremely bearish: funding rates are negative, implied volatility term structures are inverted, and 25-delta risk-reversal skew is depressed to about -13%, indicating extreme fear.
On the policy front, reports mention market reactions to President Donald Trump’s nomination of Kevin Warsh as Fed Chair—viewed by traders as a signal of potential further balance sheet reduction and tightening liquidity.
Additionally, data from TheMinerMag shows miners are under significant pressure, with hash price falling below $32 per PH/s. Network difficulty is expected to decrease by about 13.37% in two days. However, the report notes that this easing mechanism has not yet taken effect before prices break support levels.
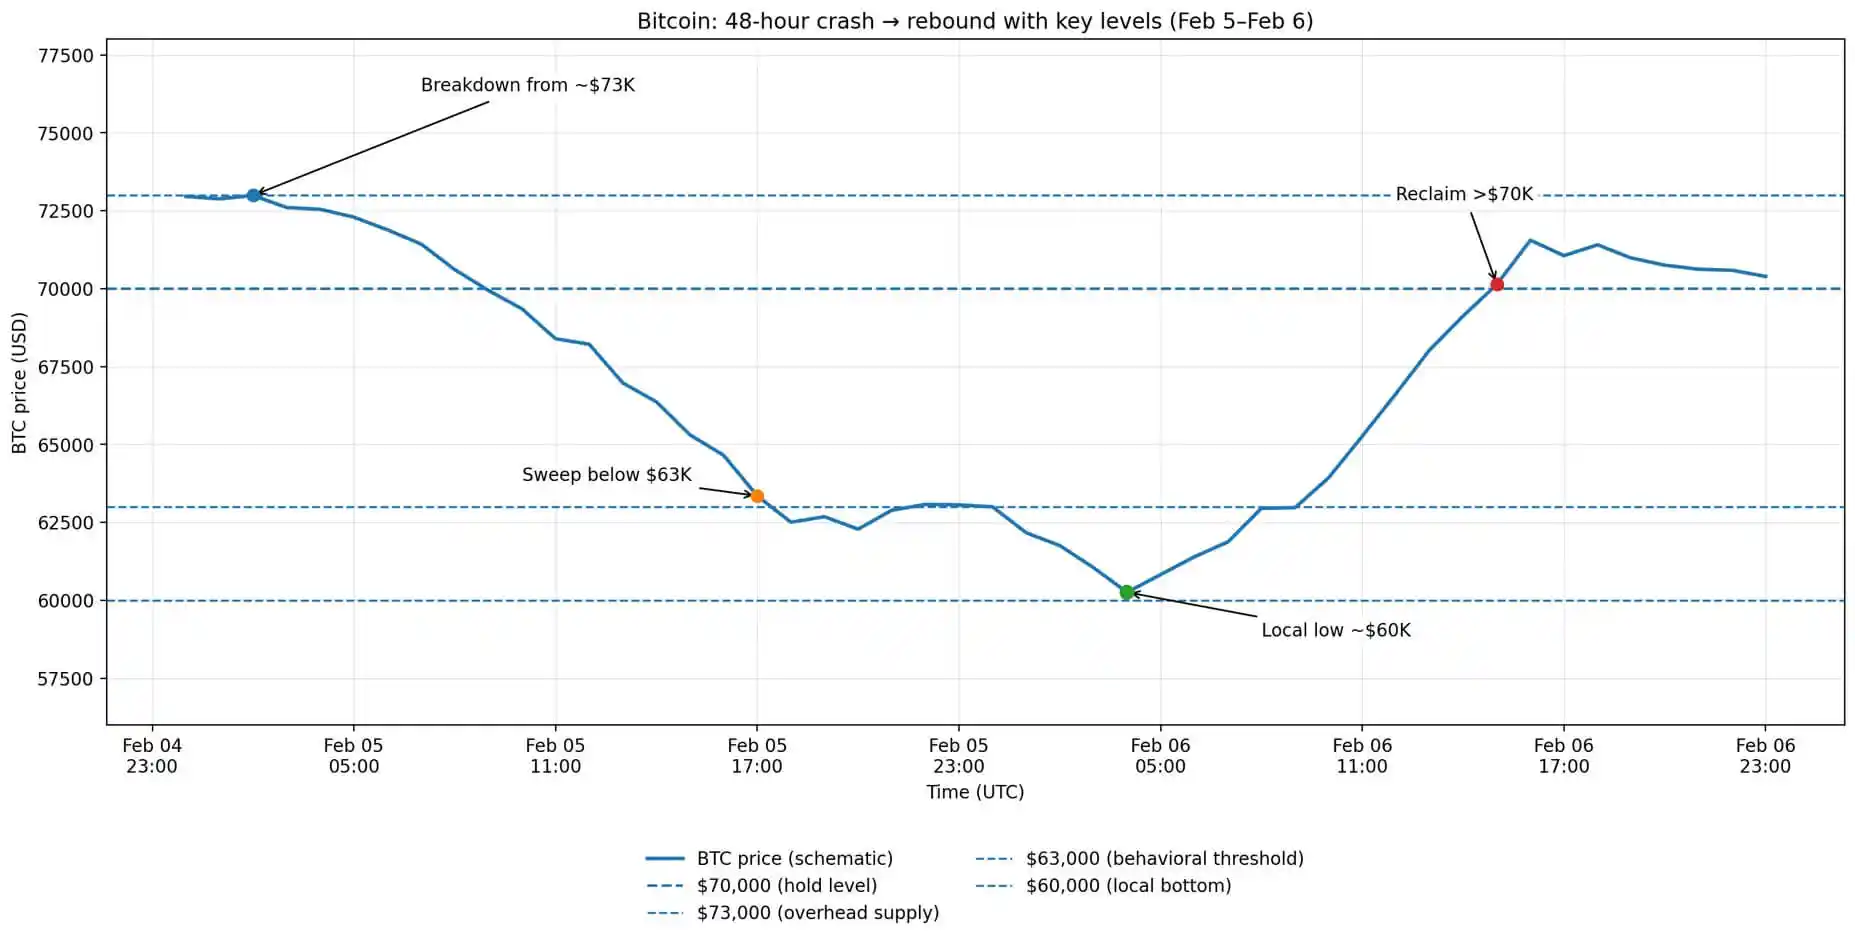
Bitcoin’s 48-hour price movement shows a collapse from $73,000, a wipeout below $63,000, regional bottoming around $60,000, and then a rebound above $70,000.
Cross-Asset Reversal Triggers Short Squeeze
Analyzing the February 6 movement: Bitcoin opened at the previous day’s close, then dipped near $60,000 intraday, but quickly rebounded strongly to a high of $71,422. After three failed attempts to break above that level, the price retreated below $70,000.
Reuters data indicates that the catalyst for this rebound was not internal crypto factors but a rapid shift in risk assets. On that day, Wall Street was broadly green: S&P 500 up 1.97%, Nasdaq +2.18%, Dow +2.47%, and Philadelphia Semiconductor Index (SOX) surged 5.7%.
Commodities also rebounded sharply: gold up 3.9%, silver up 8.6%, and the dollar index down 0.2%, signaling a more accommodative financial environment.
Analysts observe that Bitcoin’s movements are highly synchronized with these cross-asset changes, showing a clear mechanical correlation—when tech stocks stabilize and metals rebound, Bitcoin is pulled along through shared risk exposure.
However, the report warns that the intensity of this rebound reflects the extreme positioning in derivatives markets. With about -13% skew, negative funding rates, and inverted volatility curves, a unique condition is created—any macro positive shift could trigger short covering and forced unwinds, leading to intense squeeze effects.
Despite this, forward-looking indicators remain bearish. Data from Derive shows that for options expiring February 27, large open interest in puts is concentrated between $60,000 and $50,000. Derive analyst Sean Dawson states that the market’s demand for downside protection is “extremely strong,” with traders actively hedging against further declines after the rebound.
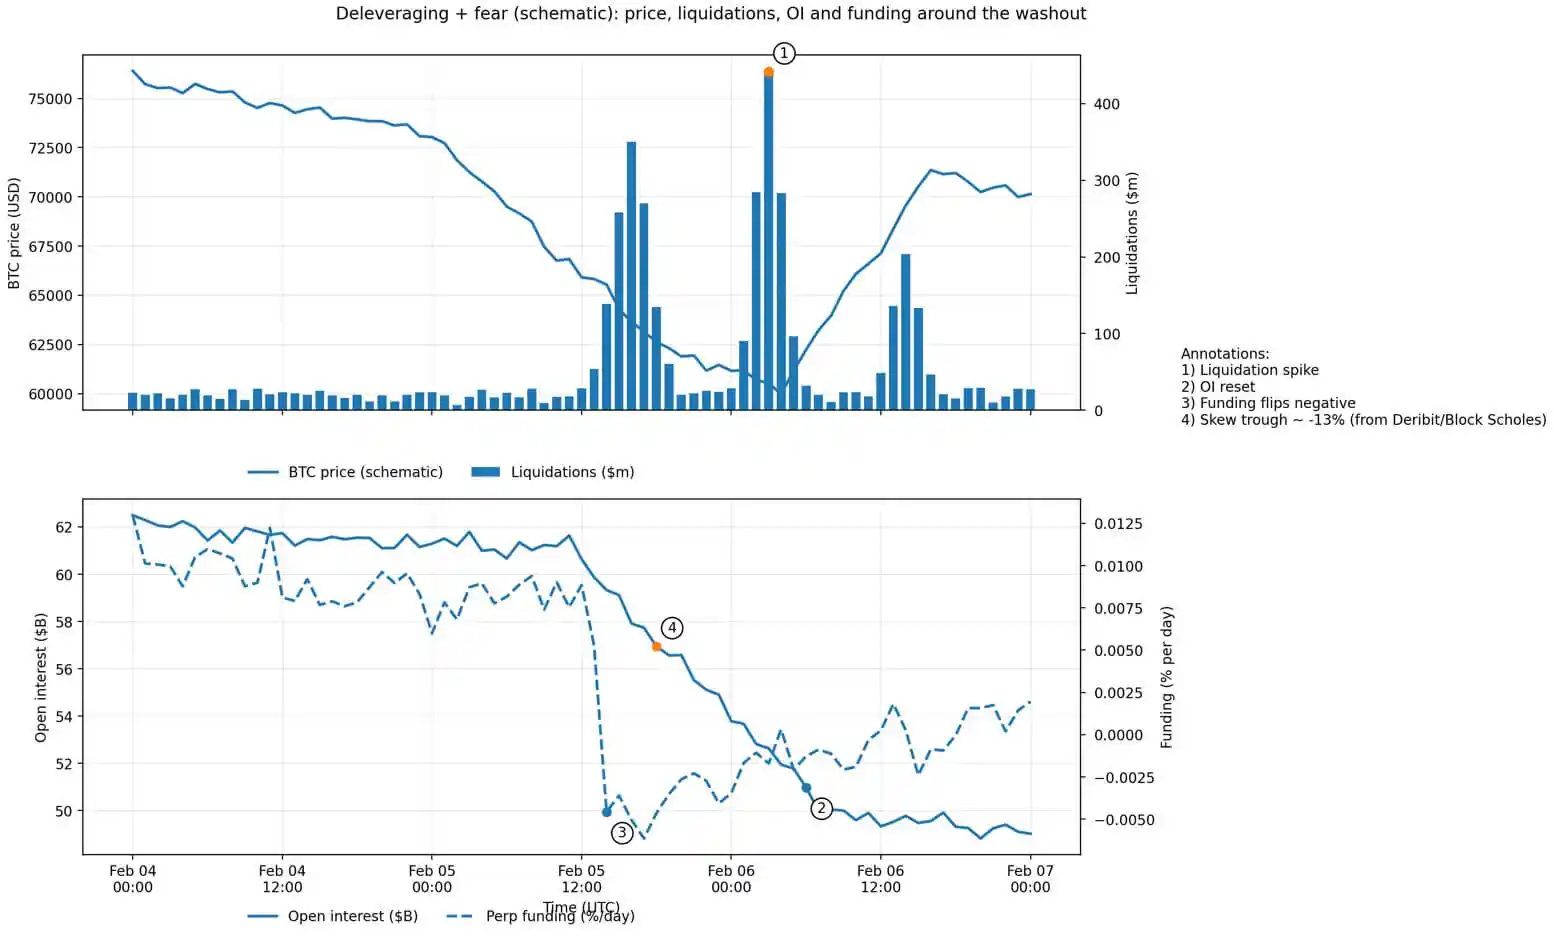
Bitcoin de-leverage chart shows a surge in liquidations, with open interest dropping from $62 billion to $49 billion, negative funding rates, and skew reaching -13%.
Can $70,000 Hold? Three Key Conditions
Analysts propose a framework suggesting that whether Bitcoin can sustain $70,000 depends on three critical conditions.
First, the macro rebound must continue—tech stocks need to remain stable, and US Treasury yields and the dollar must not tighten again. The report emphasizes that this bounce is a clear cross-asset correlation; if equities weaken again, Bitcoin will struggle to decouple.
Second, leverage reduction must proceed steadily without triggering new forced liquidations. Currently, futures open interest has significantly decreased, reducing the risk of a “vacuum drop.”
Third, miner stress must be alleviated after difficulty adjustments take effect. If prices can stay stable within the adjustment window, the expected 13.37% difficulty reduction should ease marginal selling pressure and allow hash rate to gradually recover.
However, the report also lists three reasons that could support a further dip:
One, options market positioning remains bearish. The largest put options expiring at the end of February are concentrated between $60,000 and $50,000, reflecting embedded forward signals rather than post-hoc sentiment.
Two, derivatives indicators remain fragile. Extreme skew, frequent negative funding rates, and inverted volatility structures are characteristic of a fear-driven “relief rally,” not a genuine trend reversal.
Three, ETF capital flows continue to outflow. As of February 5, Bitcoin ETF net outflows reached $690 million for the month. Although data for February 6 is not yet available, current trends suggest institutional funds have not shifted from “hedging” to “re-entry.”
On-Chain Data Reveals Key Support Zone
The analysis also cites on-chain data from Glassnode, indicating that the $70,000 level itself is not particularly significant. The real importance lies in its position above the on-chain absorption cluster identified by Glassnode, spanning from $66,900 to $70,600.
The report explains that holding above this zone suggests the cluster has absorbed enough supply to temporarily stabilize the market. However, to truly establish support, a return of spot buying, unwinding of derivatives hedges, and stable institutional inflows are necessary.
The conclusion states that the rebound from $60,000 is genuine, but the driving factors are crucial. If macro conditions change, the cross-asset stability will collapse. The mechanical rebound caused by forced liquidations does not necessarily translate into a sustainable upward trend.
The report notes that although Bitcoin has temporarily recovered above $70,000, the forward curve and capital flow data show market participants have not yet committed to believing in the sustainability of this rally. $70,000 is not the end—only a benchmark that will determine the next phase of bullish or bearish battles.