Data Breakdown of Solana Q4 Performance: Where Exactly Is the "Golden Pit"?
Source: The Defi Report
Author: Michael Nadeau
Translation and Compilation: BitpushNews
Solana kicked off 2025 with a bang, becoming the preferred platform for Trump-issued Meme Coins and the first stop for most new users entering this cycle. However, how did 2025 actually come to an end?
Currently, the Solana network appears to be entering a cyclical reset phase. On-chain speculative demand continues to decline, and new application scenarios and traditional finance (TradFi) integrations have yet to fill this gap. Operational performance in Q4 has significantly weakened: total revenue (REV) dropped 43% to its lowest level since Q3 2023; real on-chain yields fell 56% to 0.46%. Meanwhile, fundamentals have deteriorated with user activity, and operating costs have risen sharply relative to user fees.
This article provides a comprehensive review of Solana’s Q4 performance through data.
1. Operational Performance: Double Decline in Revenue and Yields
1. Real Economic Value (REV)
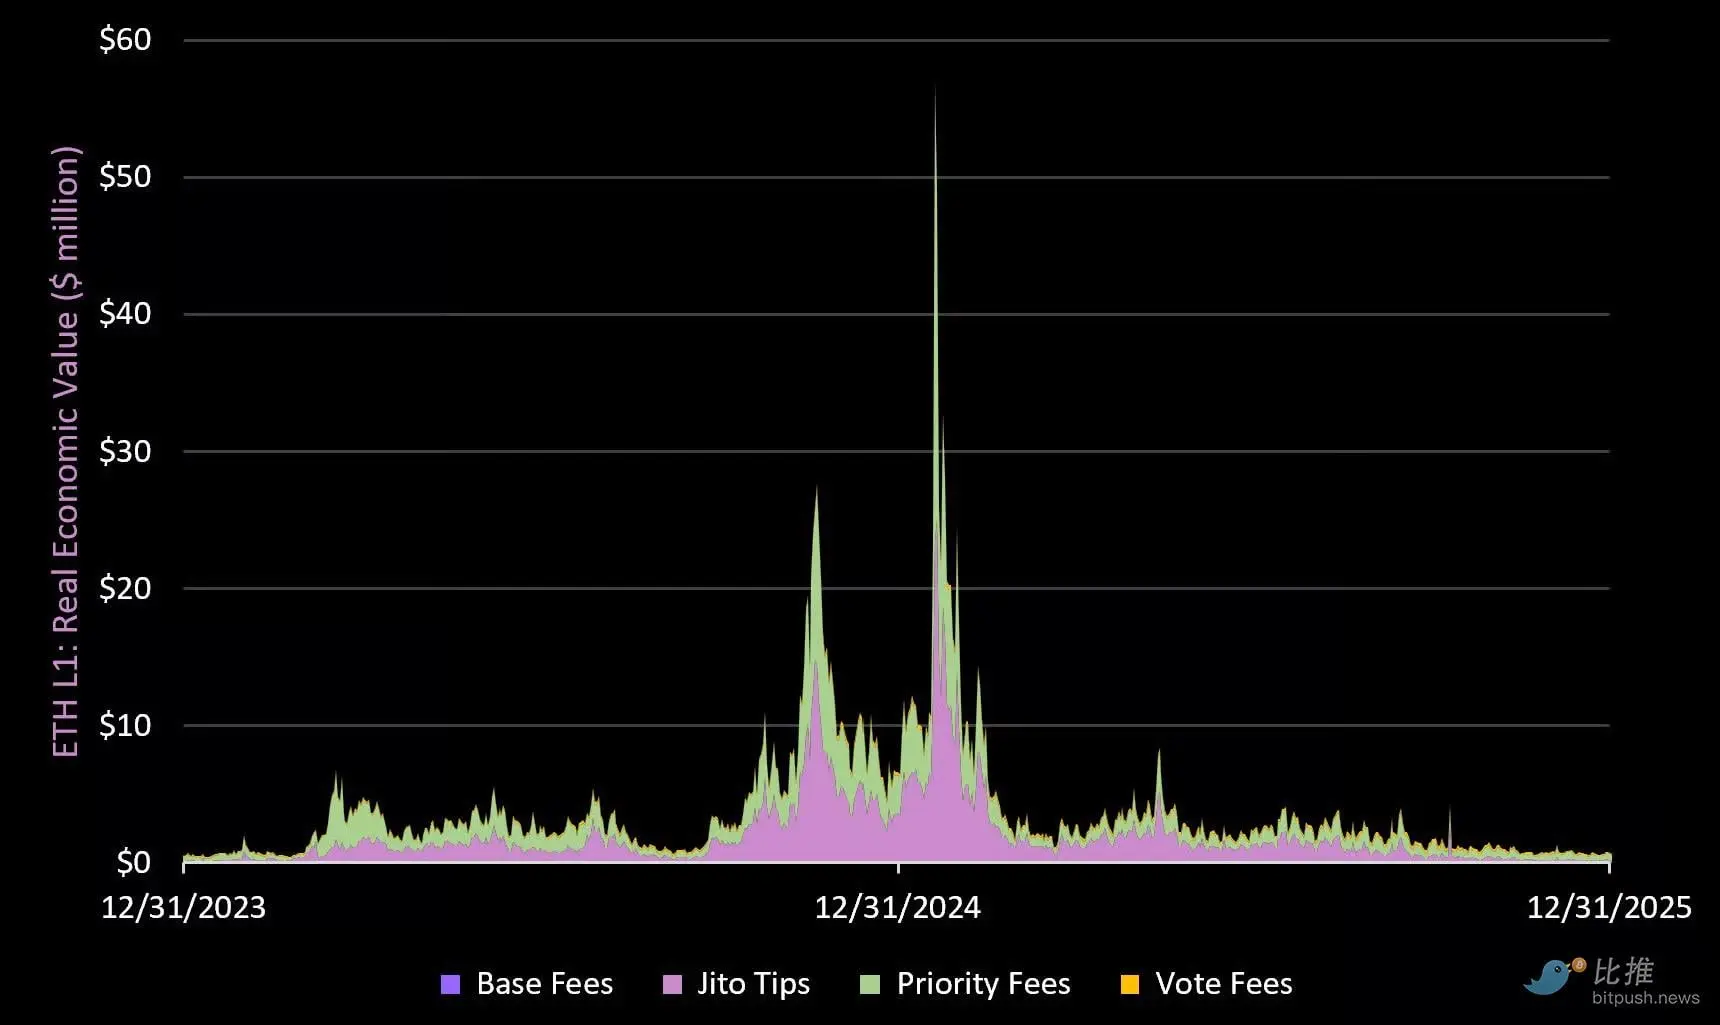
Note: REV includes base fees, priority fees, MEV (Jito Tips), and voting fees. MEV is redistributed to SOL holders through staking.
In Q4, the Solana network generated only $91.1 million in total fees, the lowest since Q3 2023, far below the $222.7 million in the previous quarter.
Full-year 2025 performance: generated $1.4 billion REV, down 1.4% year-over-year.
Comparison reference: Ethereum network Q4 fees were $141 million, with $763 million for the full year 2025.
Data breakdown:
- Base fees: down 32% in Q4 (but up 43% for the full year 2025)
- Jito Tips (MEV): plummeted 75% in Q4 (up 8% for the full year 2025)
- Priority fees: down 51% in Q4 (up 15% for the full year 2025)
- Voting fees: down 27% in Q4 (up 32% for the full year 2025)
Key conclusion:
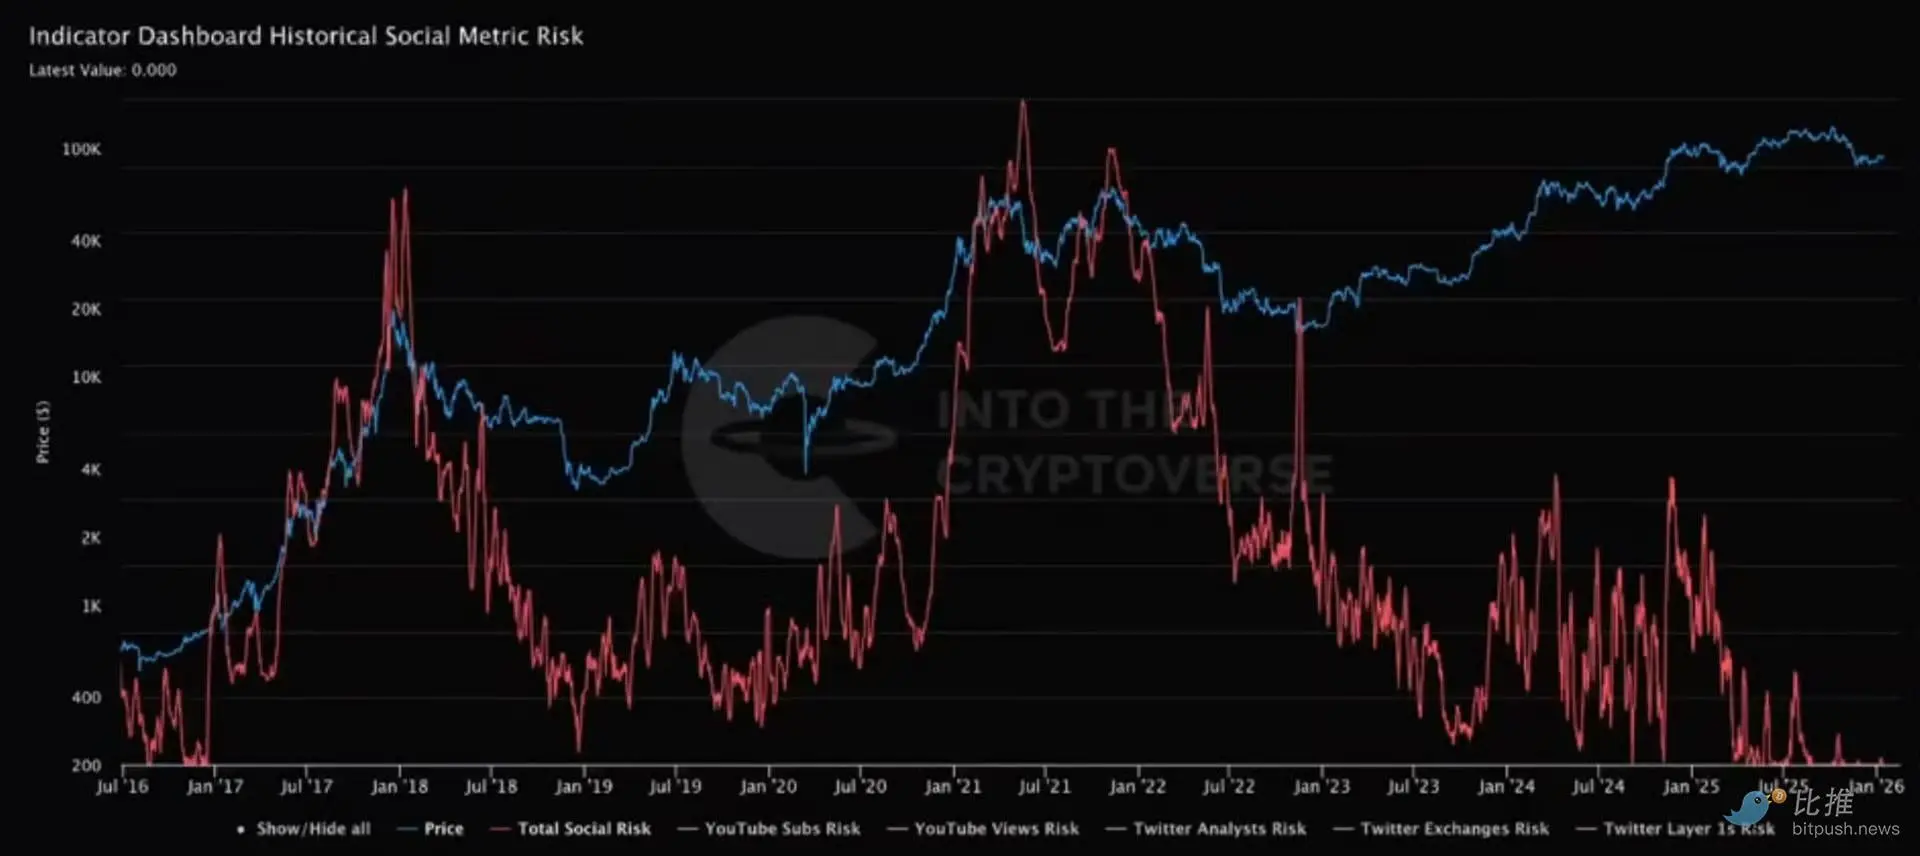
Solana is the “hotbed of speculation” in this cycle (together with Hyperliquid). The most prominent applications on the network (Pump, Axiom, Raydium, Jupiter) all cater to retail traders—making on-chain revenue highly cyclical and dependent on speculative demand. With social interest in cryptocurrencies at a six-year low, it’s unlikely this trend will reverse in the short term.
In the long run, we believe Solana needs to lead the tokenization of on-chain equity (and other RWAs) to smooth out its extreme on-chain cyclicality. Given the recent challenges faced by the Clarity Act, this will still take some time.
2. Real On-Chain Yield
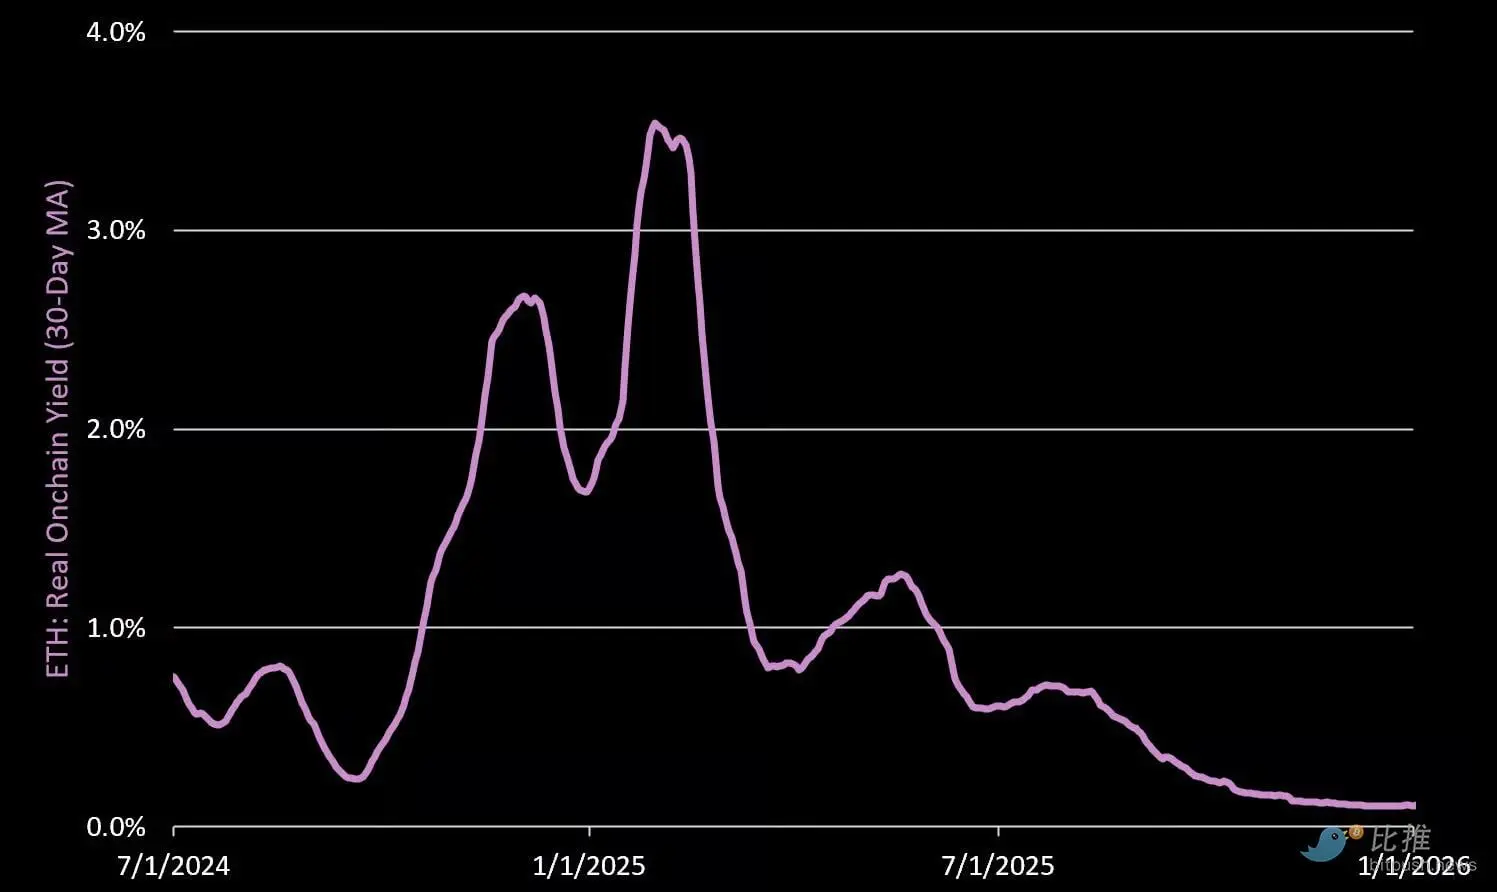
Q4 real on-chain yield (annualized) was only 0.46%, a 56% decrease quarter-over-quarter. Of this, 72% came from priority fees, and 28% from MEV. The decline in MEV share reflects a significant weakening of on-chain competition (i.e., speculative demand) this quarter.
3. Total On-Chain Yield
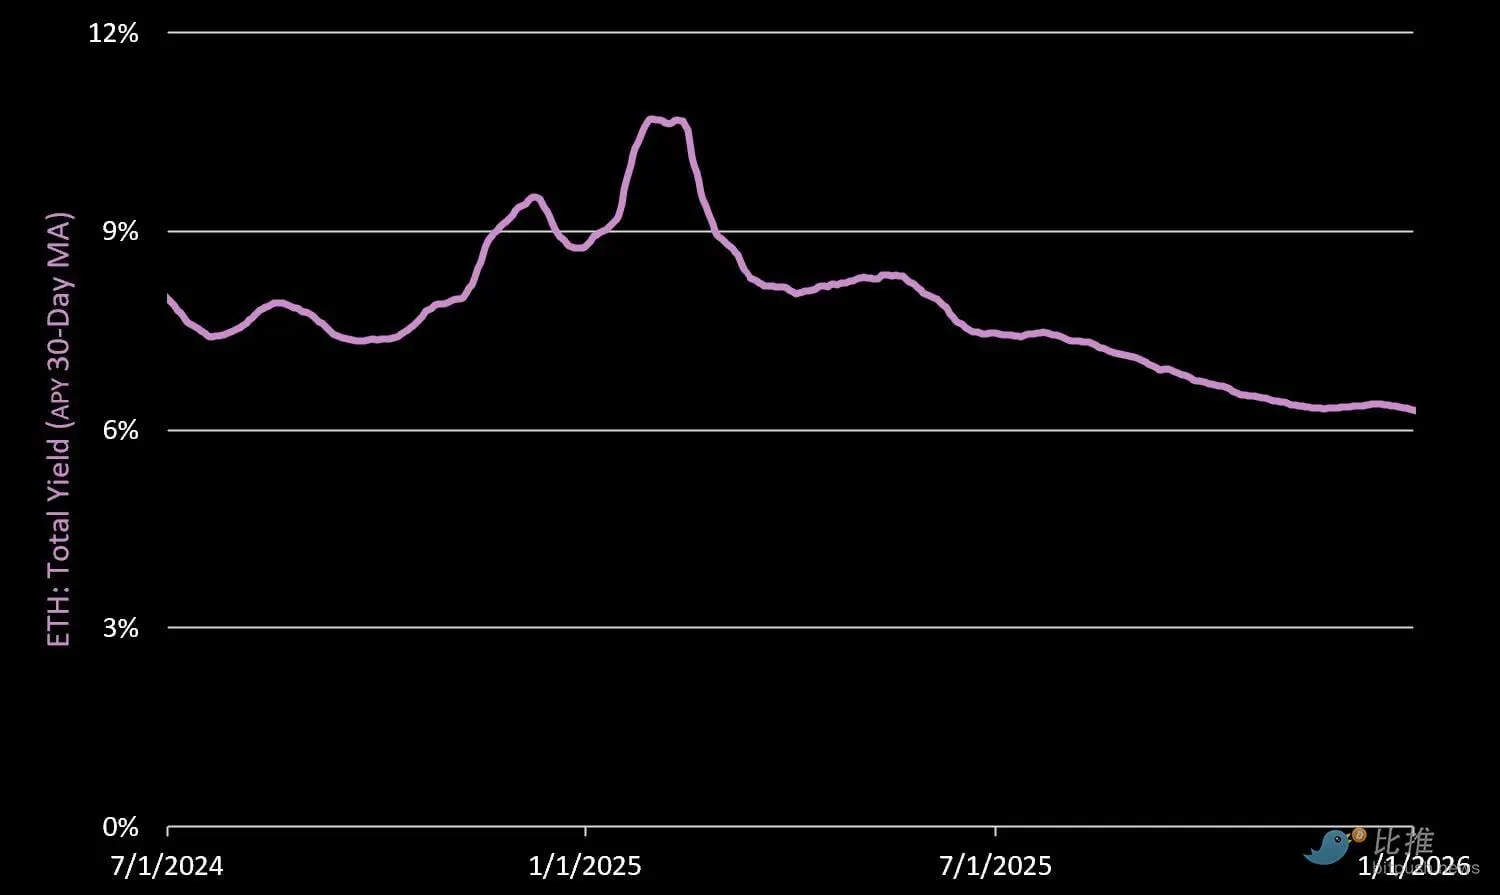
Including protocol issuance rewards, the total annualized yield is 6.7%. Notably, 93% of this yield comes from new token issuance of SOL. Due to a 55% decline in priority fees and MEV, total yield slipped from 7.64% in Q3.
2. Network Fundamentals: Efficiency Challenges
1. Monthly Network GDP
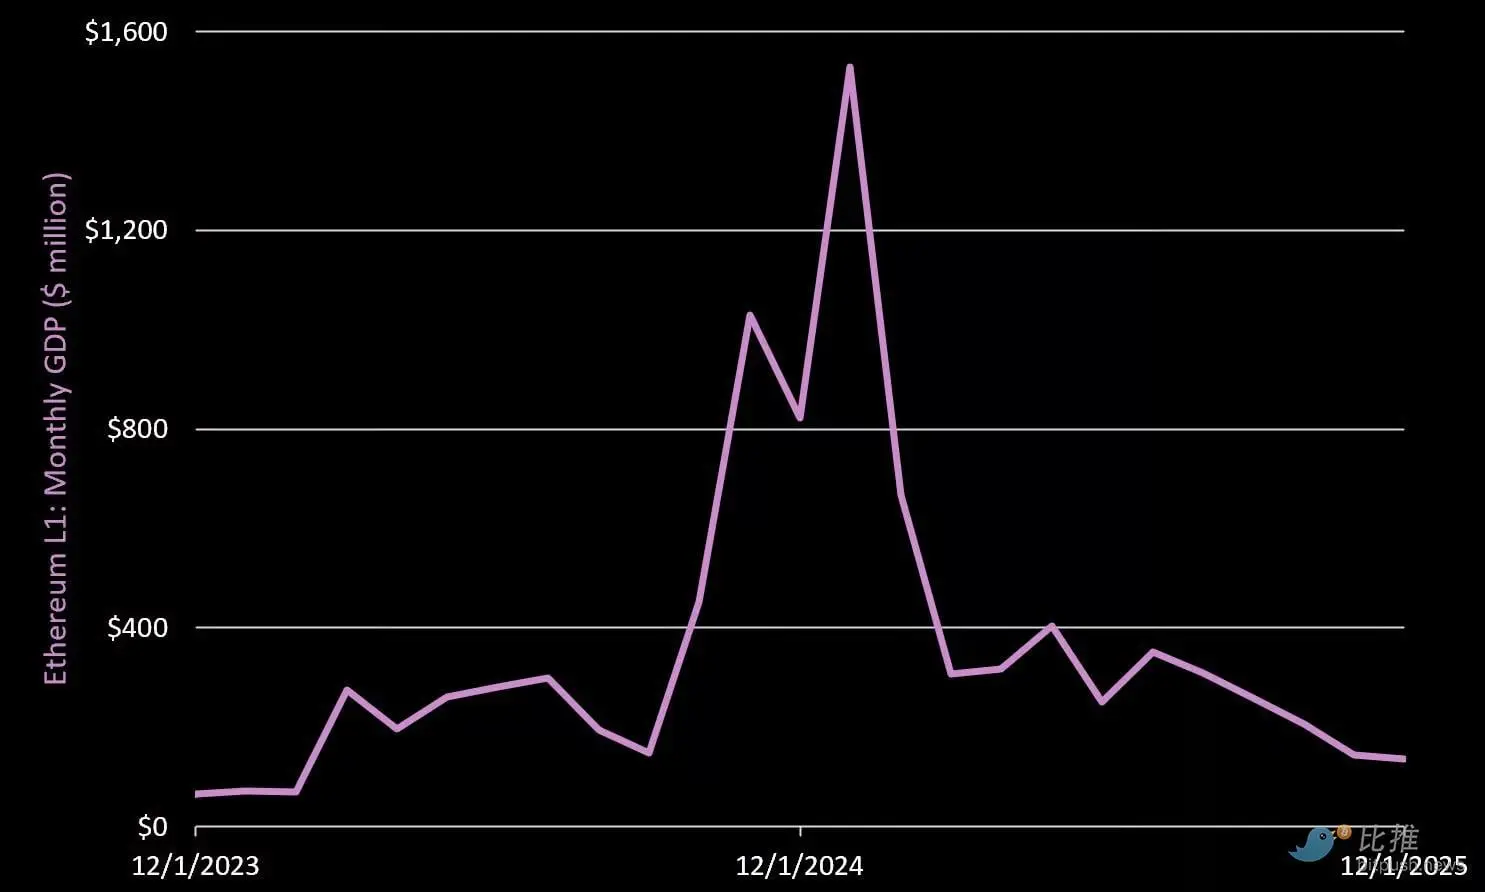
Note: GDP refers to the total fees generated by top on-chain applications (excluding the base chain fees).
Q4 top applications generated a GDP of $485 million, down 47% quarter-over-quarter.
- Pump.fun: $96 million (Q4 down 19%)
- Circle: $85 million (Q4 up 6%)
- Axiom: $55 million (Q4 down 61%)
- Raydium: $31 million (Q4 down 79%)
In comparison, Ethereum Layer 1 applications generated a GDP of $2.3 billion in Q4.
2. Active Addresses and Staking

Active addresses: Q4 daily active addresses averaged 2.2 million, down 19% quarter-over-quarter.
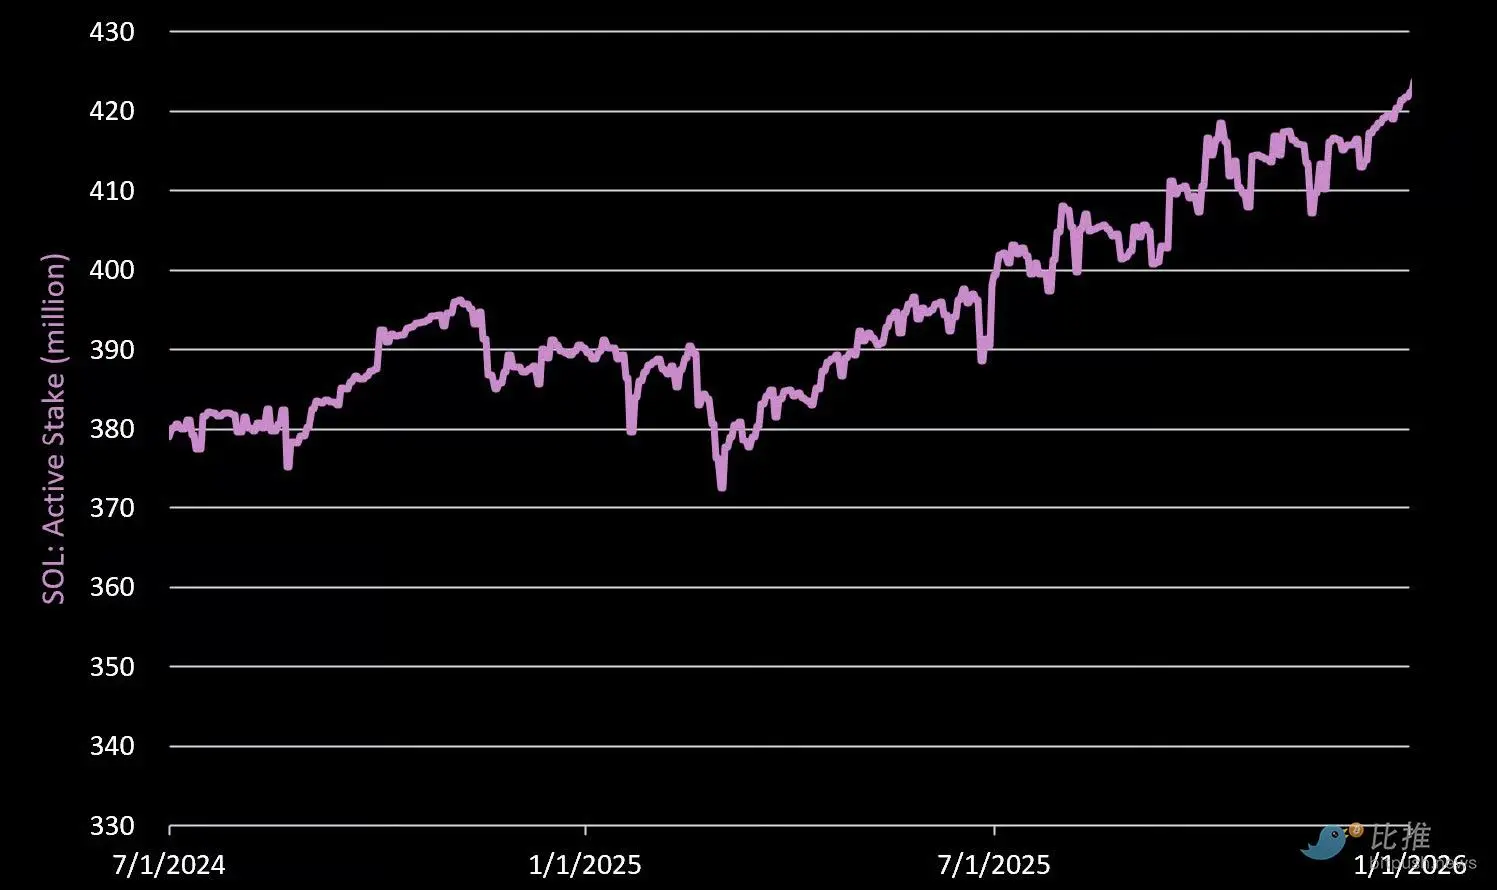
Active stakers: As of December 31, 2025, a total of 421.7 million SOL were staked (75% of circulating supply), up 3.5% quarter-over-quarter.
3. Cost to Produce $1 REV
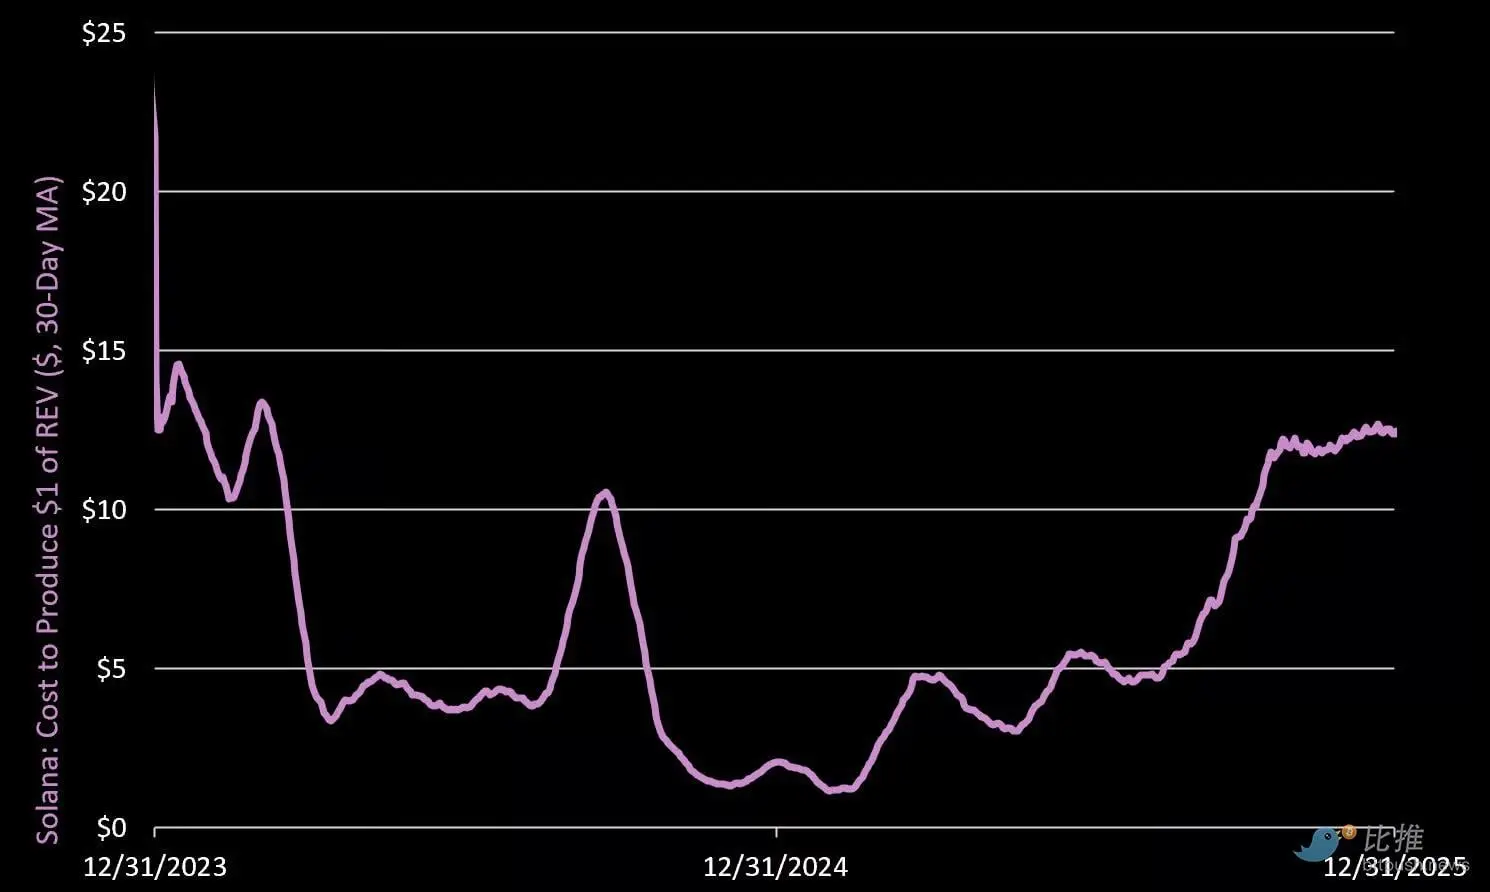
The average cost to generate $1 of real economic value in Q4 rose to $11.76, a 105% surge quarter-over-quarter.
What does this mean? It indicates that to maintain network security, the inflationary costs (issuance) relative to actual value produced are increasing. If we compare Solana to a company, it’s now time to cut management costs and reduce expenses.
3. Stablecoins
Stablecoin Supply
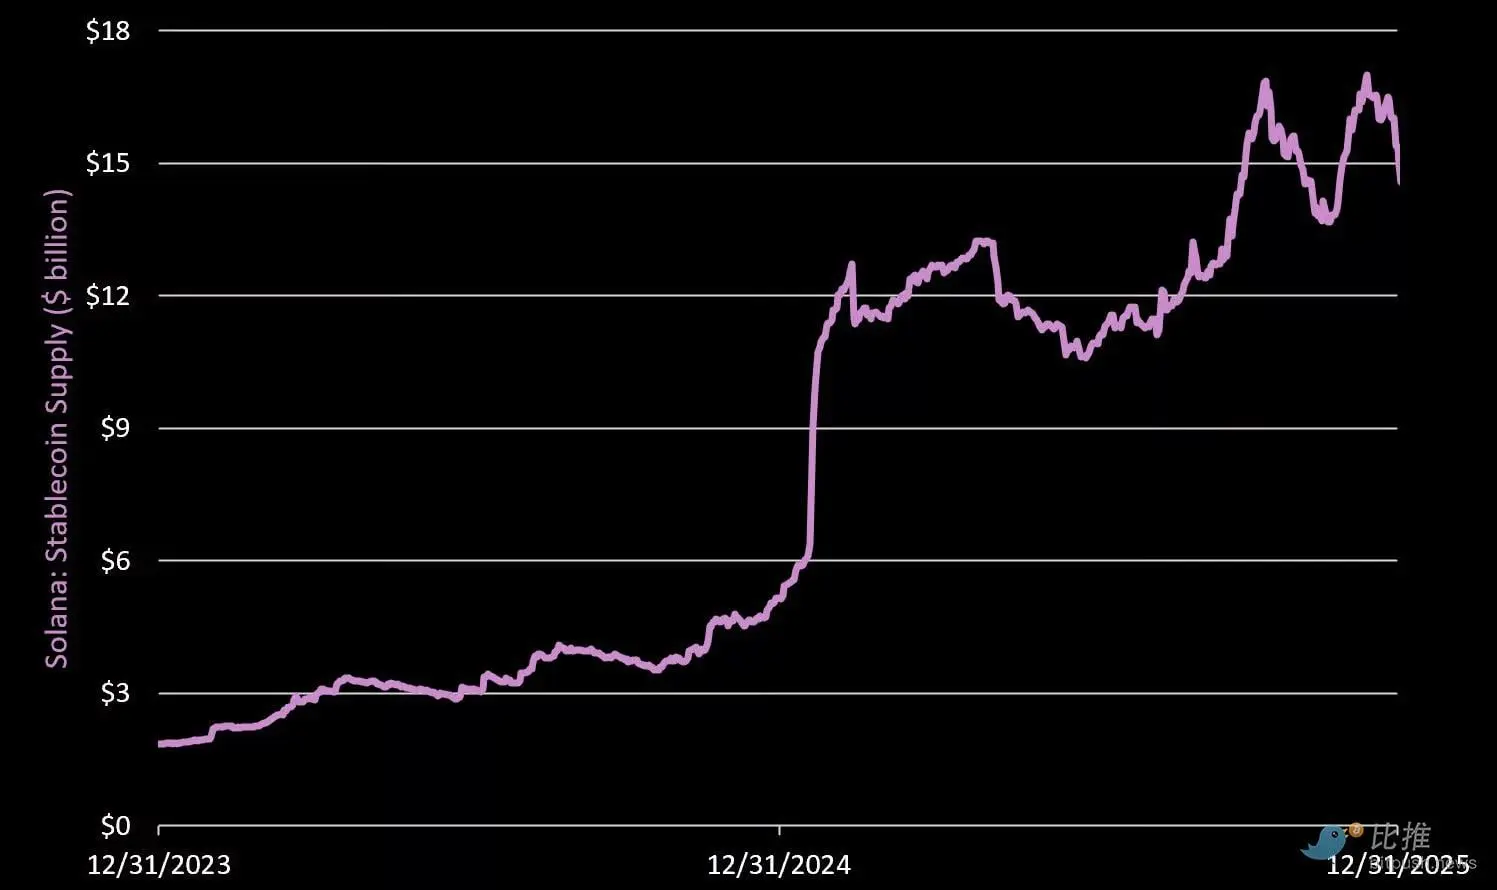
Total on-chain stablecoin supply reached $15.4 billion, up 4.4% quarter-over-quarter. This accounts for 5% of the total stablecoin supply in the crypto market, ranking behind Ethereum, Tron, and BNB. Leading issuers:
- Circle/USDC: $9.9 billion (Q4 down 1%)
- Tether/USDT: $2.1 billion (Q4 down 10%)
- Paypal/USDPY: $870 million (Q4 up 95%)
- Paxos/USDG: $870 million (Q4 up 80%)
- Solstice/USX: $306 million (Q4 up 83%)
Effective Stablecoin Turnover Rate
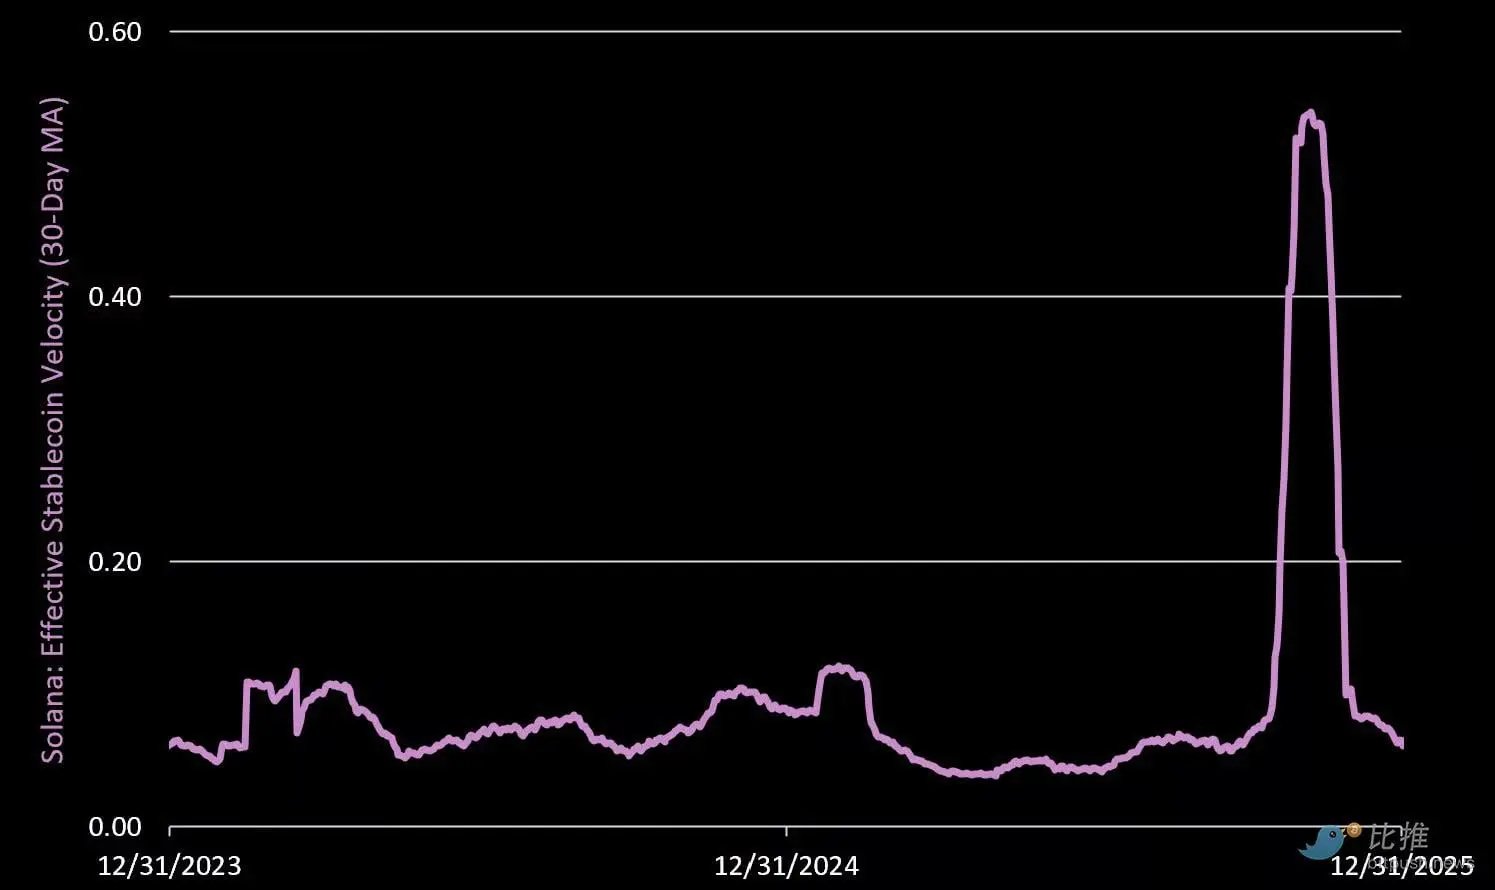
The effective stablecoin turnover rate measures the daily exchange rate of stablecoins per dollar on-chain. This metric filters out noise from wash trading and circular trading, calculated as: daily net USD transfer volume / circulating supply. An increase indicates higher economic activity.
Q4 average turnover rate was 0.22, up 282% quarter-over-quarter. However, this surge is largely due to the extreme volatility during the 10/10 liquidation event.
A reading of 0.22 means 22% of the stablecoin supply was turned over within the quarter. For reference, Ethereum Layer 1’s Q4 turnover rate was 3%, and overall Layer 2 turnover was 5%.
Net Dilution Rate (Net Dilution Rate)
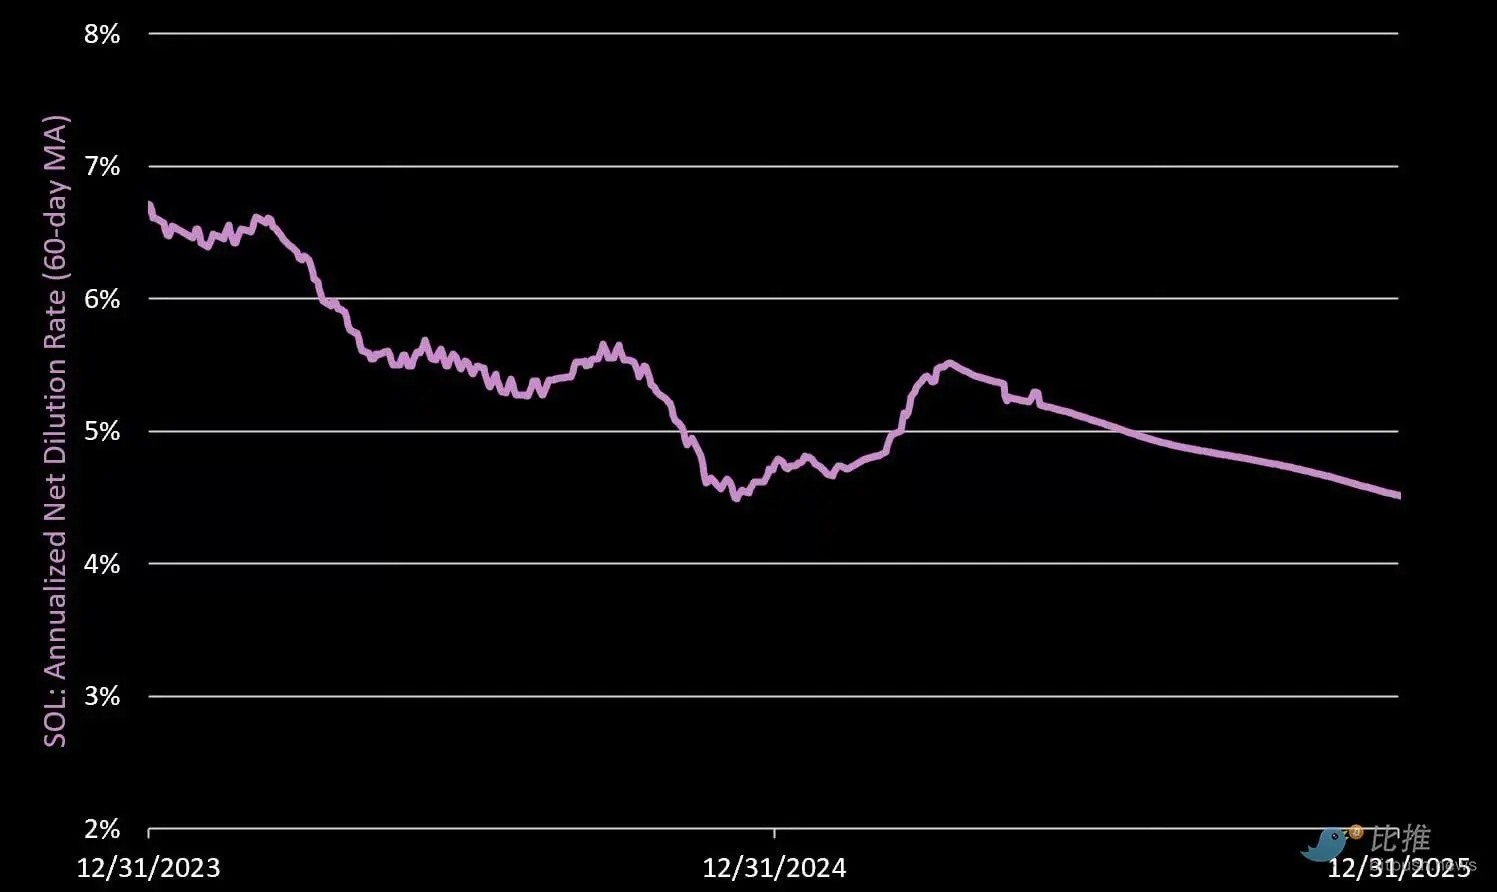
Net Dilution Rate = (Daily protocol issuance minus burned SOL) / circulating supply (annualized). A positive value indicates dilution to non-staked SOL holders.
Q4 annualized net dilution rate was 4.57%, down 5.5% quarter-over-quarter. Drivers:
- SOL issuance: 6.45 million in Q4 (Q3: 6.80 million)
- SOL burned: 63,764 in Q4 (Q3: 76,247)
- Net result: net addition of 6.38 million SOL (annualized inflation rate 4.57%)
4. DeFi: Rise of Private DEXes and Trading Volume
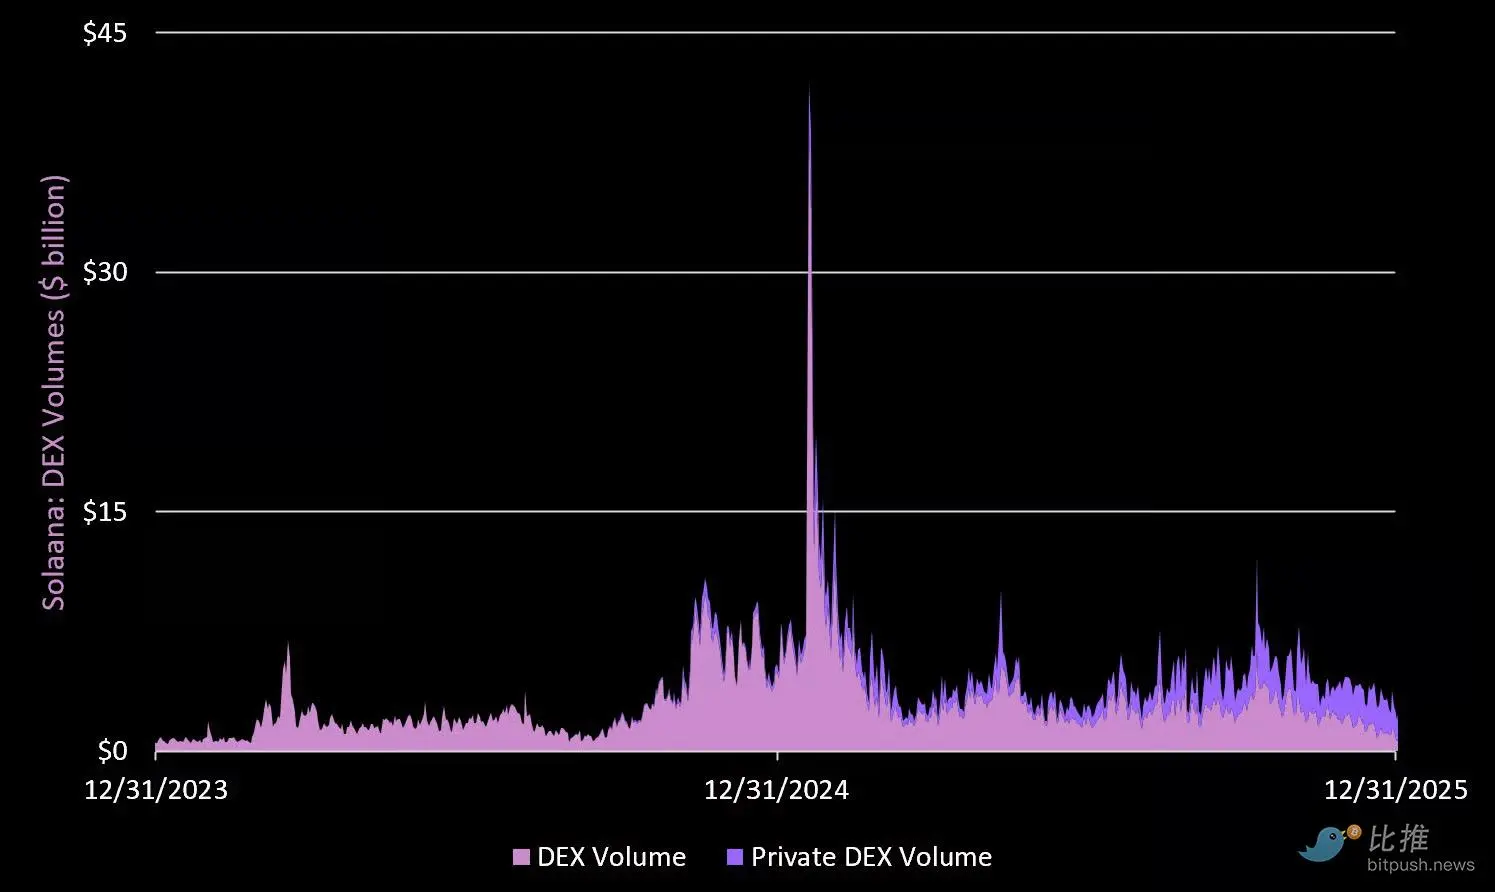
Private DEXes on Solana have seen tremendous growth. Daily trading volume averaged $2.2 billion (48% of total), up 50% quarter-over-quarter.
Meanwhile, public DEXes had an average daily volume of $2.5 billion in Q3, up 5%. Overall, total DEX trading volume increased 15% this quarter. Leading DEXes by trading volume:
- HumidiFi (Private): $1.4 billion/day (Q4 up 105%)
- Raydium: $985 million/day (Q4 up 6%)
- Meteora: $700 million/day (Q4 up 27%)
- Orca: $473 million/day (down 24%)
- Tessera (Private): $303 million/day (Q4 up 57%)
- Pump Fun: $88 million/day (Q4 down 24%)
DeFi Velocity (DeFi Velocity)
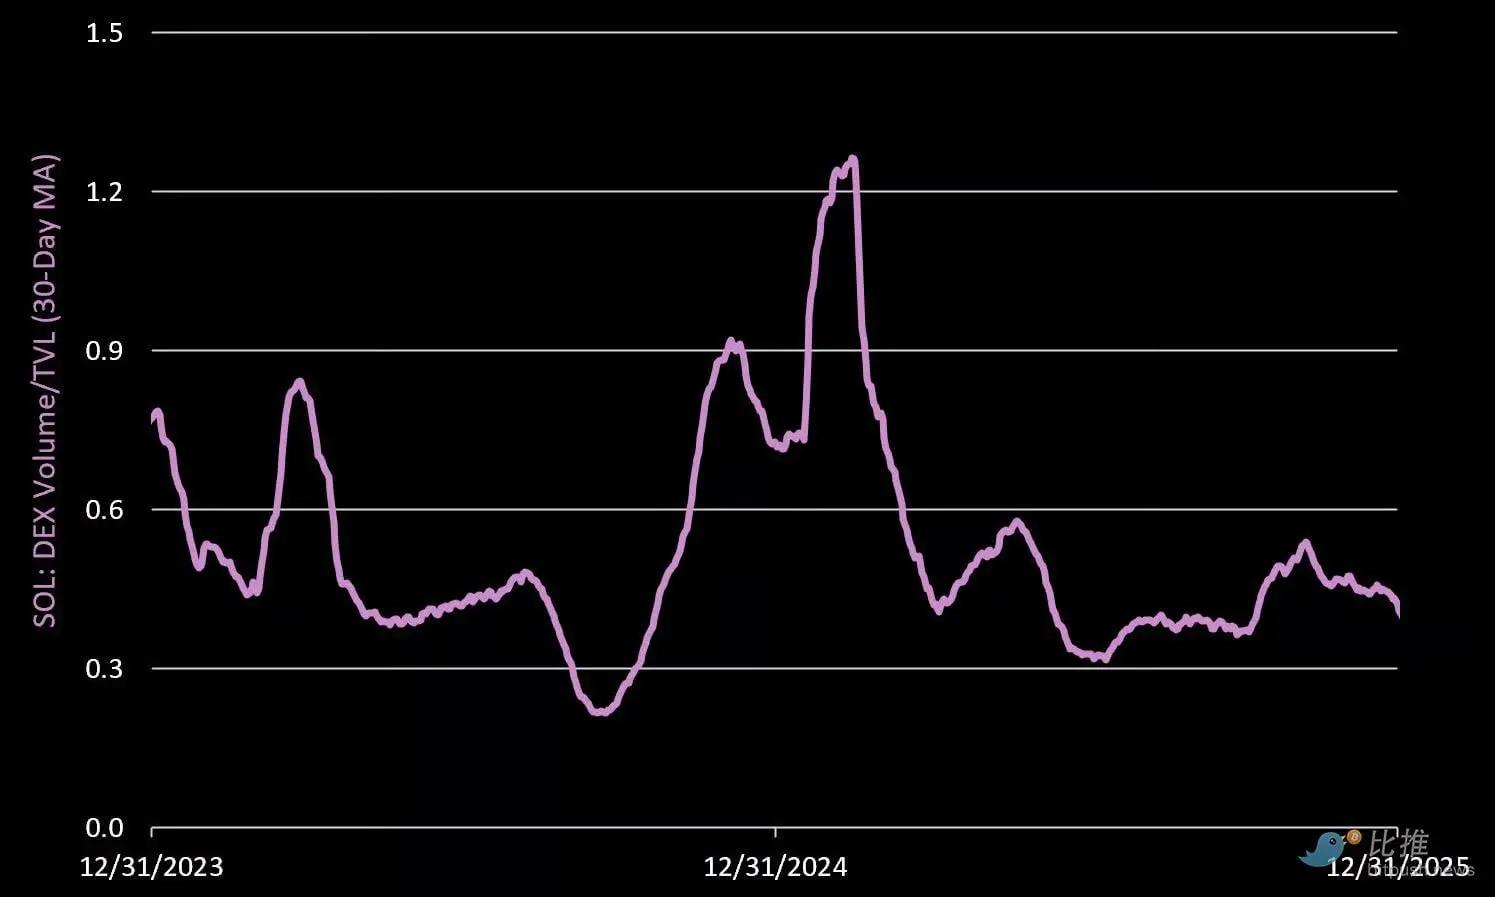
Measures the turnover rate of each dollar within DeFi protocols. Q4 increased by 22%, with a daily turnover rate of 46% of TVL. Most activity is attributed to extreme volatility during the 10/10 liquidation event.
Newly Created Trading Tokens
 In Q4, 2.1 million tokens were created on Solana’s launch platform, down 24% quarter-over-quarter.
Pump Fun continued to lead with 1.6 million new tokens (75% market share).
Meteora was a highlight in Q4, growing 18% and capturing 21% of the share.
5. Fair Value
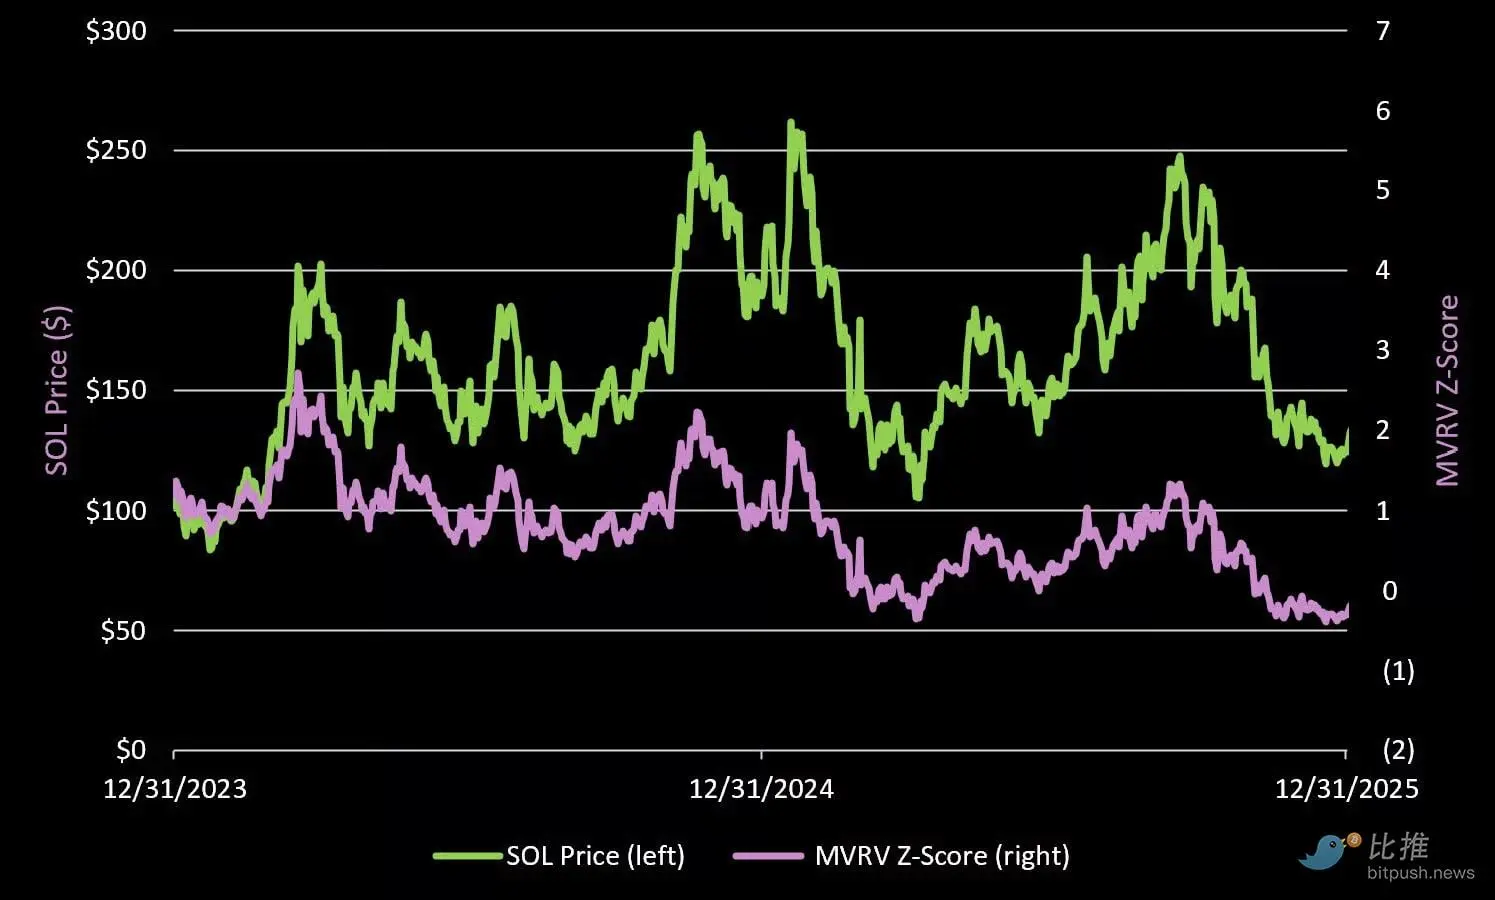
From a valuation perspective, SOL’s current MVRV is 0.95, indicating its price is below the realized price (about $145).
In terms of “fair value,” SOL’s current trading price is below its $145 realized price (the realized price is an alternative indicator of the network’s total token holding cost), with an MVRV of 0.95. During the 2022 bear market bottom, SOL fell to the realized price of 22%.
While we do not expect this to happen again in this cycle, we do believe SOL will at some point be significantly below its realized price, with a target range between $90 – $110 .
200-Week Moving Average
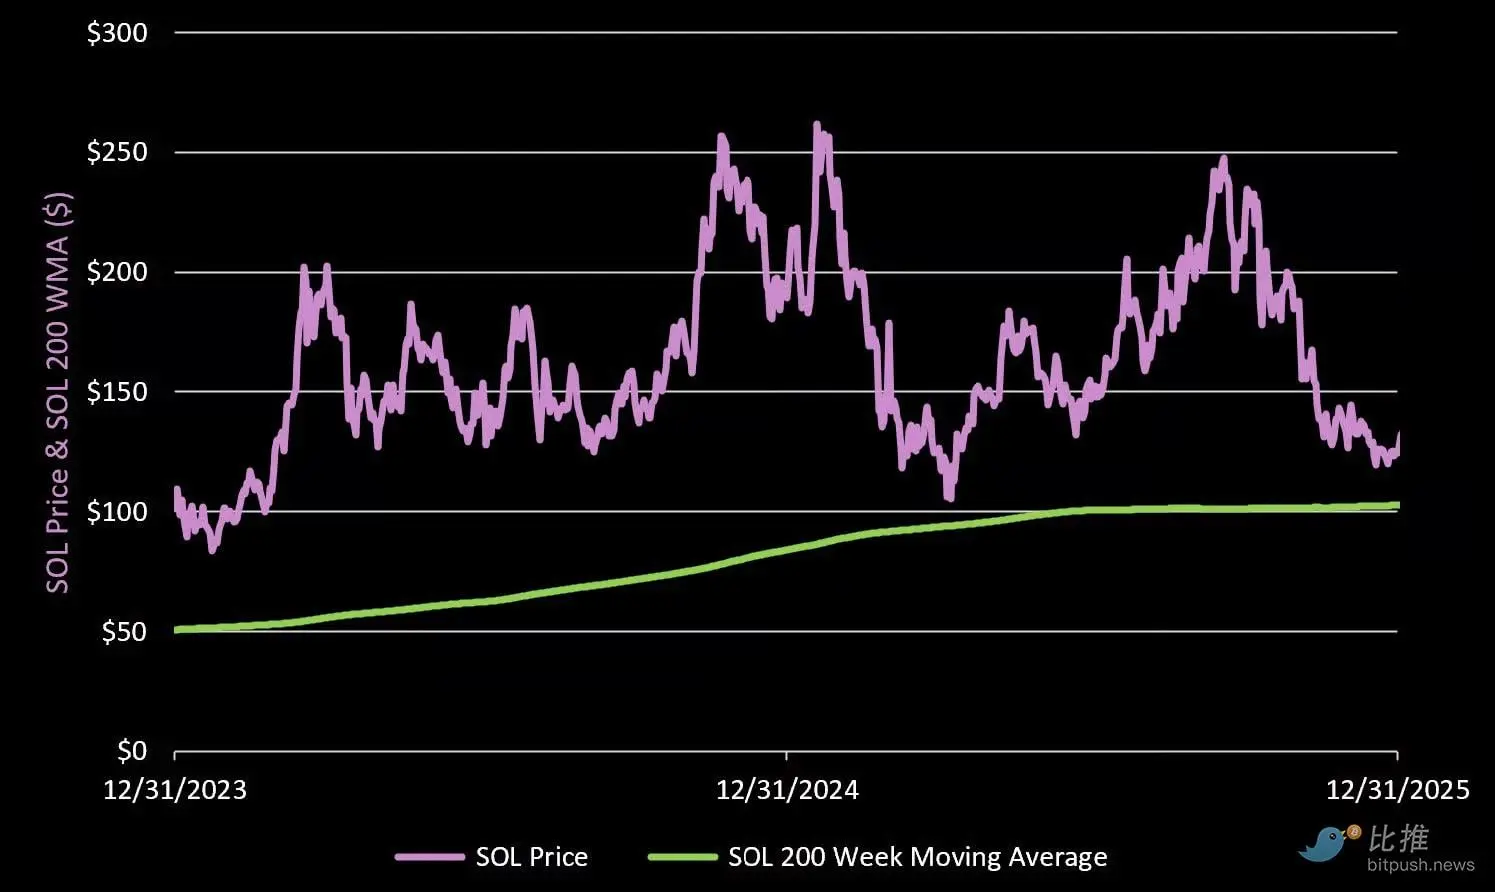
We also expect SOL to retest the long-term 200-week moving average at some point, currently at $103.
6. Conclusion: Three Keys to Reaching New Heights
Solana has survived the darkest moments at the end of 2022, proving not only that it is still alive but also that it has become stronger than ever. To continue maturing, it must accomplish the following three points:
- Deepen retail/consumer trading: Stop talking about “blockchain games.” The most genuine “game” in crypto today is retail trading. Solana needs to innovate in protecting users from sniper attacks and combating “exit scam” projects.
- Embrace TradFi: Since the goal is to become the “Nasdaq on the blockchain,” real stocks and bonds assets are necessary.
- Win the developer battle: Continuously provide resources to developers worldwide and maintain a leading edge in technological iteration.
We reversed and bought Solana at the end of 2022 / early 2023, with a core position cost of $15.39, and exited at over 10x profit by late 2024 / early 2025. Now, we are patiently waiting for the next “perfect entry point.”
Related Articles
SOL Slides 11% to $78 After $90 Rejection — Is $76 Support Next?
Solana Compresses Beneath $90 After Sharp Range Reclaim
3 Cryptos to Invest in March 2026 — ETH, SOL, and XRP
Over $572 Million in Crypto Token Unlocks Expected Across SOL, WLD, DOGE, and More