Is Near Protocol (NEAR) Preparing for a Breakout? This Bullish Pattern Formation Suggests So!

Key Takeaways
-
Near Protocol (NEAR) is trading higher amid a broader crypto market rally driven by easing inflation data.
-
The daily chart shows a well-defined inverse head and shoulders pattern, a classic bullish reversal signal.
-
NEAR is currently testing a crucial neckline resistance between $1.84 and $1.90, which has capped price rallies so far.
-
A confirmed breakout above this zone, along with a reclaim of the 100-day moving average, could strengthen bullish momentum.
-
If the pattern plays out, NEAR may target the $2.36 area, offering notable upside from current levels.
-
Failure to hold above recent support near $1.64 could delay or invalidate the bullish breakout scenario.
The broader crypto market is trading firmly in the green today (January 14, 2026), with Bitcoin (BTC) and Ethereum (ETH) gaining roughly 3% and 6% over the past 24 hours. Riding this momentum, Near Protocol (NEAR) has climbed nearly 5%, attracting attention in altcoins.
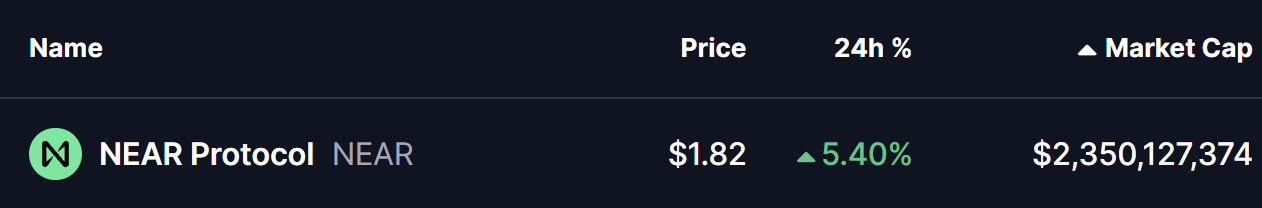
Source: Coinmarketcap
This move follows the latest U.S. CPI data release (December 2025, published January 13), which showed inflation holding steady. Headline CPI came in at +2.7% YoY—unchanged from November—while core CPI rose modestly by +2.6% YoY. Monthly readings of +0.3% (headline) and +0.2% (core) aligned closely with expectations, reinforcing a risk-on tone across global markets.
Beyond the macro tailwinds, NEAR’s price chart itself is flashing a compelling technical signal. The daily timeframe is now displaying a classic bullish reversal structure that could set the stage for an upside continuation—especially as NEAR continues to strengthen its fundamentals, ranking as the second most active blockchain of 2025, just behind Solana.

Top 10 Active Blockchains/ Source: @cryptorand (X)
Inverse Head and Shoulders Pattern Takes Shape
On the daily chart, NEAR has carved out a well-defined inverse head and shoulders pattern—widely regarded as one of the most reliable bullish reversal formations.
-
The left shoulder formed in early December near the $1.85–$1.90 region.
-
This was followed by a deeper sell-off toward the $1.45 area, forming the head.
-
The subsequent pullback found support again near $1.64, completing the right shoulder.
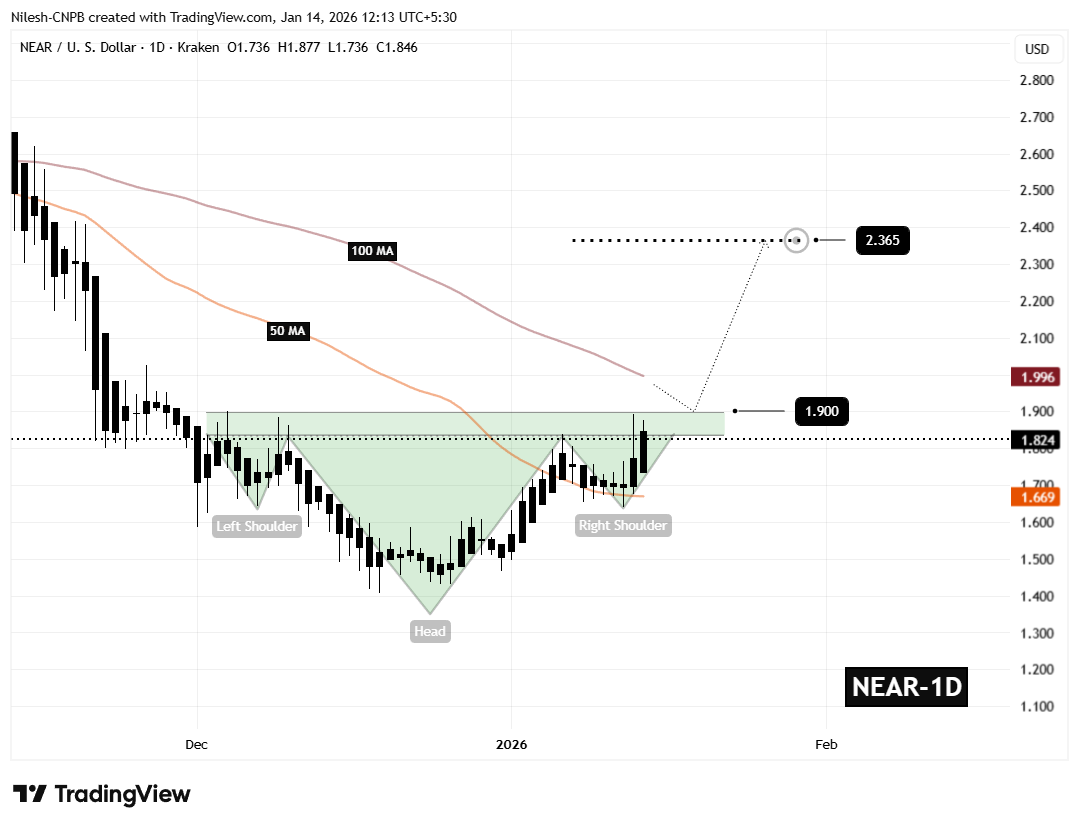
Near Protocol (NEAR)/Coinsprobe (Source: Tradingview)
Since then, NEAR has rebounded steadily, reclaiming the 50-day moving average, which is now acting as dynamic support. Price is currently consolidating just below a key neckline resistance zone between $1.84 and $1.90, highlighted clearly on the chart.
This zone has capped price advances multiple times, making it the critical level traders are watching for confirmation.
What’s Next for NEAR?
A decisive daily close above the** $1.84–$1.90** neckline, followed by a successful retest, would confirm the inverse head and shoulders breakout. Additional strength would come from reclaiming the 100-day moving average near $1.99, which has acted as overhead resistance during the recent downtrend.
If these conditions are met, the measured move projection from the pattern points toward the $2.36 region, implying a potential upside of roughly 25–30% from the breakout area.
On the downside, failure to clear the neckline could lead to further consolidation, with the right-shoulder support near $1.64 remaining a key level to defend in order to keep the bullish structure intact.
Bottom Line
NEAR Protocol is at a technically pivotal moment. Supported by improving macro sentiment, strong on-chain activity, and a textbook bullish reversal pattern, the setup favors the bulls—provided buyers can push price decisively above the neckline. A confirmed breakout could mark the beginning of NEAR’s next meaningful leg higher.
Disclaimer: The views and analysis presented in this article are for informational purposes only and reflect the author’s perspective, not financial advice. Technical patterns and indicators discussed are subject to market volatility and may or may not yield the anticipated results. Investors are advised to exercise caution, conduct independent research, and make decisions aligned with their individual risk tolerance.
About Author: Nilesh Hembade is the Founder and Lead Author of Coinsprobe, with over 5 years of experience in the cryptocurrency and blockchain industry. Since launching Coinsprobe in 2023, he has been providing daily, research-driven insights through in-depth market analysis, on-chain data, and technical research.
Related Articles
Shiba Inu bulls are looking for an exit opportunity: Is this that opportunity?
NEAR and PHA Steal Spotlight by Defying the Fall Across the Crypto Market
BTC 15-minute increase of 1.06%: Macroeconomic liquidity expectations and institutional buying resonance driving the market
ETH short-term increase of 1.04%: Spot buying driven and deflation expectations resonate to amplify the rally