Optimism (OP) Price Finds Its Footing – Why This Move Looks More Than Just a Bounce

The price of Optimism (OP) is now showing some legitimate signs of a rebound after a substantial period of weakness.
With lower highs being formed over the course of several months and substantial pressure being maintained through constant sales, it appears as if buyers are finally entering the market.
Analyst Michaël van de Poppe pointed out on X that OP held its 21-day moving average as support. That level often acts as a key signal during early trend reversals.
Since bouncing from it, the OP price has continued to push higher, suggesting this move may carry more weight than a simple relief rally.
_****Why Is Stellar (XLM) Price Up Today?**
However, the reaction from the 21-day moving average was clean and controlled. There was no sudden spike with subsequent rapid selling, but the price began to move upwards step by step. It usually reveals smooth purchasing, rather than speculative purchases for the short term.
When altcoins reclaim and hold this level, it often marks the point where momentum begins to turn. In OP’s case, the bounce helped shift the short-term trend from neutral to positive.
The Optimism Chart Shows Accumulation, Not Panic
Zooming out, the OP price appears to have formed a rounded base after its long downtrend. Following the sharp sell-off earlier in the cycle, price spent weeks moving sideways while volatility faded. This phase is often where sellers lose control and stronger hands begin accumulating.
Since then, short-term moving averages have started to curl upward, and price is now trading above them. That shift suggests downside pressure has eased and the market is trying to build a higher range.
_****SUI Short-Term Outlook: Where Could Price Be Headed Next?**
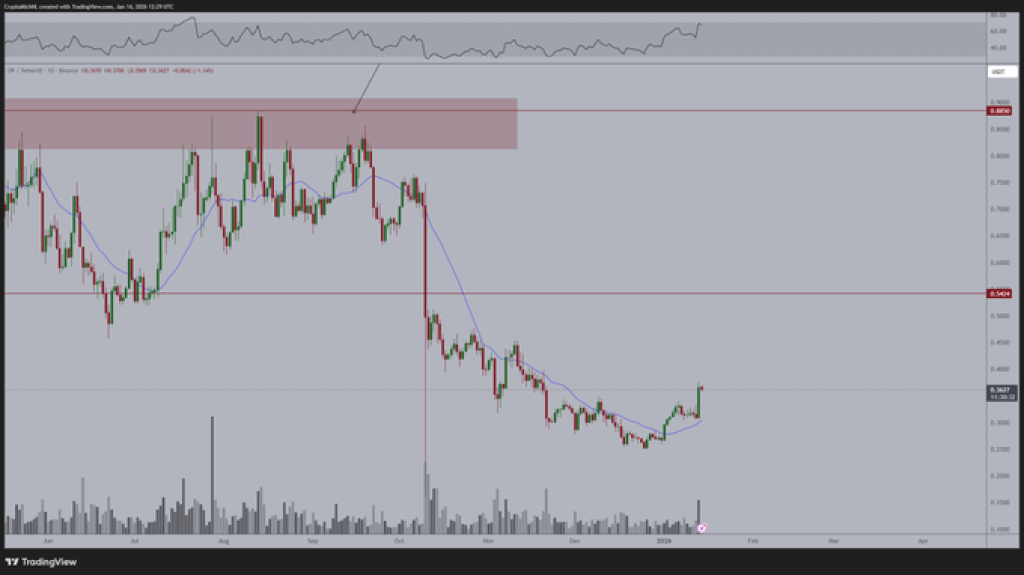
Source: X/MichealvandePoppe
Why Analysts Are Staying Patient With OP Price
Van de Poppe made it clear that he is not looking to sell OP at these levels. In his view, the project remains strong, and the current chart supports that outlook.
His comment that “the trend is now up” reflects the broader idea that OP has moved out of a defensive phase and into early recovery.
For this move to stay intact, the OP price needs to hold above recent support zones. Shallow pullbacks that respect prior lows would reinforce the bullish structure. A drop back below the 21-day average, however, would weaken the setup.
Right now, OP no longer looks heavy. Buyers are stepping in earlier, momentum has improved, and price behavior is shifting from breakdown to rebuilding. While confirmation will depend on follow-through, the current setup suggests this move is more than just a short-term bounce.
_****How Much Will 10,000 Monero (XMR) Be Worth in 2027?**
Related Articles
ETH short-term increase of 1.01%: ETF capital net inflow and ecological upgrade expectations resonate to drive a rebound
PEPE Slides Within Tight 24H Range — Will Momentum Hold as $0.053891 Caps Gains?
Solana Compresses Beneath $90 After Sharp Range Reclaim
Here’s Where Hedera (HBAR) Price is Headed In March
Bob Loukas Calls Bitcoin 'Horrendous' on Weekly Chart, Sets $49,000 Target - U.Today