Is Gala (GALA) Preparing for an Upside Breakout After Strong TVL Growth?
Key Takeaways
-
GALA gains as gaming tokens regain market momentum
-
Total Value Locked jumps 199% in a single day
-
Bullish descending broadening pattern forms on daily chart
-
Price reclaims 50-day moving average, signaling trend shift
-
Breakout above $0.0079 could open path toward $0.0099
Gaming-focused crypto tokens are quietly returning to the spotlight as risk appetite improves across the market. Axie Infinity (AXS) surged more than 21% in a single day, reviving interest in the gaming narrative. Riding that momentum, Gala (GALA) has also stepped into focus, gaining nearly 3% as the broader crypto market shows renewed strength on January 14, 2026.
Beyond price action, strong TVL growth and a bullish chart structure suggest GALA may be setting up for an upside continuation if key resistance levels are cleared.
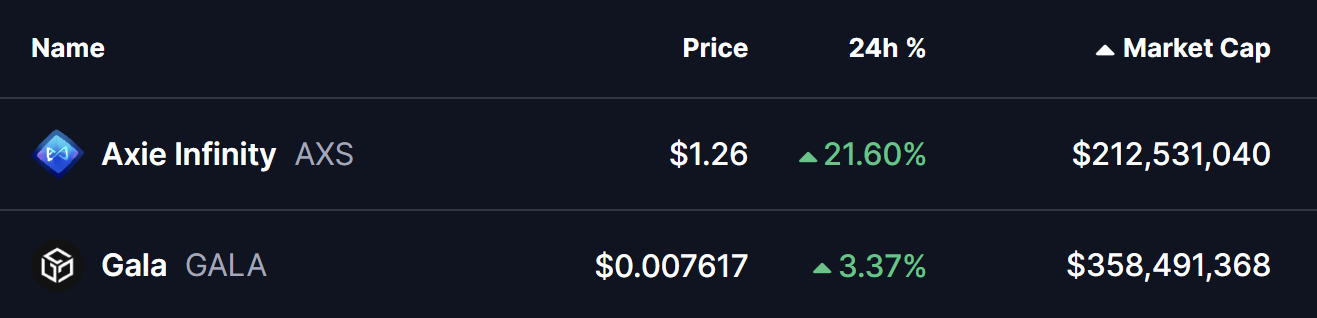
Source: Coinmarketcap
Strong TVL Growth Signals Renewed Network Activity
As momentum builds across gaming tokens, Gala’s ecosystem activity has surged sharply. Data shows GALA’s total value locked (TVL) jumped by nearly 203% in a single day, while the 30-day TVL increase stands at approximately 135%.

Gala Chain TVL/Source: Defillama
Such rapid expansion in locked value often reflects rising participation, increased utility, and renewed confidence in the underlying network — all of which tend to strengthen the case for sustained price recovery when paired with improving technicals.
Right-Angled Descending Broadening Pattern in Play
From a technical perspective, GALA’s daily chart is printing a right-angled descending broadening formation, a structure commonly associated with bullish reversals after prolonged consolidation.
For several weeks, price action remained capped beneath the $0.0076–$0.0079 resistance zone, with repeated upside attempts facing rejection. At the same time, the downside swings gradually expanded, creating the widening lower trendline characteristic of this pattern.
This structure began to shift following a strong rebound from the lower boundary. Buyers stepped in decisively, pushing GALA higher and enabling a reclaim of the 50-day moving average near $0.00691 — a level that had previously acted as persistent dynamic resistance.
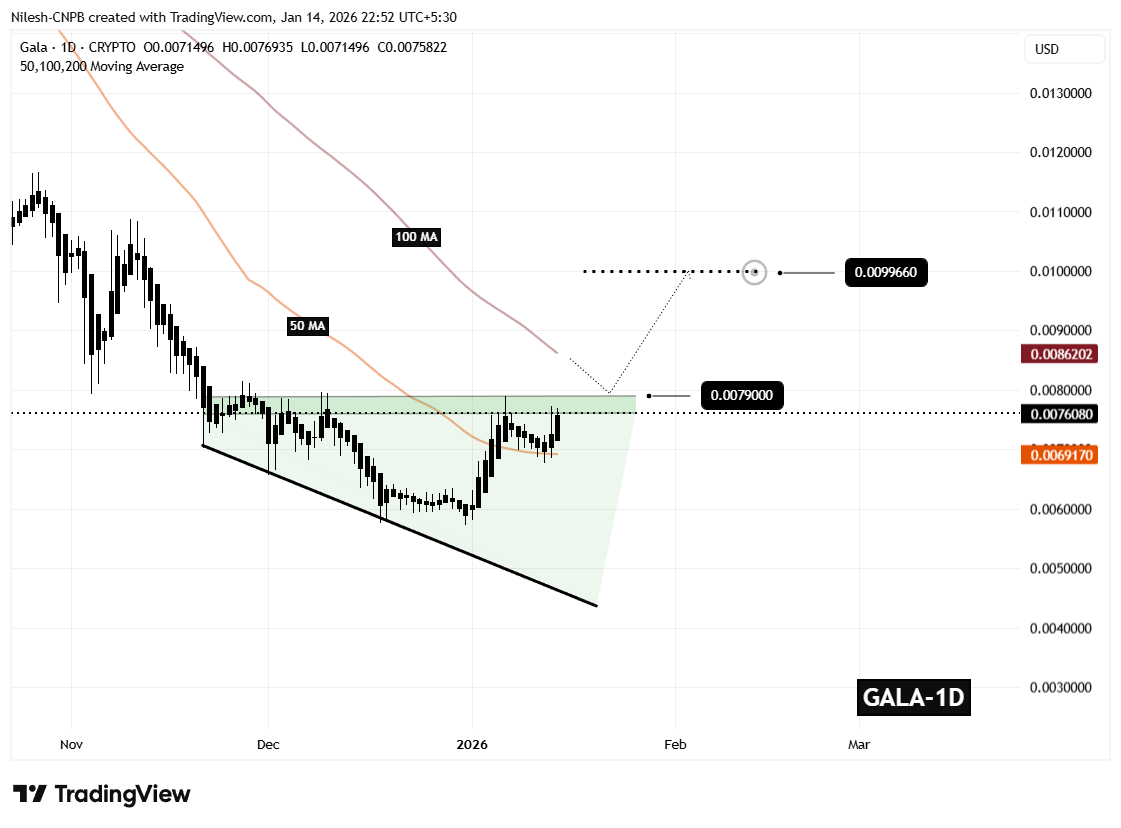
Gala (GALA) Daily Chart/Coinsprobe (Source: Tradingview)
Since then, upside momentum has continued to build, bringing price back into the same resistance band that previously capped rallies. GALA is now trading at a critical inflection zone, where the next directional move is likely to be defined.
What’s Next for GALA?
A decisive daily close above the $0.0079 resistance, followed by a successful retest, would confirm a breakout from the descending broadening formation and validate the broader bullish reversal setup.
Based on the depth of the pattern and its measured-move projection, a confirmed breakout could open the door toward the $0.00996 region, implying a potential upside of roughly 31% from current levels.
However, patience remains key. Until confirmation occurs, short-term pullbacks remain possible, including a retest of the 50-day moving average. Such moves would not invalidate the bullish structure as long as higher lows continue to form.
For now, the $0.0076–$0.0079 zone stands as the market’s decision area. How GALA behaves around this range will determine whether it transitions into a sustained bullish phase or remains range-bound in the near term.
Bottom Line
Gala (GALA) is approaching a key technical decision zone as rising TVL and a bullish chart structure align. A confirmed breakout could trigger a strong upside move, while failure may lead to short-term consolidation.
Disclaimer: The views and analysis presented in this article are for informational purposes only and reflect the author’s perspective, not financial advice. Technical patterns and indicators discussed are subject to market volatility and may or may not yield the anticipated results. Investors are advised to exercise caution, conduct independent research, and make decisions aligned with their individual risk tolerance.
About Author: Nilesh Hembade is the Founder and Lead Author of Coinsprobe, with over 5 years of experience in the cryptocurrency and blockchain industry. Since launching Coinsprobe in 2023, he has been providing daily, research-driven insights through in-depth market analysis, on-chain data, and technical research.
Related Articles
PIPPIN Surges Past $0.76 — $0.8472 Break or Pullback to $0.6715 Next?
PEPE Holds $0.053796 Support After 12% Drop Amid $580M Trading Spike
VIRTUAL Surges 23% After Channel Break — Can $0.7168 Turn Support?
Breakout Pushes $0.09656 DOGE Above Converging Trendlines as Price Trades Between Key Levels
HBAR Consolidates at $0.095 as Critical $0.094–$0.096 Zone Draws Focus