Bitcoin (BTC) Whale Accumulation Spikes — Where Could the Price Be Headed Next?

**Date: **Wed, Jan 07, 2026 | 10:40 AM GMT
Key Takeaways:
-
Whale Activity: Three wallets linked to a single entity accumulated 3,000 BTC during this week’s price dip.
-
Technical Setup: BTC is forming an Ascending Triangle on the daily chart, a classic bullish continuation signal.
-
Key Levels: Support at $89,900 is the line in the sand; a breakout above $95,000 triggers the $108K target.
The broader cryptocurrency market is showing a mild pullback today after a strong start to the year. Bitcoin (BTC), which had rallied close to the $94,000 mark earlier this week, has cooled off and is now trading below $92,000, down around 1.89% on the day.
While short-term price action reflects some profit-taking, activity beneath the surface tells a different story. Large holders appear to be positioning for a bigger move, and the latest daily chart structure continues to hint at a potential upside resolution.
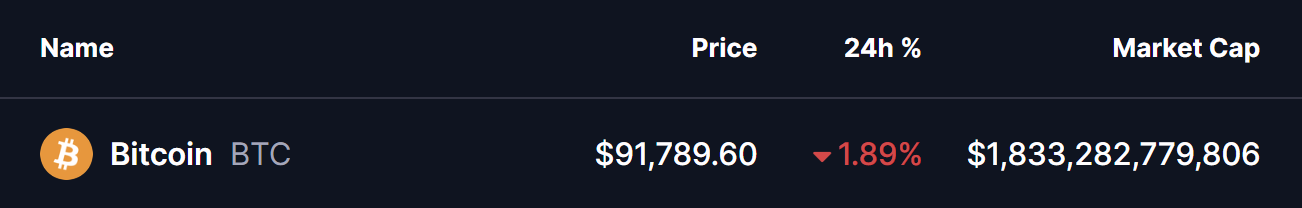
Source: Coinmarketcap
Is This Whale Buying a Sign of the Next BTC Breakout?
As Bitcoin gained momentum over the past several sessions, whales quietly stepped in with significant accumulation. According to data shared by Lookonchain, three wallets — potentially linked to the same entity — accumulated a combined 3,000 BTC worth roughly $280 million just hours ago.
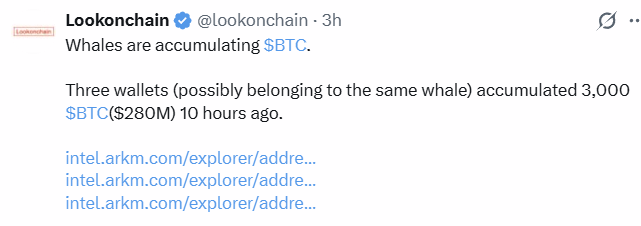
Source: Lookonchain (X)
This type of buying activity during a pullback often suggests long-term conviction rather than short-term speculation.
Ascending Triangle Taking Shape on the Daily Chart
On the daily timeframe, BTC appears to be forming an ascending triangle pattern — a structure commonly associated with bullish continuation when confirmed.
The pattern is defined by a rising trendline that has consistently supported higher lows since December, while price continues to face resistance in the $94,000–$95,000 zone. Each pullback has been increasingly shallow, signaling steady demand at higher price levels.
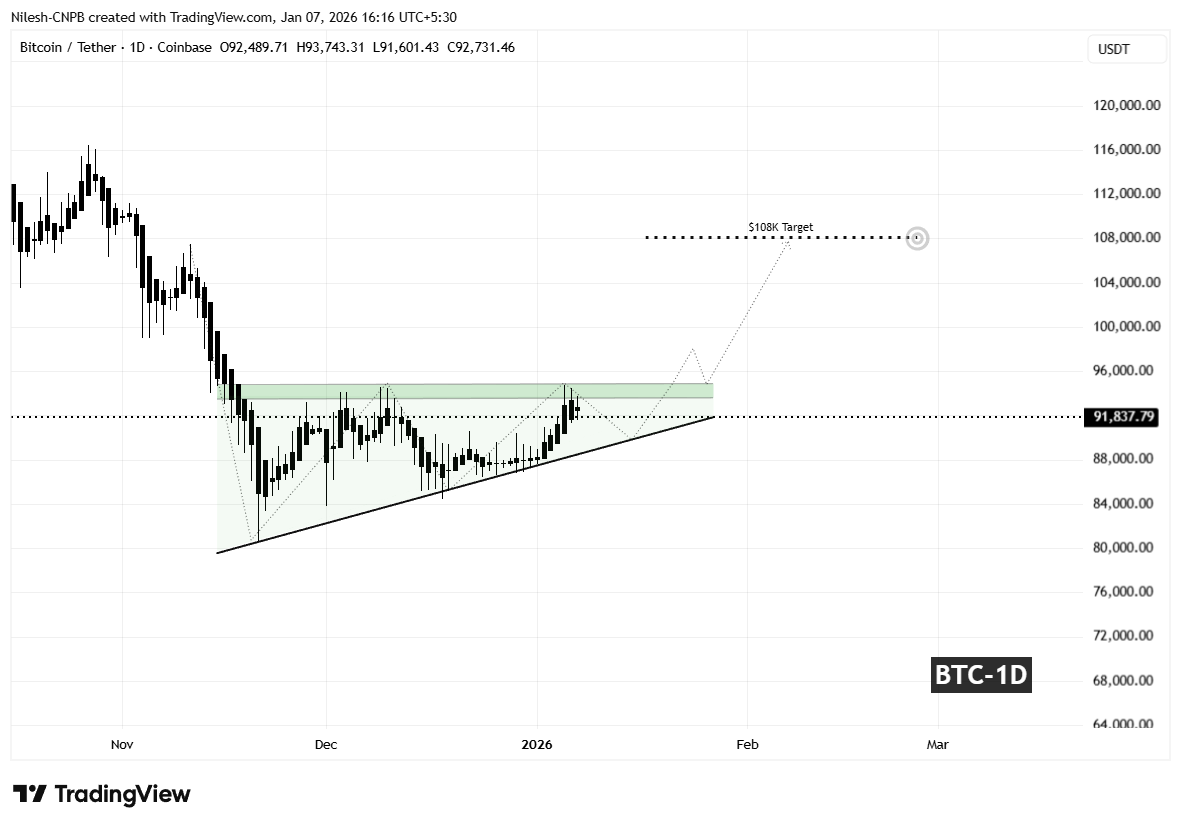
Bitcoin (BTC) Daily Chart/Coinsprobe (Source: Tradingview)
Today’s rejection from resistance pushed BTC back below $92,000, but price remains well above the ascending support trendline. A controlled pullback toward the $89,900–$90,000 area would still keep the broader structure intact and could serve as a healthy reset before the next attempt higher.
Will BTC Hit $108,000? The Scenario Outlook
The $89,000–$90,000 region now plays a crucial role in maintaining bullish structure. As long as BTC continues to hold above this rising trendline, the probability of another move toward the $94,000–$95,000 resistance zone remains elevated.
A decisive daily close above horizontal resistance would confirm an ascending triangle breakout and shift momentum firmly back in favor of the bulls. Such a move could also trigger fresh participation from sidelined buyers.
Based on the measured move projection of the triangle, a confirmed breakout points toward a potential upside target near $108,000 — matching the extension zone marked on the chart. From the breakout area, this would represent roughly a 14% upside move.
On the flip side, failure to hold the ascending support could invalidate the pattern and expose BTC to a deeper corrective move. Until either scenario is confirmed, price action within this structure remains a battle between patient accumulation and short-term selling pressure.
The Bottom Line: While Bitcoin (BTC) has dipped below $92,000, “Smart Money” is using the pullback to load up. On-chain data confirms that three major whales just accumulated $280 million in BTC. Technically, Bitcoin is coiled inside a massive Ascending Triangle, with a confirmed breakout targeting the $108,000 level.
Disclaimer: The views and analysis presented in this article are for informational purposes only and reflect the author’s perspective, not financial advice. Technical patterns and indicators discussed are subject to market volatility and may or may not yield the anticipated results. Investors are advised to exercise caution, conduct independent research, and make decisions aligned with their individual risk tolerance.
About Author: Nilesh Hembade is the Founder and Lead Author of Coinsprobe, with over 5 years of experience in the cryptocurrency and blockchain industry. Since launching Coinsprobe in 2023, he has been providing daily, research-driven insights through in-depth market analysis, on-chain data, and technical research.
Related Articles
BTC short-term decline of 0.81%: Futures long liquidation wave triggers passive selling and liquidity resonance, intensifying volatility
Best Crypto To Buy: Pepeto Official Launch Date Approaches While Bitcoin Hyper and Digitap Struggle To Keep Up